

Key Insights
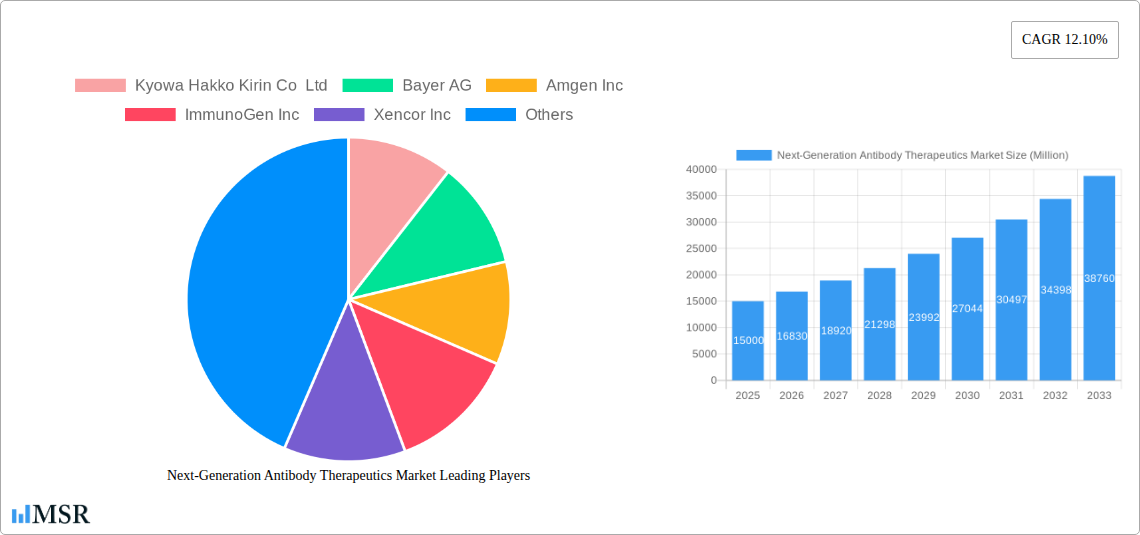
The Next-Generation Antibody Therapeutics market is poised for significant expansion, with a projected market size of 7.63 billion by 2025. This growth is underpinned by a robust Compound Annual Growth Rate (CAGR) of 10.9%. Key drivers include the escalating incidence of chronic diseases such as cancer and autoimmune disorders, alongside the proven efficacy of advanced antibody-based treatments like Antibody-Drug Conjugates (ADCs), Bispecific Antibodies (BsAbs), and Fc-Engineered Antibodies. Technological innovations enhancing therapeutic precision, safety, and targeted delivery further bolster market momentum.
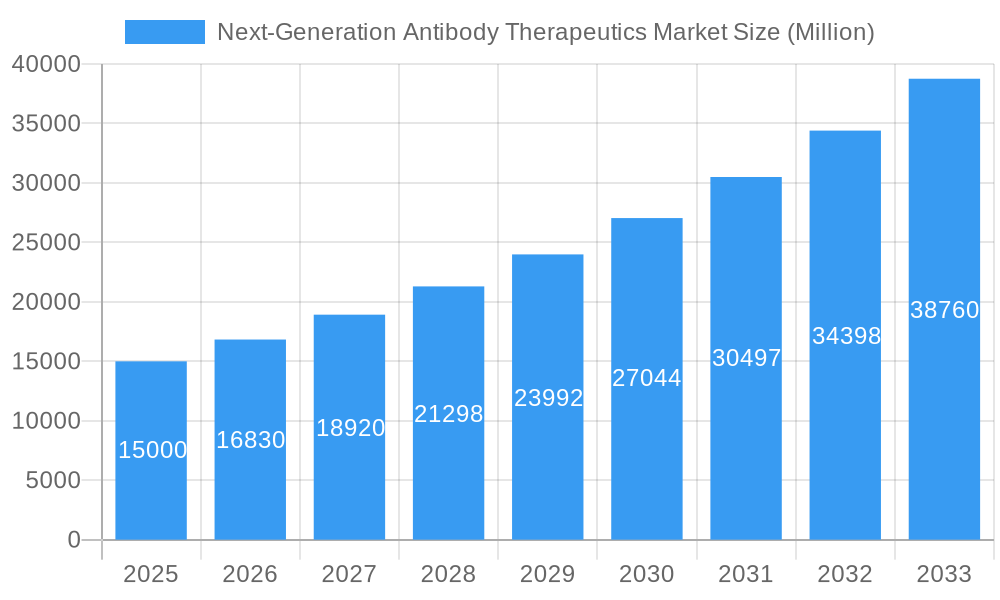
Next-Generation Antibody Therapeutics Market Market Size (In Billion)
Oncology currently leads the market share, with the Autoimmune/Inflammatory segment exhibiting rapid advancement driven by intensified research and development. Leading pharmaceutical entities, including Amgen, Roche, and Bristol-Myers Squibb, are actively investing, fostering innovation and a competitive environment that offers diverse treatment modalities. Geographically, North America dominates due to its advanced healthcare infrastructure and high adoption of novel therapies. However, the Asia-Pacific region is expected to experience substantial growth, propelled by increasing healthcare investments and greater awareness of advanced treatment options.
Next-Generation Antibody Therapeutics Market Company Market Share
The competitive arena features a dynamic interplay between large pharmaceutical corporations and specialized biotechnology firms. While established players leverage extensive infrastructure and marketing power, emerging biotech companies are crucial contributors to innovation through dedicated research. This competitive landscape cultivates continuous improvements in therapeutic outcomes and the development of novel strategies to address unmet medical needs. Despite these favorable trends, significant challenges persist, including high development costs and stringent regulatory processes, which represent substantial barriers to market entry. Furthermore, potential long-term adverse effects and prohibitive treatment costs impact market penetration and patient accessibility. Sustained growth will depend on effectively addressing these challenges, navigating the evolving regulatory framework, and consistently demonstrating superior clinical efficacy and improved safety profiles.
Next-Generation Antibody Therapeutics Market: A Comprehensive Report (2019-2033)
This comprehensive report provides an in-depth analysis of the Next-Generation Antibody Therapeutics market, offering crucial insights for stakeholders across the pharmaceutical and biotechnology industries. The study period spans from 2019 to 2033, with 2025 serving as the base and estimated year. The forecast period extends from 2025 to 2033, encompassing the historical period from 2019 to 2024. The report delves into market dynamics, key segments, leading players, and emerging opportunities, equipping readers with actionable intelligence to navigate this rapidly evolving landscape. The market is projected to reach xx Million by 2033, exhibiting a CAGR of xx% during the forecast period.
Next-Generation Antibody Therapeutics Market Market Concentration & Dynamics
The Next-Generation Antibody Therapeutics market exhibits a moderately concentrated landscape, with a few key players commanding significant market share. However, the market is dynamic, driven by robust innovation and a constant influx of new therapies. Market concentration is influenced by factors such as the high cost of R&D, stringent regulatory requirements, and the need for specialized manufacturing capabilities. The innovative ecosystem is characterized by strong collaborations between pharmaceutical giants and smaller biotech companies, fostering a rapid pace of technological advancements. Regulatory frameworks, particularly in major markets like the US and EU, play a crucial role in shaping market access and timelines for new product approvals. Substitute products, including traditional therapies and emerging modalities, pose competitive pressures. End-user trends are influenced by the increasing prevalence of chronic diseases, growing demand for personalized medicine, and a heightened focus on improved patient outcomes. M&A activity has been significant, with an estimated xx M&A deals concluded in the past five years, consolidating market share and accelerating product pipelines. Key metrics analyzed include market share of leading players (e.g., Amgen Inc. holds an estimated xx% market share in 2025), and the number of M&A transactions within each therapeutic area and technology segment.
Next-Generation Antibody Therapeutics Market Industry Insights & Trends
The Next-Generation Antibody Therapeutics market is experiencing robust growth driven by several factors. The increasing prevalence of chronic diseases such as cancer and autoimmune disorders fuels the demand for innovative treatment options. Technological advancements, including the development of Antibody-Drug Conjugates (ADCs), bispecific antibodies, and Fc-engineered antibodies, are expanding therapeutic possibilities and improving treatment efficacy. Evolving consumer behaviors, including a preference for targeted therapies with fewer side effects, also contribute to market growth. The global market size was valued at xx Million in 2024 and is projected to reach xx Million by 2033, indicating significant market expansion. The rising adoption of personalized medicine strategies, coupled with increased investments in R&D, further bolsters market expansion. Technological disruptions, such as advancements in AI-driven drug discovery and development, are accelerating innovation and shortening development timelines. Market growth is also fueled by increasing healthcare expenditure globally, alongside favorable regulatory policies encouraging innovation in the biopharmaceutical sector.
Key Markets & Segments Leading Next-Generation Antibody Therapeutics Market
The Oncology therapeutic area dominates the Next-Generation Antibody Therapeutics market, representing the largest segment by revenue, with an estimated market share of xx% in 2025. This is driven by a high prevalence of cancer globally and the significant unmet medical needs within this area. The US and Europe are currently the leading regional markets, owing to higher healthcare expenditure, robust healthcare infrastructure, and a significant presence of major pharmaceutical players.
Key Drivers for Market Dominance:
- High Prevalence of Cancer: A major driver for the Oncology segment’s dominance.
- Technological Advancements: Continuous innovation in ADC technology and bispecific antibodies caters to the unmet needs in cancer treatment.
- Favorable Regulatory Environment: Efficient regulatory pathways in the US and Europe accelerate market entry for new therapies.
- High Healthcare Expenditure: Significant investments in healthcare in developed countries support the high demand and affordability of advanced therapeutics.
Dominant Segments:
- Therapeutic Area: Oncology significantly outweighs the Autoimmune/Inflammatory segment.
- Technology: Antibody-Drug Conjugates (ADCs) and Bispecific Antibodies (BsAbs) hold the largest market share due to their enhanced efficacy and targeted action.
Within the technologies, Antibody-Drug Conjugates (ADCs) hold a significant market share due to their improved efficacy in targeting cancer cells with reduced systemic toxicity. Bispecific Antibodies (BsAbs) are another rapidly growing segment, enabling simultaneous targeting of multiple antigens, enhancing therapeutic potential.
Next-Generation Antibody Therapeutics Market Product Developments
Recent years have witnessed remarkable progress in next-generation antibody therapeutics, encompassing novel ADC payloads, engineered antibody formats with improved pharmacokinetics and pharmacodynamics, and innovative bispecific antibody designs. These advancements enhance treatment efficacy, broaden therapeutic applications, and address limitations of previous generations of antibody therapies. The focus on personalized medicine is further driving the development of targeted therapies, improving patient outcomes while minimizing adverse effects. The market is witnessing a shift towards more sophisticated antibody engineering techniques, allowing for precise control over antibody properties and functionalities, leading to competitive advantages for companies with advanced technology platforms.
Challenges in the Next-Generation Antibody Therapeutics Market Market
Several challenges hinder the growth of the Next-Generation Antibody Therapeutics market. Stringent regulatory pathways and lengthy approval processes delay market entry and increase development costs. High manufacturing costs and complex supply chains pose significant hurdles, particularly for novel and sophisticated therapies. The intensive competition amongst major pharmaceutical companies, each striving to establish a dominant market position, is a further challenge. This intensifies the pressure to develop innovative products and to achieve favorable pricing strategies. These challenges collectively affect market growth rate and accessibility of the medicines to the end user.
Forces Driving Next-Generation Antibody Therapeutics Market Growth
Technological advancements, particularly in antibody engineering and drug delivery systems, are major growth drivers. The increasing prevalence of chronic diseases, coupled with growing healthcare expenditure, fuels demand for innovative therapeutic options. Furthermore, favorable regulatory policies that incentivize innovation and accelerate the drug approval process are crucial drivers, fostering market expansion.
Challenges in the Next-Generation Antibody Therapeutics Market Market
Long-term growth will be driven by continued innovation in antibody engineering, leading to more effective and targeted therapies. Strategic partnerships between large pharmaceutical companies and smaller biotech firms are crucial for accelerating the development and commercialization of new therapies. Expansion into emerging markets with significant unmet medical needs presents significant opportunities for future growth.
Emerging Opportunities in Next-Generation Antibody Therapeutics Market
Emerging opportunities lie in the development of next-generation antibody formats, including multispecific antibodies and antibody-drug conjugates with improved payloads. Expansion into new therapeutic areas beyond oncology and autoimmune/inflammatory diseases, such as infectious diseases and neurodegenerative disorders, offer significant market potential. Growing interest in personalized medicine and companion diagnostics will further drive market growth.
Leading Players in the Next-Generation Antibody Therapeutics Market Sector
Key Milestones in Next-Generation Antibody Therapeutics Market Industry
- July 2022: Byondis received biologics license application acceptance from the U.S. FDA for Vic-Trastuzumab Duocarmazine (SYD985), an antibody-drug conjugate, as a treatment for patients with HER2-positive advanced breast cancer. This milestone highlights the growing interest in ADCs and their potential to revolutionize cancer treatment.
- December 2022: Sorrento Therapeutics, Inc. received clearance from the U.S. FDA to initiate clinical trials with its next-generation mRNA (STI-1557) vaccine against SARS-CoV-2 Omicron variants. This demonstrates the continued development and application of mRNA technology beyond its initial use in COVID-19 vaccines.
Strategic Outlook for Next-Generation Antibody Therapeutics Market Market
The future of the Next-Generation Antibody Therapeutics market is exceptionally promising, driven by continuous technological innovation, increased R&D investments, and a growing understanding of the complexities of disease mechanisms. Strategic partnerships and collaborations between large pharmaceutical companies and smaller biotechnology firms are pivotal in accelerating the development and commercialization of novel therapies. The expansion into novel therapeutic areas and the development of personalized therapies will contribute to continued substantial market growth in the coming years. The market is poised for sustained expansion, fueled by both incremental improvements and paradigm-shifting advancements in antibody engineering and drug delivery.
Next-Generation Antibody Therapeutics Market Segmentation
-
1. Therapeutic Area
- 1.1. Oncology
- 1.2. Autoimmune/Inflammatory
-
2. Technology
- 2.1. Antibody-Drug Conjugates (ADCs)
- 2.2. Bispecific Antibodies (BsAbs)
- 2.3. Fc-Engineered Antibodies
- 2.4. Antibody
- 2.5. Biosimilar Antibody Products
Next-Generation Antibody Therapeutics Market Segmentation By Geography
-
1. North America
- 1.1. United States
- 1.2. Canada
- 1.3. Mexico
-
2. Europe
- 2.1. Germany
- 2.2. United Kingdom
- 2.3. France
- 2.4. Italy
- 2.5. Spain
- 2.6. Rest of Europe
-
3. Asia Pacific
- 3.1. China
- 3.2. Japan
- 3.3. India
- 3.4. Australia
- 3.5. South Korea
- 3.6. Rest of Asia Pacific
-
4. Middle East and Africa
- 4.1. GCC
- 4.2. South Africa
- 4.3. Rest of Middle East and Africa
-
5. South America
- 5.1. Brazil
- 5.2. Argentina
- 5.3. Rest of South America
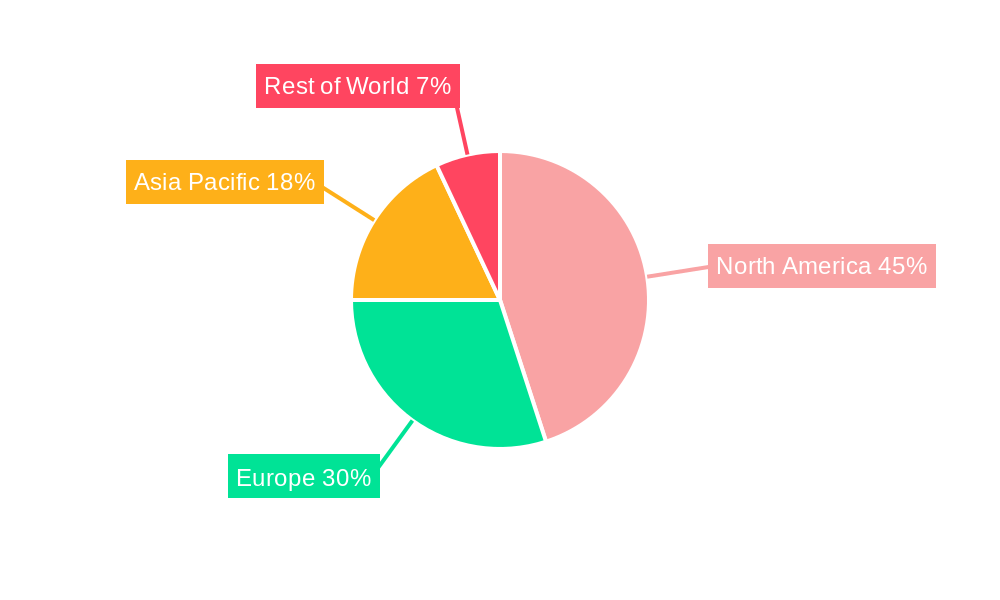
Next-Generation Antibody Therapeutics Market Regional Market Share
Geographic Coverage of Next-Generation Antibody Therapeutics Market
Next-Generation Antibody Therapeutics Market REPORT HIGHLIGHTS
| Aspects | Details |
|---|---|
| Study Period | 2020-2034 |
| Base Year | 2025 |
| Estimated Year | 2026 |
| Forecast Period | 2026-2034 |
| Historical Period | 2020-2025 |
| Growth Rate | CAGR of 10.9% from 2020-2034 |
| Segmentation |
|
Table of Contents
- 1. Introduction
- 1.1. Research Scope
- 1.2. Market Segmentation
- 1.3. Research Objective
- 1.4. Definitions and Assumptions
- 2. Executive Summary
- 2.1. Market Snapshot
- 3. Market Dynamics
- 3.1. Market Drivers
- 3.2. Market Restrains
- 3.3. Market Trends
- 3.4. Market Opportunities
- 4. Market Factor Analysis
- 4.1. Porters Five Forces
- 4.1.1. Bargaining Power of Suppliers
- 4.1.2. Bargaining Power of Buyers
- 4.1.3. Threat of New Entrants
- 4.1.4. Threat of Substitutes
- 4.1.5. Competitive Rivalry
- 4.2. PESTEL analysis
- 4.3. BCG Analysis
- 4.3.1. Stars (High Growth, High Market Share)
- 4.3.2. Cash Cows (Low Growth, High Market Share)
- 4.3.3. Question Mark (High Growth, Low Market Share)
- 4.3.4. Dogs (Low Growth, Low Market Share)
- 4.4. Ansoff Matrix Analysis
- 4.5. Supply Chain Analysis
- 4.6. Regulatory Landscape
- 4.7. Current Market Potential and Opportunity Assessment (TAM–SAM–SOM Framework)
- 4.8. MSR Analyst Note
- 4.1. Porters Five Forces
- 5. Market Analysis, Insights and Forecast 2021-2033
- 5.1. Market Analysis, Insights and Forecast - by Therapeutic Area
- 5.1.1. Oncology
- 5.1.2. Autoimmune/Inflammatory
- 5.2. Market Analysis, Insights and Forecast - by Technology
- 5.2.1. Antibody-Drug Conjugates (ADCs)
- 5.2.2. Bispecific Antibodies (BsAbs)
- 5.2.3. Fc-Engineered Antibodies
- 5.2.4. Antibody
- 5.2.5. Biosimilar Antibody Products
- 5.3. Market Analysis, Insights and Forecast - by Region
- 5.3.1. North America
- 5.3.2. Europe
- 5.3.3. Asia Pacific
- 5.3.4. Middle East and Africa
- 5.3.5. South America
- 5.1. Market Analysis, Insights and Forecast - by Therapeutic Area
- 6. Global Next-Generation Antibody Therapeutics Market Analysis, Insights and Forecast, 2021-2033
- 6.1. Market Analysis, Insights and Forecast - by Therapeutic Area
- 6.1.1. Oncology
- 6.1.2. Autoimmune/Inflammatory
- 6.2. Market Analysis, Insights and Forecast - by Technology
- 6.2.1. Antibody-Drug Conjugates (ADCs)
- 6.2.2. Bispecific Antibodies (BsAbs)
- 6.2.3. Fc-Engineered Antibodies
- 6.2.4. Antibody
- 6.2.5. Biosimilar Antibody Products
- 6.1. Market Analysis, Insights and Forecast - by Therapeutic Area
- 7. North America Next-Generation Antibody Therapeutics Market Analysis, Insights and Forecast, 2020-2032
- 7.1. Market Analysis, Insights and Forecast - by Therapeutic Area
- 7.1.1. Oncology
- 7.1.2. Autoimmune/Inflammatory
- 7.2. Market Analysis, Insights and Forecast - by Technology
- 7.2.1. Antibody-Drug Conjugates (ADCs)
- 7.2.2. Bispecific Antibodies (BsAbs)
- 7.2.3. Fc-Engineered Antibodies
- 7.2.4. Antibody
- 7.2.5. Biosimilar Antibody Products
- 7.1. Market Analysis, Insights and Forecast - by Therapeutic Area
- 8. Europe Next-Generation Antibody Therapeutics Market Analysis, Insights and Forecast, 2020-2032
- 8.1. Market Analysis, Insights and Forecast - by Therapeutic Area
- 8.1.1. Oncology
- 8.1.2. Autoimmune/Inflammatory
- 8.2. Market Analysis, Insights and Forecast - by Technology
- 8.2.1. Antibody-Drug Conjugates (ADCs)
- 8.2.2. Bispecific Antibodies (BsAbs)
- 8.2.3. Fc-Engineered Antibodies
- 8.2.4. Antibody
- 8.2.5. Biosimilar Antibody Products
- 8.1. Market Analysis, Insights and Forecast - by Therapeutic Area
- 9. Asia Pacific Next-Generation Antibody Therapeutics Market Analysis, Insights and Forecast, 2020-2032
- 9.1. Market Analysis, Insights and Forecast - by Therapeutic Area
- 9.1.1. Oncology
- 9.1.2. Autoimmune/Inflammatory
- 9.2. Market Analysis, Insights and Forecast - by Technology
- 9.2.1. Antibody-Drug Conjugates (ADCs)
- 9.2.2. Bispecific Antibodies (BsAbs)
- 9.2.3. Fc-Engineered Antibodies
- 9.2.4. Antibody
- 9.2.5. Biosimilar Antibody Products
- 9.1. Market Analysis, Insights and Forecast - by Therapeutic Area
- 10. Middle East and Africa Next-Generation Antibody Therapeutics Market Analysis, Insights and Forecast, 2020-2032
- 10.1. Market Analysis, Insights and Forecast - by Therapeutic Area
- 10.1.1. Oncology
- 10.1.2. Autoimmune/Inflammatory
- 10.2. Market Analysis, Insights and Forecast - by Technology
- 10.2.1. Antibody-Drug Conjugates (ADCs)
- 10.2.2. Bispecific Antibodies (BsAbs)
- 10.2.3. Fc-Engineered Antibodies
- 10.2.4. Antibody
- 10.2.5. Biosimilar Antibody Products
- 10.1. Market Analysis, Insights and Forecast - by Therapeutic Area
- 11. South America Next-Generation Antibody Therapeutics Market Analysis, Insights and Forecast, 2020-2032
- 11.1. Market Analysis, Insights and Forecast - by Therapeutic Area
- 11.1.1. Oncology
- 11.1.2. Autoimmune/Inflammatory
- 11.2. Market Analysis, Insights and Forecast - by Technology
- 11.2.1. Antibody-Drug Conjugates (ADCs)
- 11.2.2. Bispecific Antibodies (BsAbs)
- 11.2.3. Fc-Engineered Antibodies
- 11.2.4. Antibody
- 11.2.5. Biosimilar Antibody Products
- 11.1. Market Analysis, Insights and Forecast - by Therapeutic Area
- 12. Competitive Analysis
- 12.1. Company Profiles
- 12.1.1 Kyowa Hakko Kirin Co Ltd
- 12.1.1.1. Company Overview
- 12.1.1.2. Products
- 12.1.1.3. Company Financials
- 12.1.1.4. SWOT Analysis
- 12.1.2 Bayer AG
- 12.1.2.1. Company Overview
- 12.1.2.2. Products
- 12.1.2.3. Company Financials
- 12.1.2.4. SWOT Analysis
- 12.1.3 Amgen Inc
- 12.1.3.1. Company Overview
- 12.1.3.2. Products
- 12.1.3.3. Company Financials
- 12.1.3.4. SWOT Analysis
- 12.1.4 ImmunoGen Inc
- 12.1.4.1. Company Overview
- 12.1.4.2. Products
- 12.1.4.3. Company Financials
- 12.1.4.4. SWOT Analysis
- 12.1.5 Xencor Inc
- 12.1.5.1. Company Overview
- 12.1.5.2. Products
- 12.1.5.3. Company Financials
- 12.1.5.4. SWOT Analysis
- 12.1.6 F Hoffmann-La Roche Ltd
- 12.1.6.1. Company Overview
- 12.1.6.2. Products
- 12.1.6.3. Company Financials
- 12.1.6.4. SWOT Analysis
- 12.1.7 GlaxoSmithKline Plc
- 12.1.7.1. Company Overview
- 12.1.7.2. Products
- 12.1.7.3. Company Financials
- 12.1.7.4. SWOT Analysis
- 12.1.8 Biogen
- 12.1.8.1. Company Overview
- 12.1.8.2. Products
- 12.1.8.3. Company Financials
- 12.1.8.4. SWOT Analysis
- 12.1.9 AstraZeneca Plc
- 12.1.9.1. Company Overview
- 12.1.9.2. Products
- 12.1.9.3. Company Financials
- 12.1.9.4. SWOT Analysis
- 12.1.10 Seagen Inc
- 12.1.10.1. Company Overview
- 12.1.10.2. Products
- 12.1.10.3. Company Financials
- 12.1.10.4. SWOT Analysis
- 12.1.11 Bristol-Myers Squibb Company
- 12.1.11.1. Company Overview
- 12.1.11.2. Products
- 12.1.11.3. Company Financials
- 12.1.11.4. SWOT Analysis
- 12.1.12 Pfizer Inc
- 12.1.12.1. Company Overview
- 12.1.12.2. Products
- 12.1.12.3. Company Financials
- 12.1.12.4. SWOT Analysis
- 12.1.1 Kyowa Hakko Kirin Co Ltd
- 12.2. Market Entropy
- 12.2.1 Company's Key Areas Served
- 12.2.2 Recent Developments
- 12.3. Company Market Share Analysis 2025
- 12.3.1 Top 5 Companies Market Share Analysis
- 12.3.2 Top 3 Companies Market Share Analysis
- 12.4. List of Potential Customers
- 13. Research Methodology
List of Figures
- Figure 1: Global Next-Generation Antibody Therapeutics Market Revenue Breakdown (billion, %) by Region 2025 & 2033
- Figure 2: Global Next-Generation Antibody Therapeutics Market Volume Breakdown (K Unit, %) by Region 2025 & 2033
- Figure 3: North America Next-Generation Antibody Therapeutics Market Revenue (billion), by Therapeutic Area 2025 & 2033
- Figure 4: North America Next-Generation Antibody Therapeutics Market Volume (K Unit), by Therapeutic Area 2025 & 2033
- Figure 5: North America Next-Generation Antibody Therapeutics Market Revenue Share (%), by Therapeutic Area 2025 & 2033
- Figure 6: North America Next-Generation Antibody Therapeutics Market Volume Share (%), by Therapeutic Area 2025 & 2033
- Figure 7: North America Next-Generation Antibody Therapeutics Market Revenue (billion), by Technology 2025 & 2033
- Figure 8: North America Next-Generation Antibody Therapeutics Market Volume (K Unit), by Technology 2025 & 2033
- Figure 9: North America Next-Generation Antibody Therapeutics Market Revenue Share (%), by Technology 2025 & 2033
- Figure 10: North America Next-Generation Antibody Therapeutics Market Volume Share (%), by Technology 2025 & 2033
- Figure 11: North America Next-Generation Antibody Therapeutics Market Revenue (billion), by Country 2025 & 2033
- Figure 12: North America Next-Generation Antibody Therapeutics Market Volume (K Unit), by Country 2025 & 2033
- Figure 13: North America Next-Generation Antibody Therapeutics Market Revenue Share (%), by Country 2025 & 2033
- Figure 14: North America Next-Generation Antibody Therapeutics Market Volume Share (%), by Country 2025 & 2033
- Figure 15: Europe Next-Generation Antibody Therapeutics Market Revenue (billion), by Therapeutic Area 2025 & 2033
- Figure 16: Europe Next-Generation Antibody Therapeutics Market Volume (K Unit), by Therapeutic Area 2025 & 2033
- Figure 17: Europe Next-Generation Antibody Therapeutics Market Revenue Share (%), by Therapeutic Area 2025 & 2033
- Figure 18: Europe Next-Generation Antibody Therapeutics Market Volume Share (%), by Therapeutic Area 2025 & 2033
- Figure 19: Europe Next-Generation Antibody Therapeutics Market Revenue (billion), by Technology 2025 & 2033
- Figure 20: Europe Next-Generation Antibody Therapeutics Market Volume (K Unit), by Technology 2025 & 2033
- Figure 21: Europe Next-Generation Antibody Therapeutics Market Revenue Share (%), by Technology 2025 & 2033
- Figure 22: Europe Next-Generation Antibody Therapeutics Market Volume Share (%), by Technology 2025 & 2033
- Figure 23: Europe Next-Generation Antibody Therapeutics Market Revenue (billion), by Country 2025 & 2033
- Figure 24: Europe Next-Generation Antibody Therapeutics Market Volume (K Unit), by Country 2025 & 2033
- Figure 25: Europe Next-Generation Antibody Therapeutics Market Revenue Share (%), by Country 2025 & 2033
- Figure 26: Europe Next-Generation Antibody Therapeutics Market Volume Share (%), by Country 2025 & 2033
- Figure 27: Asia Pacific Next-Generation Antibody Therapeutics Market Revenue (billion), by Therapeutic Area 2025 & 2033
- Figure 28: Asia Pacific Next-Generation Antibody Therapeutics Market Volume (K Unit), by Therapeutic Area 2025 & 2033
- Figure 29: Asia Pacific Next-Generation Antibody Therapeutics Market Revenue Share (%), by Therapeutic Area 2025 & 2033
- Figure 30: Asia Pacific Next-Generation Antibody Therapeutics Market Volume Share (%), by Therapeutic Area 2025 & 2033
- Figure 31: Asia Pacific Next-Generation Antibody Therapeutics Market Revenue (billion), by Technology 2025 & 2033
- Figure 32: Asia Pacific Next-Generation Antibody Therapeutics Market Volume (K Unit), by Technology 2025 & 2033
- Figure 33: Asia Pacific Next-Generation Antibody Therapeutics Market Revenue Share (%), by Technology 2025 & 2033
- Figure 34: Asia Pacific Next-Generation Antibody Therapeutics Market Volume Share (%), by Technology 2025 & 2033
- Figure 35: Asia Pacific Next-Generation Antibody Therapeutics Market Revenue (billion), by Country 2025 & 2033
- Figure 36: Asia Pacific Next-Generation Antibody Therapeutics Market Volume (K Unit), by Country 2025 & 2033
- Figure 37: Asia Pacific Next-Generation Antibody Therapeutics Market Revenue Share (%), by Country 2025 & 2033
- Figure 38: Asia Pacific Next-Generation Antibody Therapeutics Market Volume Share (%), by Country 2025 & 2033
- Figure 39: Middle East and Africa Next-Generation Antibody Therapeutics Market Revenue (billion), by Therapeutic Area 2025 & 2033
- Figure 40: Middle East and Africa Next-Generation Antibody Therapeutics Market Volume (K Unit), by Therapeutic Area 2025 & 2033
- Figure 41: Middle East and Africa Next-Generation Antibody Therapeutics Market Revenue Share (%), by Therapeutic Area 2025 & 2033
- Figure 42: Middle East and Africa Next-Generation Antibody Therapeutics Market Volume Share (%), by Therapeutic Area 2025 & 2033
- Figure 43: Middle East and Africa Next-Generation Antibody Therapeutics Market Revenue (billion), by Technology 2025 & 2033
- Figure 44: Middle East and Africa Next-Generation Antibody Therapeutics Market Volume (K Unit), by Technology 2025 & 2033
- Figure 45: Middle East and Africa Next-Generation Antibody Therapeutics Market Revenue Share (%), by Technology 2025 & 2033
- Figure 46: Middle East and Africa Next-Generation Antibody Therapeutics Market Volume Share (%), by Technology 2025 & 2033
- Figure 47: Middle East and Africa Next-Generation Antibody Therapeutics Market Revenue (billion), by Country 2025 & 2033
- Figure 48: Middle East and Africa Next-Generation Antibody Therapeutics Market Volume (K Unit), by Country 2025 & 2033
- Figure 49: Middle East and Africa Next-Generation Antibody Therapeutics Market Revenue Share (%), by Country 2025 & 2033
- Figure 50: Middle East and Africa Next-Generation Antibody Therapeutics Market Volume Share (%), by Country 2025 & 2033
- Figure 51: South America Next-Generation Antibody Therapeutics Market Revenue (billion), by Therapeutic Area 2025 & 2033
- Figure 52: South America Next-Generation Antibody Therapeutics Market Volume (K Unit), by Therapeutic Area 2025 & 2033
- Figure 53: South America Next-Generation Antibody Therapeutics Market Revenue Share (%), by Therapeutic Area 2025 & 2033
- Figure 54: South America Next-Generation Antibody Therapeutics Market Volume Share (%), by Therapeutic Area 2025 & 2033
- Figure 55: South America Next-Generation Antibody Therapeutics Market Revenue (billion), by Technology 2025 & 2033
- Figure 56: South America Next-Generation Antibody Therapeutics Market Volume (K Unit), by Technology 2025 & 2033
- Figure 57: South America Next-Generation Antibody Therapeutics Market Revenue Share (%), by Technology 2025 & 2033
- Figure 58: South America Next-Generation Antibody Therapeutics Market Volume Share (%), by Technology 2025 & 2033
- Figure 59: South America Next-Generation Antibody Therapeutics Market Revenue (billion), by Country 2025 & 2033
- Figure 60: South America Next-Generation Antibody Therapeutics Market Volume (K Unit), by Country 2025 & 2033
- Figure 61: South America Next-Generation Antibody Therapeutics Market Revenue Share (%), by Country 2025 & 2033
- Figure 62: South America Next-Generation Antibody Therapeutics Market Volume Share (%), by Country 2025 & 2033
List of Tables
- Table 1: Global Next-Generation Antibody Therapeutics Market Revenue billion Forecast, by Therapeutic Area 2020 & 2033
- Table 2: Global Next-Generation Antibody Therapeutics Market Volume K Unit Forecast, by Therapeutic Area 2020 & 2033
- Table 3: Global Next-Generation Antibody Therapeutics Market Revenue billion Forecast, by Technology 2020 & 2033
- Table 4: Global Next-Generation Antibody Therapeutics Market Volume K Unit Forecast, by Technology 2020 & 2033
- Table 5: Global Next-Generation Antibody Therapeutics Market Revenue billion Forecast, by Region 2020 & 2033
- Table 6: Global Next-Generation Antibody Therapeutics Market Volume K Unit Forecast, by Region 2020 & 2033
- Table 7: Global Next-Generation Antibody Therapeutics Market Revenue billion Forecast, by Therapeutic Area 2020 & 2033
- Table 8: Global Next-Generation Antibody Therapeutics Market Volume K Unit Forecast, by Therapeutic Area 2020 & 2033
- Table 9: Global Next-Generation Antibody Therapeutics Market Revenue billion Forecast, by Technology 2020 & 2033
- Table 10: Global Next-Generation Antibody Therapeutics Market Volume K Unit Forecast, by Technology 2020 & 2033
- Table 11: Global Next-Generation Antibody Therapeutics Market Revenue billion Forecast, by Country 2020 & 2033
- Table 12: Global Next-Generation Antibody Therapeutics Market Volume K Unit Forecast, by Country 2020 & 2033
- Table 13: United States Next-Generation Antibody Therapeutics Market Revenue (billion) Forecast, by Application 2020 & 2033
- Table 14: United States Next-Generation Antibody Therapeutics Market Volume (K Unit) Forecast, by Application 2020 & 2033
- Table 15: Canada Next-Generation Antibody Therapeutics Market Revenue (billion) Forecast, by Application 2020 & 2033
- Table 16: Canada Next-Generation Antibody Therapeutics Market Volume (K Unit) Forecast, by Application 2020 & 2033
- Table 17: Mexico Next-Generation Antibody Therapeutics Market Revenue (billion) Forecast, by Application 2020 & 2033
- Table 18: Mexico Next-Generation Antibody Therapeutics Market Volume (K Unit) Forecast, by Application 2020 & 2033
- Table 19: Global Next-Generation Antibody Therapeutics Market Revenue billion Forecast, by Therapeutic Area 2020 & 2033
- Table 20: Global Next-Generation Antibody Therapeutics Market Volume K Unit Forecast, by Therapeutic Area 2020 & 2033
- Table 21: Global Next-Generation Antibody Therapeutics Market Revenue billion Forecast, by Technology 2020 & 2033
- Table 22: Global Next-Generation Antibody Therapeutics Market Volume K Unit Forecast, by Technology 2020 & 2033
- Table 23: Global Next-Generation Antibody Therapeutics Market Revenue billion Forecast, by Country 2020 & 2033
- Table 24: Global Next-Generation Antibody Therapeutics Market Volume K Unit Forecast, by Country 2020 & 2033
- Table 25: Germany Next-Generation Antibody Therapeutics Market Revenue (billion) Forecast, by Application 2020 & 2033
- Table 26: Germany Next-Generation Antibody Therapeutics Market Volume (K Unit) Forecast, by Application 2020 & 2033
- Table 27: United Kingdom Next-Generation Antibody Therapeutics Market Revenue (billion) Forecast, by Application 2020 & 2033
- Table 28: United Kingdom Next-Generation Antibody Therapeutics Market Volume (K Unit) Forecast, by Application 2020 & 2033
- Table 29: France Next-Generation Antibody Therapeutics Market Revenue (billion) Forecast, by Application 2020 & 2033
- Table 30: France Next-Generation Antibody Therapeutics Market Volume (K Unit) Forecast, by Application 2020 & 2033
- Table 31: Italy Next-Generation Antibody Therapeutics Market Revenue (billion) Forecast, by Application 2020 & 2033
- Table 32: Italy Next-Generation Antibody Therapeutics Market Volume (K Unit) Forecast, by Application 2020 & 2033
- Table 33: Spain Next-Generation Antibody Therapeutics Market Revenue (billion) Forecast, by Application 2020 & 2033
- Table 34: Spain Next-Generation Antibody Therapeutics Market Volume (K Unit) Forecast, by Application 2020 & 2033
- Table 35: Rest of Europe Next-Generation Antibody Therapeutics Market Revenue (billion) Forecast, by Application 2020 & 2033
- Table 36: Rest of Europe Next-Generation Antibody Therapeutics Market Volume (K Unit) Forecast, by Application 2020 & 2033
- Table 37: Global Next-Generation Antibody Therapeutics Market Revenue billion Forecast, by Therapeutic Area 2020 & 2033
- Table 38: Global Next-Generation Antibody Therapeutics Market Volume K Unit Forecast, by Therapeutic Area 2020 & 2033
- Table 39: Global Next-Generation Antibody Therapeutics Market Revenue billion Forecast, by Technology 2020 & 2033
- Table 40: Global Next-Generation Antibody Therapeutics Market Volume K Unit Forecast, by Technology 2020 & 2033
- Table 41: Global Next-Generation Antibody Therapeutics Market Revenue billion Forecast, by Country 2020 & 2033
- Table 42: Global Next-Generation Antibody Therapeutics Market Volume K Unit Forecast, by Country 2020 & 2033
- Table 43: China Next-Generation Antibody Therapeutics Market Revenue (billion) Forecast, by Application 2020 & 2033
- Table 44: China Next-Generation Antibody Therapeutics Market Volume (K Unit) Forecast, by Application 2020 & 2033
- Table 45: Japan Next-Generation Antibody Therapeutics Market Revenue (billion) Forecast, by Application 2020 & 2033
- Table 46: Japan Next-Generation Antibody Therapeutics Market Volume (K Unit) Forecast, by Application 2020 & 2033
- Table 47: India Next-Generation Antibody Therapeutics Market Revenue (billion) Forecast, by Application 2020 & 2033
- Table 48: India Next-Generation Antibody Therapeutics Market Volume (K Unit) Forecast, by Application 2020 & 2033
- Table 49: Australia Next-Generation Antibody Therapeutics Market Revenue (billion) Forecast, by Application 2020 & 2033
- Table 50: Australia Next-Generation Antibody Therapeutics Market Volume (K Unit) Forecast, by Application 2020 & 2033
- Table 51: South Korea Next-Generation Antibody Therapeutics Market Revenue (billion) Forecast, by Application 2020 & 2033
- Table 52: South Korea Next-Generation Antibody Therapeutics Market Volume (K Unit) Forecast, by Application 2020 & 2033
- Table 53: Rest of Asia Pacific Next-Generation Antibody Therapeutics Market Revenue (billion) Forecast, by Application 2020 & 2033
- Table 54: Rest of Asia Pacific Next-Generation Antibody Therapeutics Market Volume (K Unit) Forecast, by Application 2020 & 2033
- Table 55: Global Next-Generation Antibody Therapeutics Market Revenue billion Forecast, by Therapeutic Area 2020 & 2033
- Table 56: Global Next-Generation Antibody Therapeutics Market Volume K Unit Forecast, by Therapeutic Area 2020 & 2033
- Table 57: Global Next-Generation Antibody Therapeutics Market Revenue billion Forecast, by Technology 2020 & 2033
- Table 58: Global Next-Generation Antibody Therapeutics Market Volume K Unit Forecast, by Technology 2020 & 2033
- Table 59: Global Next-Generation Antibody Therapeutics Market Revenue billion Forecast, by Country 2020 & 2033
- Table 60: Global Next-Generation Antibody Therapeutics Market Volume K Unit Forecast, by Country 2020 & 2033
- Table 61: GCC Next-Generation Antibody Therapeutics Market Revenue (billion) Forecast, by Application 2020 & 2033
- Table 62: GCC Next-Generation Antibody Therapeutics Market Volume (K Unit) Forecast, by Application 2020 & 2033
- Table 63: South Africa Next-Generation Antibody Therapeutics Market Revenue (billion) Forecast, by Application 2020 & 2033
- Table 64: South Africa Next-Generation Antibody Therapeutics Market Volume (K Unit) Forecast, by Application 2020 & 2033
- Table 65: Rest of Middle East and Africa Next-Generation Antibody Therapeutics Market Revenue (billion) Forecast, by Application 2020 & 2033
- Table 66: Rest of Middle East and Africa Next-Generation Antibody Therapeutics Market Volume (K Unit) Forecast, by Application 2020 & 2033
- Table 67: Global Next-Generation Antibody Therapeutics Market Revenue billion Forecast, by Therapeutic Area 2020 & 2033
- Table 68: Global Next-Generation Antibody Therapeutics Market Volume K Unit Forecast, by Therapeutic Area 2020 & 2033
- Table 69: Global Next-Generation Antibody Therapeutics Market Revenue billion Forecast, by Technology 2020 & 2033
- Table 70: Global Next-Generation Antibody Therapeutics Market Volume K Unit Forecast, by Technology 2020 & 2033
- Table 71: Global Next-Generation Antibody Therapeutics Market Revenue billion Forecast, by Country 2020 & 2033
- Table 72: Global Next-Generation Antibody Therapeutics Market Volume K Unit Forecast, by Country 2020 & 2033
- Table 73: Brazil Next-Generation Antibody Therapeutics Market Revenue (billion) Forecast, by Application 2020 & 2033
- Table 74: Brazil Next-Generation Antibody Therapeutics Market Volume (K Unit) Forecast, by Application 2020 & 2033
- Table 75: Argentina Next-Generation Antibody Therapeutics Market Revenue (billion) Forecast, by Application 2020 & 2033
- Table 76: Argentina Next-Generation Antibody Therapeutics Market Volume (K Unit) Forecast, by Application 2020 & 2033
- Table 77: Rest of South America Next-Generation Antibody Therapeutics Market Revenue (billion) Forecast, by Application 2020 & 2033
- Table 78: Rest of South America Next-Generation Antibody Therapeutics Market Volume (K Unit) Forecast, by Application 2020 & 2033
Frequently Asked Questions
1. What is the projected Compound Annual Growth Rate (CAGR) of the Next-Generation Antibody Therapeutics Market?
The projected CAGR is approximately 10.9%.
2. Which companies are prominent players in the Next-Generation Antibody Therapeutics Market?
Key companies in the market include Kyowa Hakko Kirin Co Ltd, Bayer AG, Amgen Inc, ImmunoGen Inc, Xencor Inc, F Hoffmann-La Roche Ltd, GlaxoSmithKline Plc, Biogen, AstraZeneca Plc, Seagen Inc, Bristol-Myers Squibb Company, Pfizer Inc.
3. What are the main segments of the Next-Generation Antibody Therapeutics Market?
The market segments include Therapeutic Area, Technology.
4. Can you provide details about the market size?
The market size is estimated to be USD 7.63 billion as of 2022.
5. What are some drivers contributing to market growth?
Increasing Incidence of Cancer; Rising Prevalence of Autoimmune Diseases; Technological Progressions in Antibody Therapeutics.
6. What are the notable trends driving market growth?
Antibody-Drug Conjugates Segment is Expected to Hold the Largest Market Share in the Next-Generation Antibody Therapeutics Market.
7. Are there any restraints impacting market growth?
Stringent Regulatory Framework; High costs of Next-Generation Antibody Therapeutics.
8. Can you provide examples of recent developments in the market?
December 2022: Sorrento Therapeutics, Inc. received clearance from the U.S. FDA to initiate clinical trials with its next-generation mRNA (STI-1557) vaccine against SARS-CoV-2 Omicron variants.
9. What pricing options are available for accessing the report?
Pricing options include single-user, multi-user, and enterprise licenses priced at USD 4750, USD 5250, and USD 8750 respectively.
10. Is the market size provided in terms of value or volume?
The market size is provided in terms of value, measured in billion and volume, measured in K Unit.
11. Are there any specific market keywords associated with the report?
Yes, the market keyword associated with the report is "Next-Generation Antibody Therapeutics Market," which aids in identifying and referencing the specific market segment covered.
12. How do I determine which pricing option suits my needs best?
The pricing options vary based on user requirements and access needs. Individual users may opt for single-user licenses, while businesses requiring broader access may choose multi-user or enterprise licenses for cost-effective access to the report.
13. Are there any additional resources or data provided in the Next-Generation Antibody Therapeutics Market report?
While the report offers comprehensive insights, it's advisable to review the specific contents or supplementary materials provided to ascertain if additional resources or data are available.
14. How can I stay updated on further developments or reports in the Next-Generation Antibody Therapeutics Market?
To stay informed about further developments, trends, and reports in the Next-Generation Antibody Therapeutics Market, consider subscribing to industry newsletters, following relevant companies and organizations, or regularly checking reputable industry news sources and publications.
Methodology
Step 1 - Identification of Relevant Samples Size from Population Database


Step 2 - Approaches for Defining Global Market Size (Value, Volume* & Price*)

Note*: In applicable scenarios
Step 3 - Data Sources
Primary Research
- Web Analytics
- Survey Reports
- Research Institute
- Latest Research Reports
- Opinion Leaders
Secondary Research
- Annual Reports
- White Paper
- Latest Press Release
- Industry Association
- Paid Database
- Investor Presentations

Step 4 - Data Triangulation
Involves using different sources of information in order to increase the validity of a study
These sources are likely to be stakeholders in a program - participants, other researchers, program staff, other community members, and so on.
Then we put all data in single framework & apply various statistical tools to find out the dynamic on the market.
During the analysis stage, feedback from the stakeholder groups would be compared to determine areas of agreement as well as areas of divergence