

Key Insights
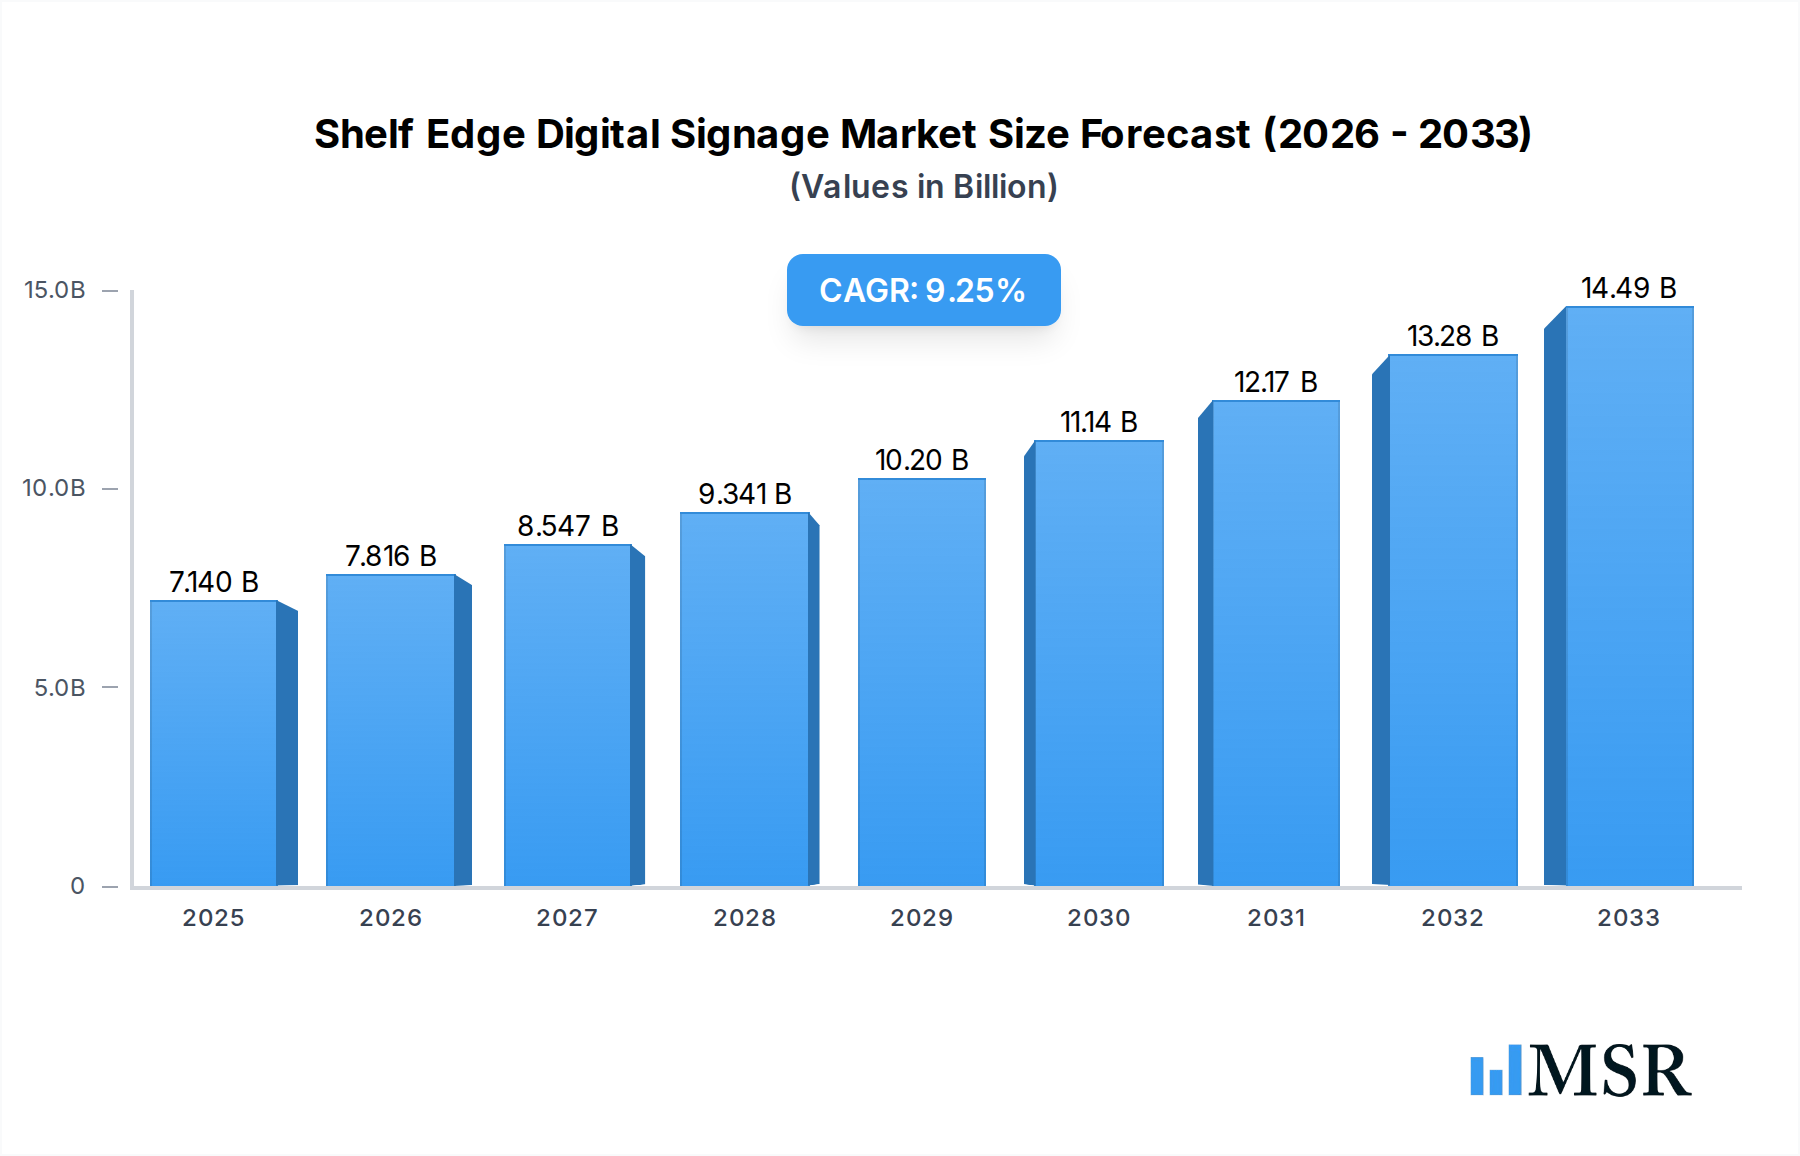
The Shelf Edge Digital Signage market is poised for significant expansion, with a projected market size of $7.14 billion in 2025. This growth is fueled by the increasing demand for dynamic and engaging in-store advertising and promotional tools across various retail environments, including department stores, grocery supermarkets, and specialty shops. The adoption of digital signage at the shelf edge offers retailers a powerful way to improve customer engagement, drive impulse purchases, and efficiently update pricing and promotional information. This technology enhances the shopping experience by providing real-time product details, personalized offers, and interactive content, thereby bridging the gap between online and offline retail. The market is experiencing robust growth with a compound annual growth rate (CAGR) of 9.35%, indicating strong investor confidence and sustained adoption by retailers looking to optimize their store layouts and customer interactions.

Shelf Edge Digital Signage Market Size (In Billion)
Further driving this market expansion are key trends such as the integration of AI and data analytics for personalized promotions, the rise of IoT-enabled shelf edge displays for inventory management and dynamic pricing, and the increasing demand for scalable and flexible digital signage solutions. The growing adoption of smaller display sizes (less than 10 inches and 10-24 inches) for optimized placement and cost-effectiveness is also a significant trend. While the market presents substantial opportunities, potential restraints include the initial investment costs for hardware and software implementation, as well as the need for ongoing content management and technical support. However, the long-term benefits of enhanced customer experience, increased sales, and operational efficiency are expected to outweigh these challenges, making shelf edge digital signage a critical component of modern retail strategies.
Shelf Edge Digital Signage Company Market Share
Unlock the Future of Retail: Shelf Edge Digital Signage Market Report 2025-2033
This comprehensive report provides an in-depth analysis of the Shelf Edge Digital Signage market, a rapidly evolving sector transforming the retail landscape. With billions of dollars in projected market size and an unprecedented CAGR, this study offers critical insights for industry stakeholders, investors, and decision-makers. We delve into market dynamics, emerging trends, key players, and future opportunities, presenting actionable intelligence to navigate and capitalize on this dynamic market.
Shelf Edge Digital Signage Market Concentration & Dynamics
The Shelf Edge Digital Signage market, projected to exceed a trillion dollars by 2033, is characterized by a moderate concentration. Leading players like Stratacache, SoluM, and NoviSign are actively shaping the innovation ecosystem. The market benefits from a supportive regulatory framework, though varying regional standards can present challenges. Substitute products, such as traditional static signage and QR codes, exist but are increasingly outpaced by the dynamic capabilities of digital solutions. End-user trends are heavily influenced by the demand for enhanced in-store experiences and data-driven marketing. Merger and acquisition (M&A) activities are on the rise, with an estimated xx significant deals expected within the forecast period, reflecting consolidation and strategic expansion. The market share distribution is dynamic, with major players holding a combined xx% of the market. Innovation in areas like AI-powered content delivery and interactive displays is a key differentiator.
Shelf Edge Digital Signage Industry Insights & Trends
The Shelf Edge Digital Signage industry is poised for explosive growth, driven by a confluence of technological advancements, evolving consumer behaviors, and the persistent need for retailers to optimize the in-store experience. The global market size is anticipated to reach a staggering xx trillion dollars by the estimated year of 2025, with a Compound Annual Growth Rate (CAGR) of xx% projected throughout the forecast period of 2025–2033. This robust expansion is fueled by the inherent advantages digital shelf edge displays offer over traditional methods. Their ability to deliver dynamic, real-time pricing, promotions, and product information empowers retailers to respond instantaneously to market shifts and competitor actions.
Technological disruptions are at the forefront of this growth. The integration of Artificial Intelligence (AI) and Machine Learning (ML) is enabling personalized content delivery based on shopper demographics and purchase history, thereby enhancing engagement and driving sales. Internet of Things (IoT) connectivity further allows for seamless integration with inventory management systems, ensuring accuracy and reducing stockouts. The advent of ultra-thin, high-resolution displays and energy-efficient technologies has made these solutions more cost-effective and aesthetically pleasing, facilitating wider adoption across various retail formats.
Consumer behavior is also playing a pivotal role. Modern shoppers expect engaging and informative shopping experiences. Shelf edge digital signage meets this demand by providing rich media content, interactive product comparisons, and even augmented reality (AR) overlays, transforming a mundane shopping trip into an interactive journey. The ability to access product reviews, nutritional information, and complementary product suggestions directly at the shelf edge empowers consumers to make more informed purchasing decisions, fostering brand loyalty and increasing basket size. Furthermore, the growing emphasis on sustainability and reducing paper waste is steering retailers away from traditional printed labels towards more environmentally friendly digital alternatives. This shift, coupled with the significant ROI observed in pilot programs, is a strong catalyst for widespread market penetration.
Key Markets & Segments Leading Shelf Edge Digital Signage
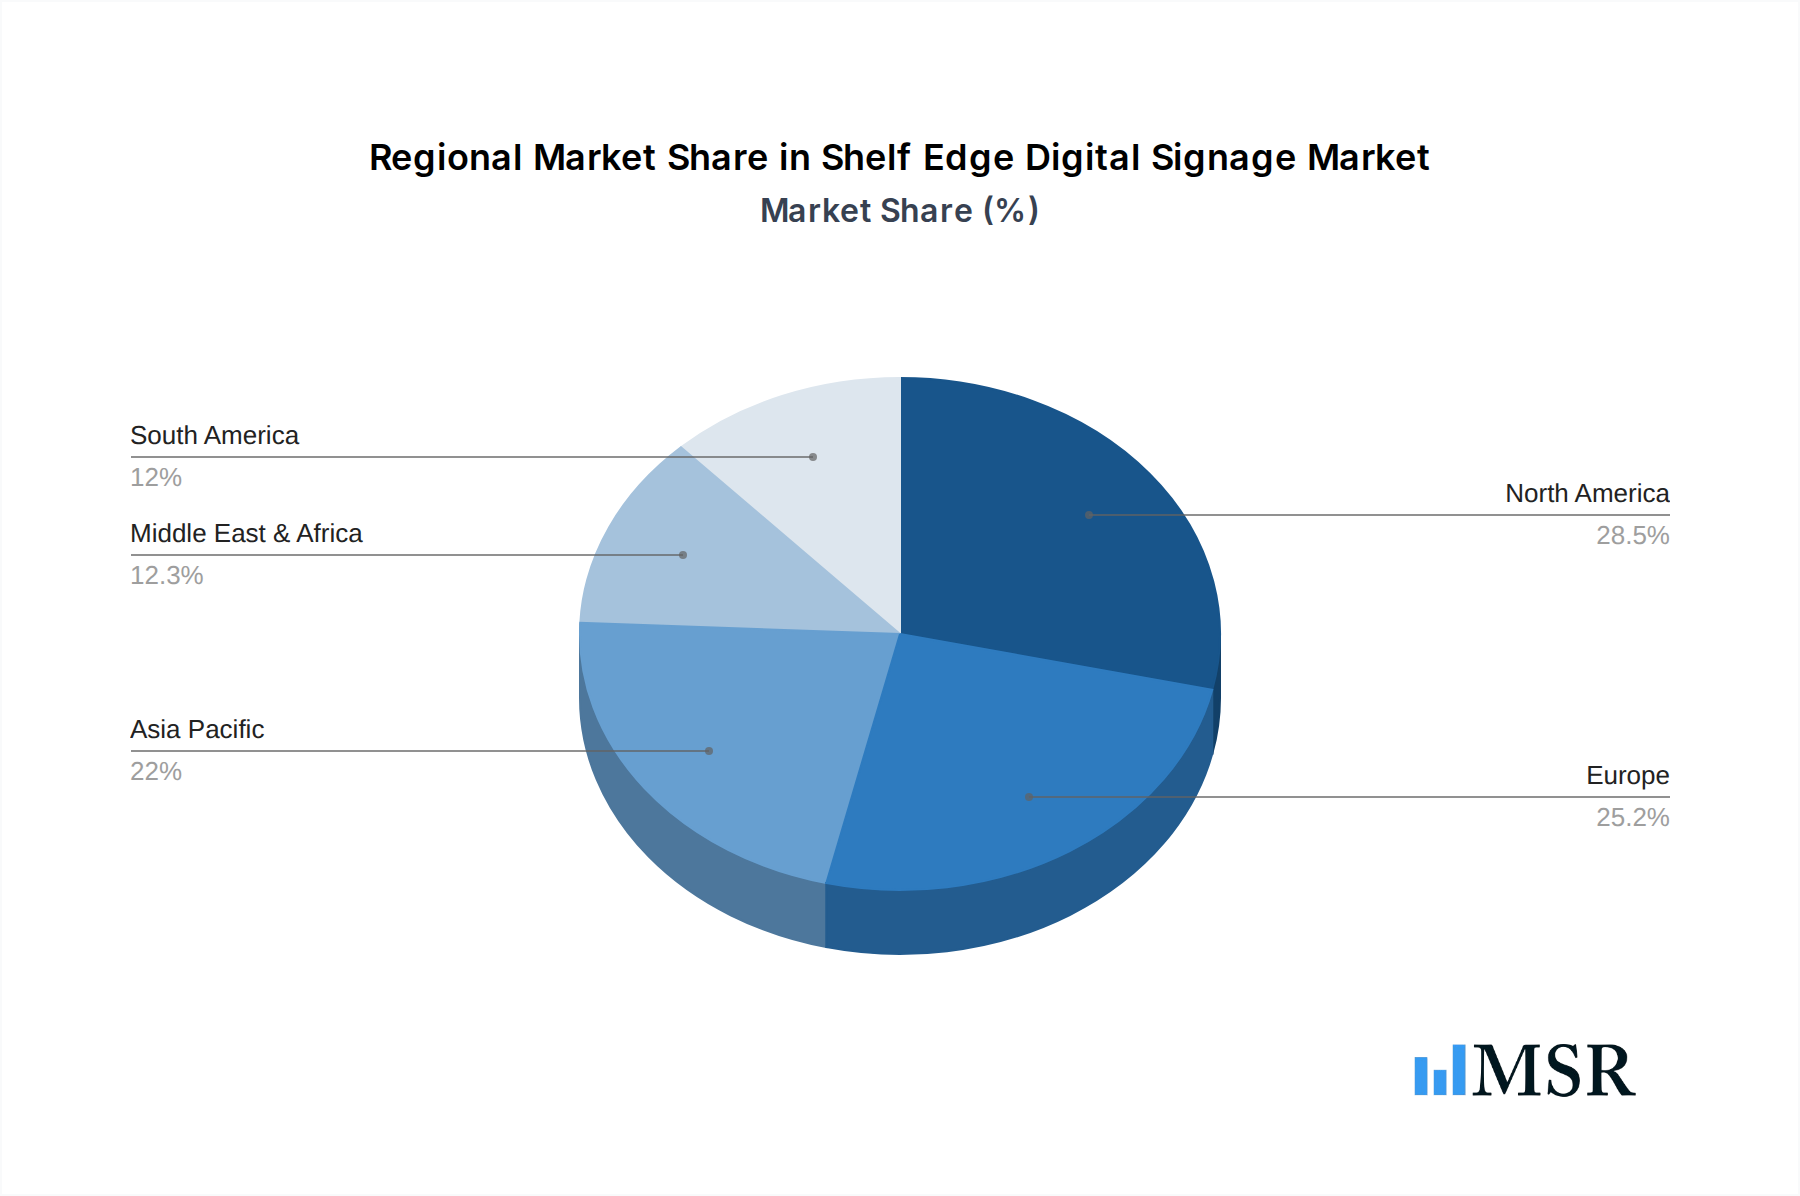
The Shelf Edge Digital Signage market is experiencing remarkable growth across various regions and segments, with North America currently leading the charge. This dominance is attributed to a combination of factors including robust economic growth, high disposable incomes, and a mature retail infrastructure that readily adopts technological innovations. The United States, in particular, stands out as a key market, driven by its vast retail footprint and a strong consumer appetite for advanced shopping experiences. The presence of major retail chains and a competitive market landscape that demands continuous differentiation further solidifies North America's leading position.
Application Segments Driving Growth:
- Grocery or Supermarket: This segment represents the largest share of the market, accounting for an estimated xx% of total revenue. The constant need for accurate price updates, dynamic promotional displays, and enhanced product visibility for fresh produce and perishable goods makes shelf edge digital signage indispensable. Retailers here benefit from reduced labor costs associated with manual price changes and improved inventory management.
- Department Stores: Experiencing substantial growth at a CAGR of xx%, department stores are leveraging digital shelf edge displays for brand storytelling, showcasing new arrivals, and highlighting seasonal offers. The ability to create immersive brand experiences at the point of purchase is crucial for these retailers to compete effectively with online channels.
- Specialty Stores: While a smaller segment in terms of absolute market share, specialty stores are exhibiting the highest growth potential, with an estimated CAGR of xx%. These retailers often focus on niche products and premium brands, where detailed product information, customer reviews, and interactive features can significantly enhance the perceived value and drive sales.
- Others: This category, encompassing electronics stores, pharmacies, and convenience stores, is also contributing to market expansion at a significant pace. These retailers are adopting digital shelf edge solutions to improve operational efficiency and provide a more engaging customer journey.
Type Segments and Their Dominance:
- 10-24 Inches: This display size category currently holds the largest market share, estimated at xx% of the market value. These displays offer an optimal balance between visibility and cost-effectiveness, making them ideal for a wide range of product shelves. Their versatility allows for the display of rich content without overwhelming the shopper.
- More than 24 Inches: This segment is witnessing rapid growth, driven by the demand for larger, more impactful displays in high-traffic areas and for premium product placements. Their use in supermarkets for aisle-end displays and in department stores for visual merchandising is expanding significantly, contributing to an estimated xx% market share.
- Less than 10 Inches: While the smallest segment, these ultra-compact displays are finding niche applications in high-density shelving, pharmacies, and for specific product categories where space is at a premium. Their market share is projected to grow at a steady xx% CAGR.
The widespread adoption in North America, coupled with strong growth in Europe and Asia Pacific, points towards a global market expansion. Factors like increasing digitalization of retail operations, government initiatives promoting technological adoption, and a growing competitive pressure among retailers are propelling the adoption of shelf edge digital signage across all key markets and segments.
Shelf Edge Digital Signage Product Developments
Recent product innovations in Shelf Edge Digital Signage are focusing on enhancing interactivity, data integration, and energy efficiency. Companies are developing ultra-thin, high-resolution displays with advanced LED and E-Ink technologies, offering vibrant visuals and reduced power consumption. The integration of sensors for real-time customer interaction tracking and AI-powered analytics for personalized content delivery are becoming standard. Solutions from Spectracolor and ViviSign are pushing boundaries in vibrant color reproduction and dynamic content updates, while In2Digital is focusing on scalable and robust network management systems. These advancements are not only improving the in-store customer experience but also providing retailers with invaluable data for optimizing their strategies.
Challenges in the Shelf Edge Digital Signage Market
Despite robust growth, the Shelf Edge Digital Signage market faces several challenges. High initial investment costs for hardware and software integration remain a significant barrier for smaller retailers, with an estimated xx% of businesses citing budget constraints. The complexity of network management and content deployment across large store networks requires specialized IT infrastructure and expertise. Furthermore, ensuring consistent connectivity and addressing cybersecurity threats are ongoing concerns, impacting the reliability and security of these systems. Competition from established players and the emergence of new technologies also create pricing pressures, potentially affecting profit margins.
Forces Driving Shelf Edge Digital Signage Growth
Several key forces are driving the remarkable growth of the Shelf Edge Digital Signage market. The imperative for retailers to enhance the in-store customer experience and create engaging shopping environments is paramount. Technological advancements, including the decreasing cost of digital displays and the increasing sophistication of content management systems, are making these solutions more accessible and effective. The proven return on investment (ROI) through increased sales, reduced operational costs, and improved inventory accuracy further incentivizes adoption. Additionally, the growing demand for real-time, dynamic pricing and promotional capabilities in response to market competition and consumer expectations is a significant growth catalyst.
Challenges in the Shelf Edge Digital Signage Market
Long-term growth catalysts for the Shelf Edge Digital Signage market are deeply rooted in continuous innovation and strategic market expansion. The ongoing development of more sophisticated AI algorithms for personalized customer engagement and predictive analytics will unlock new levels of in-store marketing effectiveness. Partnerships between technology providers and retailers, focusing on end-to-end solutions that address all aspects of digital signage deployment and management, will streamline adoption. Furthermore, the expansion into emerging markets with nascent retail digitalization trends presents significant untapped potential. As these markets mature, the demand for advanced retail technologies like shelf edge digital signage will accelerate, providing sustained long-term growth opportunities.
Emerging Opportunities in Shelf Edge Digital Signage
Emerging opportunities in the Shelf Edge Digital Signage market are diverse and promising. The integration of augmented reality (AR) and virtual reality (VR) capabilities at the shelf edge offers immersive product exploration and virtual try-on experiences, revolutionizing how consumers interact with products. The expansion of these digital displays into non-traditional retail environments, such as hospitality and public spaces, opens new revenue streams. Furthermore, the growing trend of smart stores and the Internet of Things (IoT) ecosystem presents opportunities for seamless integration with other in-store technologies, creating a more connected and responsive retail environment.
Leading Players in the Shelf Edge Digital Signage Sector
- Stratacache
- SoluM
- NoviSign
- Spectracolor
- ViviSign
- In2Digital
- Kuusoft Corp
- Real Digital Media
- Allsee Technologies
- SignStix
- Crystal Display Systems
- Visimi Digital
- James Hogg Display
- Saturn Visual Solutions
- Netvisual Corporation
- SCS Technologies
Key Milestones in Shelf Edge Digital Signage Industry
- 2019: Increased adoption of LED shelf edge displays for dynamic pricing and promotions in major grocery chains.
- 2020: Emergence of cloud-based content management systems simplifying remote deployment and updates.
- 2021: Introduction of AI-powered analytics for personalized content recommendations at the shelf edge.
- 2022: Significant advancements in E-Ink display technology for ultra-low power consumption.
- 2023: Growing trend of interactive shelf edge displays with touch capabilities.
- 2024: Increased focus on sustainability and paperless solutions driving adoption.
- 2025: Projected widespread integration with IoT devices for real-time inventory and sales data synchronization.
Strategic Outlook for Shelf Edge Digital Signage Market
The strategic outlook for the Shelf Edge Digital Signage market is exceptionally positive, driven by the continuous evolution of retail technology and consumer expectations. Growth accelerators will include the deep integration of AI and ML for hyper-personalization, creating a truly dynamic and responsive shopping experience. Partnerships between technology providers and retail giants will foster the development of integrated, end-to-end solutions, simplifying deployment and management. Furthermore, the expanding global footprint into emerging markets, coupled with ongoing innovation in display technology and content delivery platforms, will ensure sustained market expansion and profitability for forward-thinking stakeholders.
Shelf Edge Digital Signage Segmentation
-
1. Application
- 1.1. Department Stores
- 1.2. Grocery or Supermarket
- 1.3. Specialty Stores
- 1.4. Others
-
2. Types
- 2.1. Less than 10 Inches
- 2.2. 10-24 Inches
- 2.3. More than 24 Inches
Shelf Edge Digital Signage Segmentation By Geography
-
1. North America
- 1.1. United States
- 1.2. Canada
- 1.3. Mexico
-
2. South America
- 2.1. Brazil
- 2.2. Argentina
- 2.3. Rest of South America
-
3. Europe
- 3.1. United Kingdom
- 3.2. Germany
- 3.3. France
- 3.4. Italy
- 3.5. Spain
- 3.6. Russia
- 3.7. Benelux
- 3.8. Nordics
- 3.9. Rest of Europe
-
4. Middle East & Africa
- 4.1. Turkey
- 4.2. Israel
- 4.3. GCC
- 4.4. North Africa
- 4.5. South Africa
- 4.6. Rest of Middle East & Africa
-
5. Asia Pacific
- 5.1. China
- 5.2. India
- 5.3. Japan
- 5.4. South Korea
- 5.5. ASEAN
- 5.6. Oceania
- 5.7. Rest of Asia Pacific
Shelf Edge Digital Signage Regional Market Share
Geographic Coverage of Shelf Edge Digital Signage
Shelf Edge Digital Signage REPORT HIGHLIGHTS
| Aspects | Details |
|---|---|
| Study Period | 2020-2034 |
| Base Year | 2025 |
| Estimated Year | 2026 |
| Forecast Period | 2026-2034 |
| Historical Period | 2020-2025 |
| Growth Rate | CAGR of 9.35% from 2020-2034 |
| Segmentation |
|
Table of Contents
- 1. Introduction
- 1.1. Research Scope
- 1.2. Market Segmentation
- 1.3. Research Methodology
- 1.4. Definitions and Assumptions
- 2. Executive Summary
- 2.1. Introduction
- 3. Market Dynamics
- 3.1. Introduction
- 3.2. Market Drivers
- 3.3. Market Restrains
- 3.4. Market Trends
- 4. Market Factor Analysis
- 4.1. Porters Five Forces
- 4.2. Supply/Value Chain
- 4.3. PESTEL analysis
- 4.4. Market Entropy
- 4.5. Patent/Trademark Analysis
- 5. Global Shelf Edge Digital Signage Analysis, Insights and Forecast, 2020-2032
- 5.1. Market Analysis, Insights and Forecast - by Application
- 5.1.1. Department Stores
- 5.1.2. Grocery or Supermarket
- 5.1.3. Specialty Stores
- 5.1.4. Others
- 5.2. Market Analysis, Insights and Forecast - by Types
- 5.2.1. Less than 10 Inches
- 5.2.2. 10-24 Inches
- 5.2.3. More than 24 Inches
- 5.3. Market Analysis, Insights and Forecast - by Region
- 5.3.1. North America
- 5.3.2. South America
- 5.3.3. Europe
- 5.3.4. Middle East & Africa
- 5.3.5. Asia Pacific
- 5.1. Market Analysis, Insights and Forecast - by Application
- 6. North America Shelf Edge Digital Signage Analysis, Insights and Forecast, 2020-2032
- 6.1. Market Analysis, Insights and Forecast - by Application
- 6.1.1. Department Stores
- 6.1.2. Grocery or Supermarket
- 6.1.3. Specialty Stores
- 6.1.4. Others
- 6.2. Market Analysis, Insights and Forecast - by Types
- 6.2.1. Less than 10 Inches
- 6.2.2. 10-24 Inches
- 6.2.3. More than 24 Inches
- 6.1. Market Analysis, Insights and Forecast - by Application
- 7. South America Shelf Edge Digital Signage Analysis, Insights and Forecast, 2020-2032
- 7.1. Market Analysis, Insights and Forecast - by Application
- 7.1.1. Department Stores
- 7.1.2. Grocery or Supermarket
- 7.1.3. Specialty Stores
- 7.1.4. Others
- 7.2. Market Analysis, Insights and Forecast - by Types
- 7.2.1. Less than 10 Inches
- 7.2.2. 10-24 Inches
- 7.2.3. More than 24 Inches
- 7.1. Market Analysis, Insights and Forecast - by Application
- 8. Europe Shelf Edge Digital Signage Analysis, Insights and Forecast, 2020-2032
- 8.1. Market Analysis, Insights and Forecast - by Application
- 8.1.1. Department Stores
- 8.1.2. Grocery or Supermarket
- 8.1.3. Specialty Stores
- 8.1.4. Others
- 8.2. Market Analysis, Insights and Forecast - by Types
- 8.2.1. Less than 10 Inches
- 8.2.2. 10-24 Inches
- 8.2.3. More than 24 Inches
- 8.1. Market Analysis, Insights and Forecast - by Application
- 9. Middle East & Africa Shelf Edge Digital Signage Analysis, Insights and Forecast, 2020-2032
- 9.1. Market Analysis, Insights and Forecast - by Application
- 9.1.1. Department Stores
- 9.1.2. Grocery or Supermarket
- 9.1.3. Specialty Stores
- 9.1.4. Others
- 9.2. Market Analysis, Insights and Forecast - by Types
- 9.2.1. Less than 10 Inches
- 9.2.2. 10-24 Inches
- 9.2.3. More than 24 Inches
- 9.1. Market Analysis, Insights and Forecast - by Application
- 10. Asia Pacific Shelf Edge Digital Signage Analysis, Insights and Forecast, 2020-2032
- 10.1. Market Analysis, Insights and Forecast - by Application
- 10.1.1. Department Stores
- 10.1.2. Grocery or Supermarket
- 10.1.3. Specialty Stores
- 10.1.4. Others
- 10.2. Market Analysis, Insights and Forecast - by Types
- 10.2.1. Less than 10 Inches
- 10.2.2. 10-24 Inches
- 10.2.3. More than 24 Inches
- 10.1. Market Analysis, Insights and Forecast - by Application
- 11. Competitive Analysis
- 11.1. Global Market Share Analysis 2025
- 11.2. Company Profiles
- 11.2.1 Stratacache
- 11.2.1.1. Overview
- 11.2.1.2. Products
- 11.2.1.3. SWOT Analysis
- 11.2.1.4. Recent Developments
- 11.2.1.5. Financials (Based on Availability)
- 11.2.2 SoluM
- 11.2.2.1. Overview
- 11.2.2.2. Products
- 11.2.2.3. SWOT Analysis
- 11.2.2.4. Recent Developments
- 11.2.2.5. Financials (Based on Availability)
- 11.2.3 NoviSign
- 11.2.3.1. Overview
- 11.2.3.2. Products
- 11.2.3.3. SWOT Analysis
- 11.2.3.4. Recent Developments
- 11.2.3.5. Financials (Based on Availability)
- 11.2.4 Spectracolor
- 11.2.4.1. Overview
- 11.2.4.2. Products
- 11.2.4.3. SWOT Analysis
- 11.2.4.4. Recent Developments
- 11.2.4.5. Financials (Based on Availability)
- 11.2.5 ViviSign
- 11.2.5.1. Overview
- 11.2.5.2. Products
- 11.2.5.3. SWOT Analysis
- 11.2.5.4. Recent Developments
- 11.2.5.5. Financials (Based on Availability)
- 11.2.6 In2Digital
- 11.2.6.1. Overview
- 11.2.6.2. Products
- 11.2.6.3. SWOT Analysis
- 11.2.6.4. Recent Developments
- 11.2.6.5. Financials (Based on Availability)
- 11.2.7 Kuusoft Corp
- 11.2.7.1. Overview
- 11.2.7.2. Products
- 11.2.7.3. SWOT Analysis
- 11.2.7.4. Recent Developments
- 11.2.7.5. Financials (Based on Availability)
- 11.2.8 Real Digital Media
- 11.2.8.1. Overview
- 11.2.8.2. Products
- 11.2.8.3. SWOT Analysis
- 11.2.8.4. Recent Developments
- 11.2.8.5. Financials (Based on Availability)
- 11.2.9 Allsee Technologies
- 11.2.9.1. Overview
- 11.2.9.2. Products
- 11.2.9.3. SWOT Analysis
- 11.2.9.4. Recent Developments
- 11.2.9.5. Financials (Based on Availability)
- 11.2.10 SignStix
- 11.2.10.1. Overview
- 11.2.10.2. Products
- 11.2.10.3. SWOT Analysis
- 11.2.10.4. Recent Developments
- 11.2.10.5. Financials (Based on Availability)
- 11.2.11 Crystal Display Systems
- 11.2.11.1. Overview
- 11.2.11.2. Products
- 11.2.11.3. SWOT Analysis
- 11.2.11.4. Recent Developments
- 11.2.11.5. Financials (Based on Availability)
- 11.2.12 Visimi Digital
- 11.2.12.1. Overview
- 11.2.12.2. Products
- 11.2.12.3. SWOT Analysis
- 11.2.12.4. Recent Developments
- 11.2.12.5. Financials (Based on Availability)
- 11.2.13 James Hogg Display
- 11.2.13.1. Overview
- 11.2.13.2. Products
- 11.2.13.3. SWOT Analysis
- 11.2.13.4. Recent Developments
- 11.2.13.5. Financials (Based on Availability)
- 11.2.14 Saturn Visual Solutions
- 11.2.14.1. Overview
- 11.2.14.2. Products
- 11.2.14.3. SWOT Analysis
- 11.2.14.4. Recent Developments
- 11.2.14.5. Financials (Based on Availability)
- 11.2.15 Netvisual Corporation
- 11.2.15.1. Overview
- 11.2.15.2. Products
- 11.2.15.3. SWOT Analysis
- 11.2.15.4. Recent Developments
- 11.2.15.5. Financials (Based on Availability)
- 11.2.16 SCS Technologies
- 11.2.16.1. Overview
- 11.2.16.2. Products
- 11.2.16.3. SWOT Analysis
- 11.2.16.4. Recent Developments
- 11.2.16.5. Financials (Based on Availability)
- 11.2.1 Stratacache
List of Figures
- Figure 1: Global Shelf Edge Digital Signage Revenue Breakdown (billion, %) by Region 2025 & 2033
- Figure 2: Global Shelf Edge Digital Signage Volume Breakdown (K, %) by Region 2025 & 2033
- Figure 3: North America Shelf Edge Digital Signage Revenue (billion), by Application 2025 & 2033
- Figure 4: North America Shelf Edge Digital Signage Volume (K), by Application 2025 & 2033
- Figure 5: North America Shelf Edge Digital Signage Revenue Share (%), by Application 2025 & 2033
- Figure 6: North America Shelf Edge Digital Signage Volume Share (%), by Application 2025 & 2033
- Figure 7: North America Shelf Edge Digital Signage Revenue (billion), by Types 2025 & 2033
- Figure 8: North America Shelf Edge Digital Signage Volume (K), by Types 2025 & 2033
- Figure 9: North America Shelf Edge Digital Signage Revenue Share (%), by Types 2025 & 2033
- Figure 10: North America Shelf Edge Digital Signage Volume Share (%), by Types 2025 & 2033
- Figure 11: North America Shelf Edge Digital Signage Revenue (billion), by Country 2025 & 2033
- Figure 12: North America Shelf Edge Digital Signage Volume (K), by Country 2025 & 2033
- Figure 13: North America Shelf Edge Digital Signage Revenue Share (%), by Country 2025 & 2033
- Figure 14: North America Shelf Edge Digital Signage Volume Share (%), by Country 2025 & 2033
- Figure 15: South America Shelf Edge Digital Signage Revenue (billion), by Application 2025 & 2033
- Figure 16: South America Shelf Edge Digital Signage Volume (K), by Application 2025 & 2033
- Figure 17: South America Shelf Edge Digital Signage Revenue Share (%), by Application 2025 & 2033
- Figure 18: South America Shelf Edge Digital Signage Volume Share (%), by Application 2025 & 2033
- Figure 19: South America Shelf Edge Digital Signage Revenue (billion), by Types 2025 & 2033
- Figure 20: South America Shelf Edge Digital Signage Volume (K), by Types 2025 & 2033
- Figure 21: South America Shelf Edge Digital Signage Revenue Share (%), by Types 2025 & 2033
- Figure 22: South America Shelf Edge Digital Signage Volume Share (%), by Types 2025 & 2033
- Figure 23: South America Shelf Edge Digital Signage Revenue (billion), by Country 2025 & 2033
- Figure 24: South America Shelf Edge Digital Signage Volume (K), by Country 2025 & 2033
- Figure 25: South America Shelf Edge Digital Signage Revenue Share (%), by Country 2025 & 2033
- Figure 26: South America Shelf Edge Digital Signage Volume Share (%), by Country 2025 & 2033
- Figure 27: Europe Shelf Edge Digital Signage Revenue (billion), by Application 2025 & 2033
- Figure 28: Europe Shelf Edge Digital Signage Volume (K), by Application 2025 & 2033
- Figure 29: Europe Shelf Edge Digital Signage Revenue Share (%), by Application 2025 & 2033
- Figure 30: Europe Shelf Edge Digital Signage Volume Share (%), by Application 2025 & 2033
- Figure 31: Europe Shelf Edge Digital Signage Revenue (billion), by Types 2025 & 2033
- Figure 32: Europe Shelf Edge Digital Signage Volume (K), by Types 2025 & 2033
- Figure 33: Europe Shelf Edge Digital Signage Revenue Share (%), by Types 2025 & 2033
- Figure 34: Europe Shelf Edge Digital Signage Volume Share (%), by Types 2025 & 2033
- Figure 35: Europe Shelf Edge Digital Signage Revenue (billion), by Country 2025 & 2033
- Figure 36: Europe Shelf Edge Digital Signage Volume (K), by Country 2025 & 2033
- Figure 37: Europe Shelf Edge Digital Signage Revenue Share (%), by Country 2025 & 2033
- Figure 38: Europe Shelf Edge Digital Signage Volume Share (%), by Country 2025 & 2033
- Figure 39: Middle East & Africa Shelf Edge Digital Signage Revenue (billion), by Application 2025 & 2033
- Figure 40: Middle East & Africa Shelf Edge Digital Signage Volume (K), by Application 2025 & 2033
- Figure 41: Middle East & Africa Shelf Edge Digital Signage Revenue Share (%), by Application 2025 & 2033
- Figure 42: Middle East & Africa Shelf Edge Digital Signage Volume Share (%), by Application 2025 & 2033
- Figure 43: Middle East & Africa Shelf Edge Digital Signage Revenue (billion), by Types 2025 & 2033
- Figure 44: Middle East & Africa Shelf Edge Digital Signage Volume (K), by Types 2025 & 2033
- Figure 45: Middle East & Africa Shelf Edge Digital Signage Revenue Share (%), by Types 2025 & 2033
- Figure 46: Middle East & Africa Shelf Edge Digital Signage Volume Share (%), by Types 2025 & 2033
- Figure 47: Middle East & Africa Shelf Edge Digital Signage Revenue (billion), by Country 2025 & 2033
- Figure 48: Middle East & Africa Shelf Edge Digital Signage Volume (K), by Country 2025 & 2033
- Figure 49: Middle East & Africa Shelf Edge Digital Signage Revenue Share (%), by Country 2025 & 2033
- Figure 50: Middle East & Africa Shelf Edge Digital Signage Volume Share (%), by Country 2025 & 2033
- Figure 51: Asia Pacific Shelf Edge Digital Signage Revenue (billion), by Application 2025 & 2033
- Figure 52: Asia Pacific Shelf Edge Digital Signage Volume (K), by Application 2025 & 2033
- Figure 53: Asia Pacific Shelf Edge Digital Signage Revenue Share (%), by Application 2025 & 2033
- Figure 54: Asia Pacific Shelf Edge Digital Signage Volume Share (%), by Application 2025 & 2033
- Figure 55: Asia Pacific Shelf Edge Digital Signage Revenue (billion), by Types 2025 & 2033
- Figure 56: Asia Pacific Shelf Edge Digital Signage Volume (K), by Types 2025 & 2033
- Figure 57: Asia Pacific Shelf Edge Digital Signage Revenue Share (%), by Types 2025 & 2033
- Figure 58: Asia Pacific Shelf Edge Digital Signage Volume Share (%), by Types 2025 & 2033
- Figure 59: Asia Pacific Shelf Edge Digital Signage Revenue (billion), by Country 2025 & 2033
- Figure 60: Asia Pacific Shelf Edge Digital Signage Volume (K), by Country 2025 & 2033
- Figure 61: Asia Pacific Shelf Edge Digital Signage Revenue Share (%), by Country 2025 & 2033
- Figure 62: Asia Pacific Shelf Edge Digital Signage Volume Share (%), by Country 2025 & 2033
List of Tables
- Table 1: Global Shelf Edge Digital Signage Revenue billion Forecast, by Application 2020 & 2033
- Table 2: Global Shelf Edge Digital Signage Volume K Forecast, by Application 2020 & 2033
- Table 3: Global Shelf Edge Digital Signage Revenue billion Forecast, by Types 2020 & 2033
- Table 4: Global Shelf Edge Digital Signage Volume K Forecast, by Types 2020 & 2033
- Table 5: Global Shelf Edge Digital Signage Revenue billion Forecast, by Region 2020 & 2033
- Table 6: Global Shelf Edge Digital Signage Volume K Forecast, by Region 2020 & 2033
- Table 7: Global Shelf Edge Digital Signage Revenue billion Forecast, by Application 2020 & 2033
- Table 8: Global Shelf Edge Digital Signage Volume K Forecast, by Application 2020 & 2033
- Table 9: Global Shelf Edge Digital Signage Revenue billion Forecast, by Types 2020 & 2033
- Table 10: Global Shelf Edge Digital Signage Volume K Forecast, by Types 2020 & 2033
- Table 11: Global Shelf Edge Digital Signage Revenue billion Forecast, by Country 2020 & 2033
- Table 12: Global Shelf Edge Digital Signage Volume K Forecast, by Country 2020 & 2033
- Table 13: United States Shelf Edge Digital Signage Revenue (billion) Forecast, by Application 2020 & 2033
- Table 14: United States Shelf Edge Digital Signage Volume (K) Forecast, by Application 2020 & 2033
- Table 15: Canada Shelf Edge Digital Signage Revenue (billion) Forecast, by Application 2020 & 2033
- Table 16: Canada Shelf Edge Digital Signage Volume (K) Forecast, by Application 2020 & 2033
- Table 17: Mexico Shelf Edge Digital Signage Revenue (billion) Forecast, by Application 2020 & 2033
- Table 18: Mexico Shelf Edge Digital Signage Volume (K) Forecast, by Application 2020 & 2033
- Table 19: Global Shelf Edge Digital Signage Revenue billion Forecast, by Application 2020 & 2033
- Table 20: Global Shelf Edge Digital Signage Volume K Forecast, by Application 2020 & 2033
- Table 21: Global Shelf Edge Digital Signage Revenue billion Forecast, by Types 2020 & 2033
- Table 22: Global Shelf Edge Digital Signage Volume K Forecast, by Types 2020 & 2033
- Table 23: Global Shelf Edge Digital Signage Revenue billion Forecast, by Country 2020 & 2033
- Table 24: Global Shelf Edge Digital Signage Volume K Forecast, by Country 2020 & 2033
- Table 25: Brazil Shelf Edge Digital Signage Revenue (billion) Forecast, by Application 2020 & 2033
- Table 26: Brazil Shelf Edge Digital Signage Volume (K) Forecast, by Application 2020 & 2033
- Table 27: Argentina Shelf Edge Digital Signage Revenue (billion) Forecast, by Application 2020 & 2033
- Table 28: Argentina Shelf Edge Digital Signage Volume (K) Forecast, by Application 2020 & 2033
- Table 29: Rest of South America Shelf Edge Digital Signage Revenue (billion) Forecast, by Application 2020 & 2033
- Table 30: Rest of South America Shelf Edge Digital Signage Volume (K) Forecast, by Application 2020 & 2033
- Table 31: Global Shelf Edge Digital Signage Revenue billion Forecast, by Application 2020 & 2033
- Table 32: Global Shelf Edge Digital Signage Volume K Forecast, by Application 2020 & 2033
- Table 33: Global Shelf Edge Digital Signage Revenue billion Forecast, by Types 2020 & 2033
- Table 34: Global Shelf Edge Digital Signage Volume K Forecast, by Types 2020 & 2033
- Table 35: Global Shelf Edge Digital Signage Revenue billion Forecast, by Country 2020 & 2033
- Table 36: Global Shelf Edge Digital Signage Volume K Forecast, by Country 2020 & 2033
- Table 37: United Kingdom Shelf Edge Digital Signage Revenue (billion) Forecast, by Application 2020 & 2033
- Table 38: United Kingdom Shelf Edge Digital Signage Volume (K) Forecast, by Application 2020 & 2033
- Table 39: Germany Shelf Edge Digital Signage Revenue (billion) Forecast, by Application 2020 & 2033
- Table 40: Germany Shelf Edge Digital Signage Volume (K) Forecast, by Application 2020 & 2033
- Table 41: France Shelf Edge Digital Signage Revenue (billion) Forecast, by Application 2020 & 2033
- Table 42: France Shelf Edge Digital Signage Volume (K) Forecast, by Application 2020 & 2033
- Table 43: Italy Shelf Edge Digital Signage Revenue (billion) Forecast, by Application 2020 & 2033
- Table 44: Italy Shelf Edge Digital Signage Volume (K) Forecast, by Application 2020 & 2033
- Table 45: Spain Shelf Edge Digital Signage Revenue (billion) Forecast, by Application 2020 & 2033
- Table 46: Spain Shelf Edge Digital Signage Volume (K) Forecast, by Application 2020 & 2033
- Table 47: Russia Shelf Edge Digital Signage Revenue (billion) Forecast, by Application 2020 & 2033
- Table 48: Russia Shelf Edge Digital Signage Volume (K) Forecast, by Application 2020 & 2033
- Table 49: Benelux Shelf Edge Digital Signage Revenue (billion) Forecast, by Application 2020 & 2033
- Table 50: Benelux Shelf Edge Digital Signage Volume (K) Forecast, by Application 2020 & 2033
- Table 51: Nordics Shelf Edge Digital Signage Revenue (billion) Forecast, by Application 2020 & 2033
- Table 52: Nordics Shelf Edge Digital Signage Volume (K) Forecast, by Application 2020 & 2033
- Table 53: Rest of Europe Shelf Edge Digital Signage Revenue (billion) Forecast, by Application 2020 & 2033
- Table 54: Rest of Europe Shelf Edge Digital Signage Volume (K) Forecast, by Application 2020 & 2033
- Table 55: Global Shelf Edge Digital Signage Revenue billion Forecast, by Application 2020 & 2033
- Table 56: Global Shelf Edge Digital Signage Volume K Forecast, by Application 2020 & 2033
- Table 57: Global Shelf Edge Digital Signage Revenue billion Forecast, by Types 2020 & 2033
- Table 58: Global Shelf Edge Digital Signage Volume K Forecast, by Types 2020 & 2033
- Table 59: Global Shelf Edge Digital Signage Revenue billion Forecast, by Country 2020 & 2033
- Table 60: Global Shelf Edge Digital Signage Volume K Forecast, by Country 2020 & 2033
- Table 61: Turkey Shelf Edge Digital Signage Revenue (billion) Forecast, by Application 2020 & 2033
- Table 62: Turkey Shelf Edge Digital Signage Volume (K) Forecast, by Application 2020 & 2033
- Table 63: Israel Shelf Edge Digital Signage Revenue (billion) Forecast, by Application 2020 & 2033
- Table 64: Israel Shelf Edge Digital Signage Volume (K) Forecast, by Application 2020 & 2033
- Table 65: GCC Shelf Edge Digital Signage Revenue (billion) Forecast, by Application 2020 & 2033
- Table 66: GCC Shelf Edge Digital Signage Volume (K) Forecast, by Application 2020 & 2033
- Table 67: North Africa Shelf Edge Digital Signage Revenue (billion) Forecast, by Application 2020 & 2033
- Table 68: North Africa Shelf Edge Digital Signage Volume (K) Forecast, by Application 2020 & 2033
- Table 69: South Africa Shelf Edge Digital Signage Revenue (billion) Forecast, by Application 2020 & 2033
- Table 70: South Africa Shelf Edge Digital Signage Volume (K) Forecast, by Application 2020 & 2033
- Table 71: Rest of Middle East & Africa Shelf Edge Digital Signage Revenue (billion) Forecast, by Application 2020 & 2033
- Table 72: Rest of Middle East & Africa Shelf Edge Digital Signage Volume (K) Forecast, by Application 2020 & 2033
- Table 73: Global Shelf Edge Digital Signage Revenue billion Forecast, by Application 2020 & 2033
- Table 74: Global Shelf Edge Digital Signage Volume K Forecast, by Application 2020 & 2033
- Table 75: Global Shelf Edge Digital Signage Revenue billion Forecast, by Types 2020 & 2033
- Table 76: Global Shelf Edge Digital Signage Volume K Forecast, by Types 2020 & 2033
- Table 77: Global Shelf Edge Digital Signage Revenue billion Forecast, by Country 2020 & 2033
- Table 78: Global Shelf Edge Digital Signage Volume K Forecast, by Country 2020 & 2033
- Table 79: China Shelf Edge Digital Signage Revenue (billion) Forecast, by Application 2020 & 2033
- Table 80: China Shelf Edge Digital Signage Volume (K) Forecast, by Application 2020 & 2033
- Table 81: India Shelf Edge Digital Signage Revenue (billion) Forecast, by Application 2020 & 2033
- Table 82: India Shelf Edge Digital Signage Volume (K) Forecast, by Application 2020 & 2033
- Table 83: Japan Shelf Edge Digital Signage Revenue (billion) Forecast, by Application 2020 & 2033
- Table 84: Japan Shelf Edge Digital Signage Volume (K) Forecast, by Application 2020 & 2033
- Table 85: South Korea Shelf Edge Digital Signage Revenue (billion) Forecast, by Application 2020 & 2033
- Table 86: South Korea Shelf Edge Digital Signage Volume (K) Forecast, by Application 2020 & 2033
- Table 87: ASEAN Shelf Edge Digital Signage Revenue (billion) Forecast, by Application 2020 & 2033
- Table 88: ASEAN Shelf Edge Digital Signage Volume (K) Forecast, by Application 2020 & 2033
- Table 89: Oceania Shelf Edge Digital Signage Revenue (billion) Forecast, by Application 2020 & 2033
- Table 90: Oceania Shelf Edge Digital Signage Volume (K) Forecast, by Application 2020 & 2033
- Table 91: Rest of Asia Pacific Shelf Edge Digital Signage Revenue (billion) Forecast, by Application 2020 & 2033
- Table 92: Rest of Asia Pacific Shelf Edge Digital Signage Volume (K) Forecast, by Application 2020 & 2033
Frequently Asked Questions
1. What is the projected Compound Annual Growth Rate (CAGR) of the Shelf Edge Digital Signage?
The projected CAGR is approximately 9.35%.
2. Which companies are prominent players in the Shelf Edge Digital Signage?
Key companies in the market include Stratacache, SoluM, NoviSign, Spectracolor, ViviSign, In2Digital, Kuusoft Corp, Real Digital Media, Allsee Technologies, SignStix, Crystal Display Systems, Visimi Digital, James Hogg Display, Saturn Visual Solutions, Netvisual Corporation, SCS Technologies.
3. What are the main segments of the Shelf Edge Digital Signage?
The market segments include Application, Types.
4. Can you provide details about the market size?
The market size is estimated to be USD 7.14 billion as of 2022.
5. What are some drivers contributing to market growth?
N/A
6. What are the notable trends driving market growth?
N/A
7. Are there any restraints impacting market growth?
N/A
8. Can you provide examples of recent developments in the market?
N/A
9. What pricing options are available for accessing the report?
Pricing options include single-user, multi-user, and enterprise licenses priced at USD 3350.00, USD 5025.00, and USD 6700.00 respectively.
10. Is the market size provided in terms of value or volume?
The market size is provided in terms of value, measured in billion and volume, measured in K.
11. Are there any specific market keywords associated with the report?
Yes, the market keyword associated with the report is "Shelf Edge Digital Signage," which aids in identifying and referencing the specific market segment covered.
12. How do I determine which pricing option suits my needs best?
The pricing options vary based on user requirements and access needs. Individual users may opt for single-user licenses, while businesses requiring broader access may choose multi-user or enterprise licenses for cost-effective access to the report.
13. Are there any additional resources or data provided in the Shelf Edge Digital Signage report?
While the report offers comprehensive insights, it's advisable to review the specific contents or supplementary materials provided to ascertain if additional resources or data are available.
14. How can I stay updated on further developments or reports in the Shelf Edge Digital Signage?
To stay informed about further developments, trends, and reports in the Shelf Edge Digital Signage, consider subscribing to industry newsletters, following relevant companies and organizations, or regularly checking reputable industry news sources and publications.
Methodology
Step 1 - Identification of Relevant Samples Size from Population Database


Step 2 - Approaches for Defining Global Market Size (Value, Volume* & Price*)

Note*: In applicable scenarios
Step 3 - Data Sources
Primary Research
- Web Analytics
- Survey Reports
- Research Institute
- Latest Research Reports
- Opinion Leaders
Secondary Research
- Annual Reports
- White Paper
- Latest Press Release
- Industry Association
- Paid Database
- Investor Presentations

Step 4 - Data Triangulation
Involves using different sources of information in order to increase the validity of a study
These sources are likely to be stakeholders in a program - participants, other researchers, program staff, other community members, and so on.
Then we put all data in single framework & apply various statistical tools to find out the dynamic on the market.
During the analysis stage, feedback from the stakeholder groups would be compared to determine areas of agreement as well as areas of divergence