

Key Insights
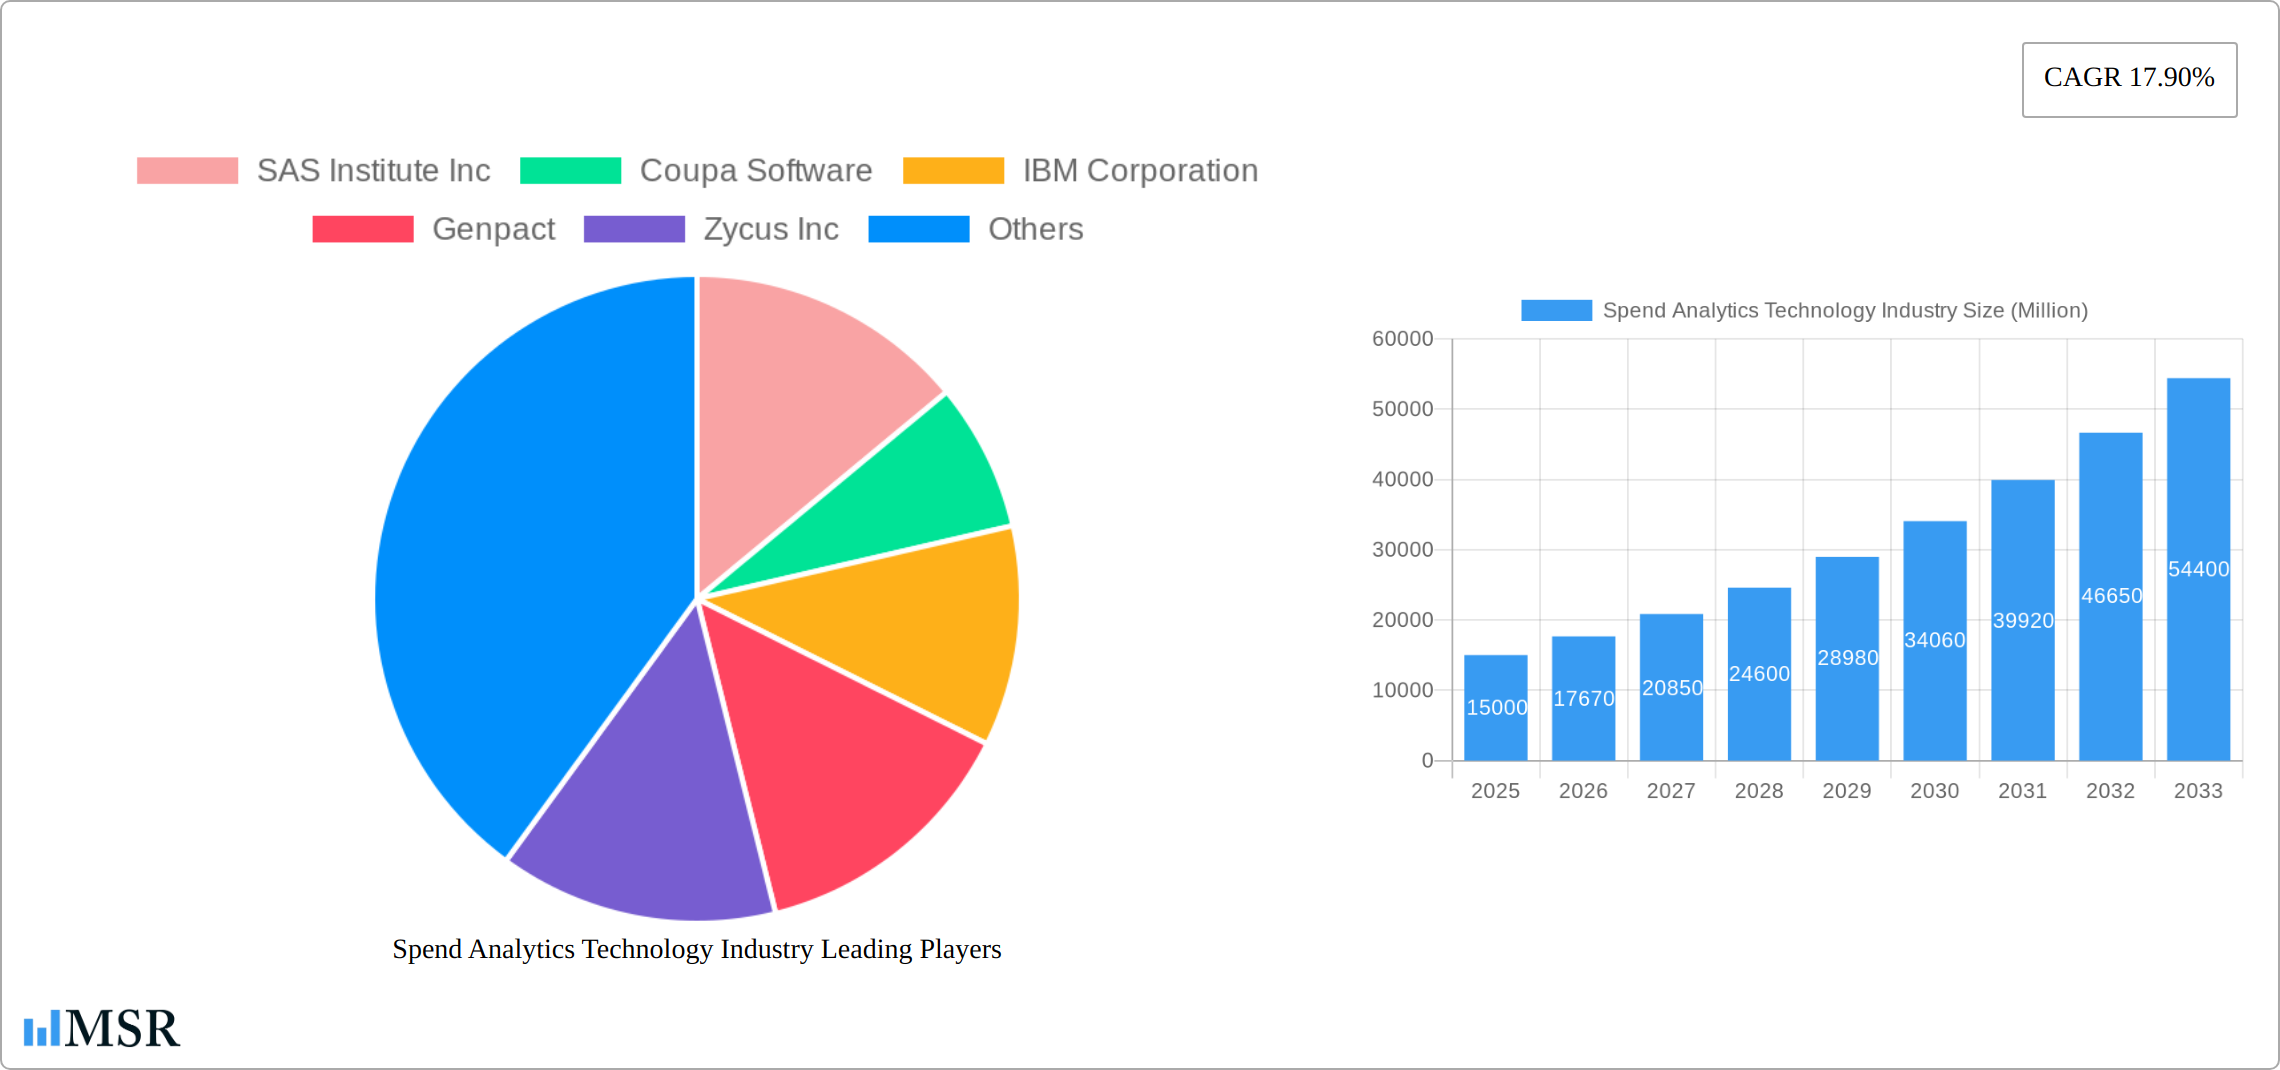
The Spend Analytics Technology market is experiencing robust growth, projected to reach a substantial size by 2033. A Compound Annual Growth Rate (CAGR) of 17.90% from 2025 to 2033 indicates significant market expansion driven by several key factors. The increasing need for businesses to optimize procurement processes, gain better visibility into spending patterns, and improve cost control are primary drivers. The rise of cloud-based solutions, offering scalability and accessibility, further fuels this growth. Furthermore, the adoption of advanced analytics techniques, such as predictive and prescriptive analytics, empowers organizations to make data-driven decisions, leading to enhanced efficiency and profitability. Manufacturing, supply chain & logistics, and retail sectors are major adopters, followed by BFSI, IT & Telecommunication, education, and healthcare. While data security concerns and the complexity of implementing these systems pose challenges, the overall market trajectory remains positive, driven by the considerable return on investment offered by improved spend visibility and control.
The competitive landscape is marked by a mix of established players like SAS Institute Inc., IBM Corporation, and Oracle Corporation, alongside emerging companies specializing in niche areas. Software solutions dominate the market, but the increasing demand for tailored services further contributes to market expansion. Regional growth varies, with North America and Europe expected to maintain significant market shares due to early adoption and robust technological infrastructure. However, the Asia-Pacific region is projected to witness the fastest growth rate, fueled by increasing digitization and expanding business operations across diverse industries. The continued focus on enhancing supply chain resilience, coupled with the growing need for data-driven decision-making across industries, will ensure the sustained growth and expansion of the spend analytics technology market in the coming years.
Spend Analytics Technology Industry Market Report: 2019-2033
This comprehensive report provides a detailed analysis of the Spend Analytics Technology industry, covering market size, growth drivers, key players, and future trends from 2019 to 2033. The study period (2019-2024) provides historical context, while the forecast period (2025-2033), with a base year of 2025 and estimated year of 2025, projects future market dynamics. This report is invaluable for industry stakeholders, investors, and businesses seeking to understand and capitalize on the opportunities within this rapidly evolving sector. The global market is projected to reach xx Million by 2033, exhibiting a CAGR of xx%.
Spend Analytics Technology Industry Market Concentration & Dynamics
The Spend Analytics Technology market exhibits a moderately consolidated landscape, with several major players commanding significant market share. While precise figures for individual market share are commercially sensitive and require further research, leading companies such as SAS Institute Inc, Coupa Software, IBM Corporation, Genpact, Zycus Inc, Oracle Corporation, JAGGAER Incorporation, Sievo Oy, Proactis Inc, and SAP SE hold dominant positions. The market is characterized by ongoing innovation, driven by advancements in artificial intelligence (AI), machine learning (ML), and cloud computing.
- Market Concentration: Moderately consolidated, with top players controlling a significant portion (xx%) of the market.
- Innovation Ecosystems: Strong, fueled by AI, ML, and cloud technologies, leading to the development of advanced analytics capabilities.
- Regulatory Frameworks: Vary by region, impacting data privacy and security compliance. Compliance costs influence operational expenditure.
- Substitute Products: Limited direct substitutes; however, basic spreadsheet analysis can offer a rudimentary alternative.
- End-User Trends: Increasing adoption of cloud-based solutions and demand for predictive analytics.
- M&A Activities: Significant M&A activity, reflecting industry consolidation and technological expansion (e.g., SAP's acquisition of Askdata, JAGGAER's acquisition of DocSkiff). Over the period 2019-2024, xx M&A deals were recorded.
Spend Analytics Technology Industry Industry Insights & Trends
The Spend Analytics Technology market is experiencing robust growth, driven primarily by the increasing need for businesses to optimize their spending, improve supply chain efficiency, and gain better insights into their financial performance. The global market size was valued at xx Million in 2024 and is projected to reach xx Million by 2033, exhibiting a strong Compound Annual Growth Rate (CAGR) of xx%. This growth is fueled by several key factors:
- Technological Disruptions: Advancements in AI, ML, and big data analytics are transforming the capabilities of spend analytics platforms, enabling more sophisticated analysis and predictive modeling.
- Evolving Consumer Behaviors: Businesses are increasingly adopting cloud-based solutions, demanding greater mobility and accessibility to their spend data.
- Market Growth Drivers: Rising demand for improved operational efficiency, enhanced risk management, and data-driven decision-making across various industries.
- Increased focus on compliance and regulations: Stringent governmental regulations across industries are creating a greater demand for spend analysis technology, helping organization comply with changing compliance regulations.

Key Markets & Segments Leading Spend Analytics Technology Industry
The Spend Analytics Technology market is segmented by end-user industry, type, analysis, and deployment. While precise market share breakdowns are commercially sensitive and require further research, the Manufacturing, Supply Chain & Logistics, and BFSI sectors currently represent significant market segments. Similarly, the Software segment within the 'Type' category is dominant, although the services segment is experiencing rapid growth. Cloud deployment is rapidly outpacing on-premise solutions.
- By End-user Industry:
- Manufacturing: High adoption due to the need for optimizing procurement and supply chain processes.
- Supply Chain & Logistics: Demand for real-time visibility and cost optimization.
- Retail: Focus on inventory management and pricing strategies.
- BFSI: Stringent regulatory compliance requirements driving demand for robust analytics.
- IT & Telecommunication: Managing IT infrastructure spending efficiently.
- Education: Optimizing procurement and resource allocation.
- Healthcare: Cost control and compliance with healthcare regulations.
- Other End-user Industries: Growing adoption across a wide range of sectors.
- By Type: Software solutions currently dominate, driven by ease of implementation and scalability.
- By Analysis: Predictive analytics is gaining traction due to its ability to forecast future trends and risks.
- By Deployment: Cloud-based solutions are rapidly gaining market share due to their flexibility and cost-effectiveness.
Spend Analytics Technology Industry Product Developments
Recent advancements have focused on integrating AI and ML capabilities into spend analytics platforms, enabling more accurate forecasting, anomaly detection, and automated insights. The development of user-friendly interfaces and seamless integrations with existing ERP systems are also key product developments. These innovations provide businesses with actionable insights to optimize spending and improve operational efficiency, delivering a substantial competitive advantage.
Challenges in the Spend Analytics Technology Industry Market
The industry faces challenges such as the need for skilled professionals capable of implementing and utilizing these sophisticated analytical systems. Data security and privacy concerns necessitate robust security measures, adding to compliance costs. The high cost of implementation and integration with existing systems, coupled with the competitive pressure from numerous established players and smaller niche entrants, can impact market penetration and profit margins. These factors may hinder market growth, particularly among smaller businesses with limited IT budgets.
Forces Driving Spend Analytics Technology Industry Growth
Key growth drivers include the increasing adoption of cloud computing, the rising demand for advanced analytics capabilities, and the growing need for improved cost control and transparency across organizations. Government regulations mandating enhanced financial reporting and compliance further fuel market growth. The expanding adoption of digital transformation strategies across all sectors is accelerating the need for improved data-driven decision-making, creating a strong tailwind for spend analytics technology.
Long-Term Growth Catalysts in the Spend Analytics Technology Industry
Long-term growth is fueled by continued innovation in AI and ML, leading to more sophisticated predictive capabilities. Strategic partnerships between spend analytics providers and ERP vendors will enable deeper integration and broader market reach. Expansion into new markets, such as emerging economies with growing digitalization, will also contribute significantly to future growth.
Emerging Opportunities in Spend Analytics Technology Industry
Emerging opportunities lie in developing specialized solutions for specific industries, incorporating advanced technologies such as blockchain for enhanced security and transparency. The integration of spend analytics with other enterprise applications, such as supply chain management and procurement platforms, will further unlock valuable insights and create new revenue streams. The focus on sustainability and environmental, social, and governance (ESG) factors presents further opportunities to develop solutions tailored to these growing concerns.
Leading Players in the Spend Analytics Technology Industry Sector
- SAS Institute Inc
- Coupa Software
- IBM Corporation
- Genpact
- Zycus Inc
- Oracle Corporation
- Empronc Solutions Pvt Ltd
- JAGGAER Incorporation
- Sievo Oy
- Proactis Inc
- SAP SE
Key Milestones in Spend Analytics Technology Industry Industry
- February 2022: JAGGAER announced the acquisition of DocSkiff Inc., an AI-powered contracts analysis platform, enhancing contract analysis capabilities.
- July 2022: SAP SE acquired Askdata, a search-driven analytics startup, improving AI-driven natural language search within its platform.
Strategic Outlook for Spend Analytics Technology Market
The Spend Analytics Technology market exhibits significant future potential, driven by ongoing technological advancements and the increasing demand for data-driven decision-making across industries. Strategic partnerships, focused product development, and expansion into new geographic markets will be critical for continued growth. Companies that effectively leverage AI and ML to provide insightful and actionable solutions will be best positioned to succeed in this dynamic market.
Spend Analytics Technology Industry Segmentation
-
1. Type
- 1.1. Software
-
1.2. Service
- 1.2.1. Professional Service
- 1.2.2. Managed Service
-
2. Analysis
- 2.1. Descriptive
- 2.2. Prescriptive
- 2.3. Predictive
-
3. Deployment
- 3.1. On-Premise
- 3.2. Cloud
-
4. End-user Industry
- 4.1. Manufacturing
- 4.2. Supply Chain & Logistic
- 4.3. Retail
- 4.4. BFSI
- 4.5. IT & Telecommunication
- 4.6. Education
- 4.7. Healthcare
- 4.8. Other End-user Industries
Spend Analytics Technology Industry Segmentation By Geography
- 1. North America
- 2. Europe
- 3. Asia Pacific
- 4. Latin America
- 5. Middle East

Spend Analytics Technology Industry REPORT HIGHLIGHTS
| Aspects | Details |
|---|---|
| Study Period | 2019-2033 |
| Base Year | 2024 |
| Estimated Year | 2025 |
| Forecast Period | 2025-2033 |
| Historical Period | 2019-2024 |
| Growth Rate | CAGR of 17.90% from 2019-2033 |
| Segmentation |
|
Table of Contents
- 1. Introduction
- 1.1. Research Scope
- 1.2. Market Segmentation
- 1.3. Research Methodology
- 1.4. Definitions and Assumptions
- 2. Executive Summary
- 2.1. Introduction
- 3. Market Dynamics
- 3.1. Introduction
- 3.2. Market Drivers
- 3.2.1. Rising Adoption in Procurement Process in Industries; Rising Adoption of Cloud Services and Increasing Penetration of IoT Applications
- 3.3. Market Restrains
- 3.3.1. Growing Data Breaches Cases
- 3.4. Market Trends
- 3.4.1. Retail Segment is Expected to Hold Significant Share
- 4. Market Factor Analysis
- 4.1. Porters Five Forces
- 4.2. Supply/Value Chain
- 4.3. PESTEL analysis
- 4.4. Market Entropy
- 4.5. Patent/Trademark Analysis
- 5. Global Spend Analytics Technology Industry Analysis, Insights and Forecast, 2019-2031
- 5.1. Market Analysis, Insights and Forecast - by Type
- 5.1.1. Software
- 5.1.2. Service
- 5.1.2.1. Professional Service
- 5.1.2.2. Managed Service
- 5.2. Market Analysis, Insights and Forecast - by Analysis
- 5.2.1. Descriptive
- 5.2.2. Prescriptive
- 5.2.3. Predictive
- 5.3. Market Analysis, Insights and Forecast - by Deployment
- 5.3.1. On-Premise
- 5.3.2. Cloud
- 5.4. Market Analysis, Insights and Forecast - by End-user Industry
- 5.4.1. Manufacturing
- 5.4.2. Supply Chain & Logistic
- 5.4.3. Retail
- 5.4.4. BFSI
- 5.4.5. IT & Telecommunication
- 5.4.6. Education
- 5.4.7. Healthcare
- 5.4.8. Other End-user Industries
- 5.5. Market Analysis, Insights and Forecast - by Region
- 5.5.1. North America
- 5.5.2. Europe
- 5.5.3. Asia Pacific
- 5.5.4. Latin America
- 5.5.5. Middle East
- 5.1. Market Analysis, Insights and Forecast - by Type
- 6. North America Spend Analytics Technology Industry Analysis, Insights and Forecast, 2019-2031
- 6.1. Market Analysis, Insights and Forecast - by Type
- 6.1.1. Software
- 6.1.2. Service
- 6.1.2.1. Professional Service
- 6.1.2.2. Managed Service
- 6.2. Market Analysis, Insights and Forecast - by Analysis
- 6.2.1. Descriptive
- 6.2.2. Prescriptive
- 6.2.3. Predictive
- 6.3. Market Analysis, Insights and Forecast - by Deployment
- 6.3.1. On-Premise
- 6.3.2. Cloud
- 6.4. Market Analysis, Insights and Forecast - by End-user Industry
- 6.4.1. Manufacturing
- 6.4.2. Supply Chain & Logistic
- 6.4.3. Retail
- 6.4.4. BFSI
- 6.4.5. IT & Telecommunication
- 6.4.6. Education
- 6.4.7. Healthcare
- 6.4.8. Other End-user Industries
- 6.1. Market Analysis, Insights and Forecast - by Type
- 7. Europe Spend Analytics Technology Industry Analysis, Insights and Forecast, 2019-2031
- 7.1. Market Analysis, Insights and Forecast - by Type
- 7.1.1. Software
- 7.1.2. Service
- 7.1.2.1. Professional Service
- 7.1.2.2. Managed Service
- 7.2. Market Analysis, Insights and Forecast - by Analysis
- 7.2.1. Descriptive
- 7.2.2. Prescriptive
- 7.2.3. Predictive
- 7.3. Market Analysis, Insights and Forecast - by Deployment
- 7.3.1. On-Premise
- 7.3.2. Cloud
- 7.4. Market Analysis, Insights and Forecast - by End-user Industry
- 7.4.1. Manufacturing
- 7.4.2. Supply Chain & Logistic
- 7.4.3. Retail
- 7.4.4. BFSI
- 7.4.5. IT & Telecommunication
- 7.4.6. Education
- 7.4.7. Healthcare
- 7.4.8. Other End-user Industries
- 7.1. Market Analysis, Insights and Forecast - by Type
- 8. Asia Pacific Spend Analytics Technology Industry Analysis, Insights and Forecast, 2019-2031
- 8.1. Market Analysis, Insights and Forecast - by Type
- 8.1.1. Software
- 8.1.2. Service
- 8.1.2.1. Professional Service
- 8.1.2.2. Managed Service
- 8.2. Market Analysis, Insights and Forecast - by Analysis
- 8.2.1. Descriptive
- 8.2.2. Prescriptive
- 8.2.3. Predictive
- 8.3. Market Analysis, Insights and Forecast - by Deployment
- 8.3.1. On-Premise
- 8.3.2. Cloud
- 8.4. Market Analysis, Insights and Forecast - by End-user Industry
- 8.4.1. Manufacturing
- 8.4.2. Supply Chain & Logistic
- 8.4.3. Retail
- 8.4.4. BFSI
- 8.4.5. IT & Telecommunication
- 8.4.6. Education
- 8.4.7. Healthcare
- 8.4.8. Other End-user Industries
- 8.1. Market Analysis, Insights and Forecast - by Type
- 9. Latin America Spend Analytics Technology Industry Analysis, Insights and Forecast, 2019-2031
- 9.1. Market Analysis, Insights and Forecast - by Type
- 9.1.1. Software
- 9.1.2. Service
- 9.1.2.1. Professional Service
- 9.1.2.2. Managed Service
- 9.2. Market Analysis, Insights and Forecast - by Analysis
- 9.2.1. Descriptive
- 9.2.2. Prescriptive
- 9.2.3. Predictive
- 9.3. Market Analysis, Insights and Forecast - by Deployment
- 9.3.1. On-Premise
- 9.3.2. Cloud
- 9.4. Market Analysis, Insights and Forecast - by End-user Industry
- 9.4.1. Manufacturing
- 9.4.2. Supply Chain & Logistic
- 9.4.3. Retail
- 9.4.4. BFSI
- 9.4.5. IT & Telecommunication
- 9.4.6. Education
- 9.4.7. Healthcare
- 9.4.8. Other End-user Industries
- 9.1. Market Analysis, Insights and Forecast - by Type
- 10. Middle East Spend Analytics Technology Industry Analysis, Insights and Forecast, 2019-2031
- 10.1. Market Analysis, Insights and Forecast - by Type
- 10.1.1. Software
- 10.1.2. Service
- 10.1.2.1. Professional Service
- 10.1.2.2. Managed Service
- 10.2. Market Analysis, Insights and Forecast - by Analysis
- 10.2.1. Descriptive
- 10.2.2. Prescriptive
- 10.2.3. Predictive
- 10.3. Market Analysis, Insights and Forecast - by Deployment
- 10.3.1. On-Premise
- 10.3.2. Cloud
- 10.4. Market Analysis, Insights and Forecast - by End-user Industry
- 10.4.1. Manufacturing
- 10.4.2. Supply Chain & Logistic
- 10.4.3. Retail
- 10.4.4. BFSI
- 10.4.5. IT & Telecommunication
- 10.4.6. Education
- 10.4.7. Healthcare
- 10.4.8. Other End-user Industries
- 10.1. Market Analysis, Insights and Forecast - by Type
- 11. North America Spend Analytics Technology Industry Analysis, Insights and Forecast, 2019-2031
- 11.1. Market Analysis, Insights and Forecast - By Country/Sub-region
- 11.1.1 United States
- 11.1.2 Canada
- 11.1.3 Mexico
- 12. Europe Spend Analytics Technology Industry Analysis, Insights and Forecast, 2019-2031
- 12.1. Market Analysis, Insights and Forecast - By Country/Sub-region
- 12.1.1 Germany
- 12.1.2 United Kingdom
- 12.1.3 France
- 12.1.4 Spain
- 12.1.5 Italy
- 12.1.6 Spain
- 12.1.7 Belgium
- 12.1.8 Netherland
- 12.1.9 Nordics
- 12.1.10 Rest of Europe
- 13. Asia Pacific Spend Analytics Technology Industry Analysis, Insights and Forecast, 2019-2031
- 13.1. Market Analysis, Insights and Forecast - By Country/Sub-region
- 13.1.1 China
- 13.1.2 Japan
- 13.1.3 India
- 13.1.4 South Korea
- 13.1.5 Southeast Asia
- 13.1.6 Australia
- 13.1.7 Indonesia
- 13.1.8 Phillipes
- 13.1.9 Singapore
- 13.1.10 Thailandc
- 13.1.11 Rest of Asia Pacific
- 14. South America Spend Analytics Technology Industry Analysis, Insights and Forecast, 2019-2031
- 14.1. Market Analysis, Insights and Forecast - By Country/Sub-region
- 14.1.1 Brazil
- 14.1.2 Argentina
- 14.1.3 Peru
- 14.1.4 Chile
- 14.1.5 Colombia
- 14.1.6 Ecuador
- 14.1.7 Venezuela
- 14.1.8 Rest of South America
- 15. North America Spend Analytics Technology Industry Analysis, Insights and Forecast, 2019-2031
- 15.1. Market Analysis, Insights and Forecast - By Country/Sub-region
- 15.1.1 United States
- 15.1.2 Canada
- 15.1.3 Mexico
- 16. MEA Spend Analytics Technology Industry Analysis, Insights and Forecast, 2019-2031
- 16.1. Market Analysis, Insights and Forecast - By Country/Sub-region
- 16.1.1 United Arab Emirates
- 16.1.2 Saudi Arabia
- 16.1.3 South Africa
- 16.1.4 Rest of Middle East and Africa
- 17. Competitive Analysis
- 17.1. Global Market Share Analysis 2024
- 17.2. Company Profiles
- 17.2.1 SAS Institute Inc
- 17.2.1.1. Overview
- 17.2.1.2. Products
- 17.2.1.3. SWOT Analysis
- 17.2.1.4. Recent Developments
- 17.2.1.5. Financials (Based on Availability)
- 17.2.2 Coupa Software
- 17.2.2.1. Overview
- 17.2.2.2. Products
- 17.2.2.3. SWOT Analysis
- 17.2.2.4. Recent Developments
- 17.2.2.5. Financials (Based on Availability)
- 17.2.3 IBM Corporation
- 17.2.3.1. Overview
- 17.2.3.2. Products
- 17.2.3.3. SWOT Analysis
- 17.2.3.4. Recent Developments
- 17.2.3.5. Financials (Based on Availability)
- 17.2.4 Genpact
- 17.2.4.1. Overview
- 17.2.4.2. Products
- 17.2.4.3. SWOT Analysis
- 17.2.4.4. Recent Developments
- 17.2.4.5. Financials (Based on Availability)
- 17.2.5 Zycus Inc
- 17.2.5.1. Overview
- 17.2.5.2. Products
- 17.2.5.3. SWOT Analysis
- 17.2.5.4. Recent Developments
- 17.2.5.5. Financials (Based on Availability)
- 17.2.6 Oracle Corporation
- 17.2.6.1. Overview
- 17.2.6.2. Products
- 17.2.6.3. SWOT Analysis
- 17.2.6.4. Recent Developments
- 17.2.6.5. Financials (Based on Availability)
- 17.2.7 Empronc Solutions Pvt Ltd
- 17.2.7.1. Overview
- 17.2.7.2. Products
- 17.2.7.3. SWOT Analysis
- 17.2.7.4. Recent Developments
- 17.2.7.5. Financials (Based on Availability)
- 17.2.8 JAGGAER Incorporation
- 17.2.8.1. Overview
- 17.2.8.2. Products
- 17.2.8.3. SWOT Analysis
- 17.2.8.4. Recent Developments
- 17.2.8.5. Financials (Based on Availability)
- 17.2.9 Sievo Oy*List Not Exhaustive
- 17.2.9.1. Overview
- 17.2.9.2. Products
- 17.2.9.3. SWOT Analysis
- 17.2.9.4. Recent Developments
- 17.2.9.5. Financials (Based on Availability)
- 17.2.10 Proactis Inc
- 17.2.10.1. Overview
- 17.2.10.2. Products
- 17.2.10.3. SWOT Analysis
- 17.2.10.4. Recent Developments
- 17.2.10.5. Financials (Based on Availability)
- 17.2.11 SAP SE
- 17.2.11.1. Overview
- 17.2.11.2. Products
- 17.2.11.3. SWOT Analysis
- 17.2.11.4. Recent Developments
- 17.2.11.5. Financials (Based on Availability)
- 17.2.1 SAS Institute Inc
List of Figures
- Figure 1: Global Spend Analytics Technology Industry Revenue Breakdown (Million, %) by Region 2024 & 2032
- Figure 2: North America Spend Analytics Technology Industry Revenue (Million), by Country 2024 & 2032
- Figure 3: North America Spend Analytics Technology Industry Revenue Share (%), by Country 2024 & 2032
- Figure 4: Europe Spend Analytics Technology Industry Revenue (Million), by Country 2024 & 2032
- Figure 5: Europe Spend Analytics Technology Industry Revenue Share (%), by Country 2024 & 2032
- Figure 6: Asia Pacific Spend Analytics Technology Industry Revenue (Million), by Country 2024 & 2032
- Figure 7: Asia Pacific Spend Analytics Technology Industry Revenue Share (%), by Country 2024 & 2032
- Figure 8: South America Spend Analytics Technology Industry Revenue (Million), by Country 2024 & 2032
- Figure 9: South America Spend Analytics Technology Industry Revenue Share (%), by Country 2024 & 2032
- Figure 10: North America Spend Analytics Technology Industry Revenue (Million), by Country 2024 & 2032
- Figure 11: North America Spend Analytics Technology Industry Revenue Share (%), by Country 2024 & 2032
- Figure 12: MEA Spend Analytics Technology Industry Revenue (Million), by Country 2024 & 2032
- Figure 13: MEA Spend Analytics Technology Industry Revenue Share (%), by Country 2024 & 2032
- Figure 14: North America Spend Analytics Technology Industry Revenue (Million), by Type 2024 & 2032
- Figure 15: North America Spend Analytics Technology Industry Revenue Share (%), by Type 2024 & 2032
- Figure 16: North America Spend Analytics Technology Industry Revenue (Million), by Analysis 2024 & 2032
- Figure 17: North America Spend Analytics Technology Industry Revenue Share (%), by Analysis 2024 & 2032
- Figure 18: North America Spend Analytics Technology Industry Revenue (Million), by Deployment 2024 & 2032
- Figure 19: North America Spend Analytics Technology Industry Revenue Share (%), by Deployment 2024 & 2032
- Figure 20: North America Spend Analytics Technology Industry Revenue (Million), by End-user Industry 2024 & 2032
- Figure 21: North America Spend Analytics Technology Industry Revenue Share (%), by End-user Industry 2024 & 2032
- Figure 22: North America Spend Analytics Technology Industry Revenue (Million), by Country 2024 & 2032
- Figure 23: North America Spend Analytics Technology Industry Revenue Share (%), by Country 2024 & 2032
- Figure 24: Europe Spend Analytics Technology Industry Revenue (Million), by Type 2024 & 2032
- Figure 25: Europe Spend Analytics Technology Industry Revenue Share (%), by Type 2024 & 2032
- Figure 26: Europe Spend Analytics Technology Industry Revenue (Million), by Analysis 2024 & 2032
- Figure 27: Europe Spend Analytics Technology Industry Revenue Share (%), by Analysis 2024 & 2032
- Figure 28: Europe Spend Analytics Technology Industry Revenue (Million), by Deployment 2024 & 2032
- Figure 29: Europe Spend Analytics Technology Industry Revenue Share (%), by Deployment 2024 & 2032
- Figure 30: Europe Spend Analytics Technology Industry Revenue (Million), by End-user Industry 2024 & 2032
- Figure 31: Europe Spend Analytics Technology Industry Revenue Share (%), by End-user Industry 2024 & 2032
- Figure 32: Europe Spend Analytics Technology Industry Revenue (Million), by Country 2024 & 2032
- Figure 33: Europe Spend Analytics Technology Industry Revenue Share (%), by Country 2024 & 2032
- Figure 34: Asia Pacific Spend Analytics Technology Industry Revenue (Million), by Type 2024 & 2032
- Figure 35: Asia Pacific Spend Analytics Technology Industry Revenue Share (%), by Type 2024 & 2032
- Figure 36: Asia Pacific Spend Analytics Technology Industry Revenue (Million), by Analysis 2024 & 2032
- Figure 37: Asia Pacific Spend Analytics Technology Industry Revenue Share (%), by Analysis 2024 & 2032
- Figure 38: Asia Pacific Spend Analytics Technology Industry Revenue (Million), by Deployment 2024 & 2032
- Figure 39: Asia Pacific Spend Analytics Technology Industry Revenue Share (%), by Deployment 2024 & 2032
- Figure 40: Asia Pacific Spend Analytics Technology Industry Revenue (Million), by End-user Industry 2024 & 2032
- Figure 41: Asia Pacific Spend Analytics Technology Industry Revenue Share (%), by End-user Industry 2024 & 2032
- Figure 42: Asia Pacific Spend Analytics Technology Industry Revenue (Million), by Country 2024 & 2032
- Figure 43: Asia Pacific Spend Analytics Technology Industry Revenue Share (%), by Country 2024 & 2032
- Figure 44: Latin America Spend Analytics Technology Industry Revenue (Million), by Type 2024 & 2032
- Figure 45: Latin America Spend Analytics Technology Industry Revenue Share (%), by Type 2024 & 2032
- Figure 46: Latin America Spend Analytics Technology Industry Revenue (Million), by Analysis 2024 & 2032
- Figure 47: Latin America Spend Analytics Technology Industry Revenue Share (%), by Analysis 2024 & 2032
- Figure 48: Latin America Spend Analytics Technology Industry Revenue (Million), by Deployment 2024 & 2032
- Figure 49: Latin America Spend Analytics Technology Industry Revenue Share (%), by Deployment 2024 & 2032
- Figure 50: Latin America Spend Analytics Technology Industry Revenue (Million), by End-user Industry 2024 & 2032
- Figure 51: Latin America Spend Analytics Technology Industry Revenue Share (%), by End-user Industry 2024 & 2032
- Figure 52: Latin America Spend Analytics Technology Industry Revenue (Million), by Country 2024 & 2032
- Figure 53: Latin America Spend Analytics Technology Industry Revenue Share (%), by Country 2024 & 2032
- Figure 54: Middle East Spend Analytics Technology Industry Revenue (Million), by Type 2024 & 2032
- Figure 55: Middle East Spend Analytics Technology Industry Revenue Share (%), by Type 2024 & 2032
- Figure 56: Middle East Spend Analytics Technology Industry Revenue (Million), by Analysis 2024 & 2032
- Figure 57: Middle East Spend Analytics Technology Industry Revenue Share (%), by Analysis 2024 & 2032
- Figure 58: Middle East Spend Analytics Technology Industry Revenue (Million), by Deployment 2024 & 2032
- Figure 59: Middle East Spend Analytics Technology Industry Revenue Share (%), by Deployment 2024 & 2032
- Figure 60: Middle East Spend Analytics Technology Industry Revenue (Million), by End-user Industry 2024 & 2032
- Figure 61: Middle East Spend Analytics Technology Industry Revenue Share (%), by End-user Industry 2024 & 2032
- Figure 62: Middle East Spend Analytics Technology Industry Revenue (Million), by Country 2024 & 2032
- Figure 63: Middle East Spend Analytics Technology Industry Revenue Share (%), by Country 2024 & 2032
List of Tables
- Table 1: Global Spend Analytics Technology Industry Revenue Million Forecast, by Region 2019 & 2032
- Table 2: Global Spend Analytics Technology Industry Revenue Million Forecast, by Type 2019 & 2032
- Table 3: Global Spend Analytics Technology Industry Revenue Million Forecast, by Analysis 2019 & 2032
- Table 4: Global Spend Analytics Technology Industry Revenue Million Forecast, by Deployment 2019 & 2032
- Table 5: Global Spend Analytics Technology Industry Revenue Million Forecast, by End-user Industry 2019 & 2032
- Table 6: Global Spend Analytics Technology Industry Revenue Million Forecast, by Region 2019 & 2032
- Table 7: Global Spend Analytics Technology Industry Revenue Million Forecast, by Country 2019 & 2032
- Table 8: United States Spend Analytics Technology Industry Revenue (Million) Forecast, by Application 2019 & 2032
- Table 9: Canada Spend Analytics Technology Industry Revenue (Million) Forecast, by Application 2019 & 2032
- Table 10: Mexico Spend Analytics Technology Industry Revenue (Million) Forecast, by Application 2019 & 2032
- Table 11: Global Spend Analytics Technology Industry Revenue Million Forecast, by Country 2019 & 2032
- Table 12: Germany Spend Analytics Technology Industry Revenue (Million) Forecast, by Application 2019 & 2032
- Table 13: United Kingdom Spend Analytics Technology Industry Revenue (Million) Forecast, by Application 2019 & 2032
- Table 14: France Spend Analytics Technology Industry Revenue (Million) Forecast, by Application 2019 & 2032
- Table 15: Spain Spend Analytics Technology Industry Revenue (Million) Forecast, by Application 2019 & 2032
- Table 16: Italy Spend Analytics Technology Industry Revenue (Million) Forecast, by Application 2019 & 2032
- Table 17: Spain Spend Analytics Technology Industry Revenue (Million) Forecast, by Application 2019 & 2032
- Table 18: Belgium Spend Analytics Technology Industry Revenue (Million) Forecast, by Application 2019 & 2032
- Table 19: Netherland Spend Analytics Technology Industry Revenue (Million) Forecast, by Application 2019 & 2032
- Table 20: Nordics Spend Analytics Technology Industry Revenue (Million) Forecast, by Application 2019 & 2032
- Table 21: Rest of Europe Spend Analytics Technology Industry Revenue (Million) Forecast, by Application 2019 & 2032
- Table 22: Global Spend Analytics Technology Industry Revenue Million Forecast, by Country 2019 & 2032
- Table 23: China Spend Analytics Technology Industry Revenue (Million) Forecast, by Application 2019 & 2032
- Table 24: Japan Spend Analytics Technology Industry Revenue (Million) Forecast, by Application 2019 & 2032
- Table 25: India Spend Analytics Technology Industry Revenue (Million) Forecast, by Application 2019 & 2032
- Table 26: South Korea Spend Analytics Technology Industry Revenue (Million) Forecast, by Application 2019 & 2032
- Table 27: Southeast Asia Spend Analytics Technology Industry Revenue (Million) Forecast, by Application 2019 & 2032
- Table 28: Australia Spend Analytics Technology Industry Revenue (Million) Forecast, by Application 2019 & 2032
- Table 29: Indonesia Spend Analytics Technology Industry Revenue (Million) Forecast, by Application 2019 & 2032
- Table 30: Phillipes Spend Analytics Technology Industry Revenue (Million) Forecast, by Application 2019 & 2032
- Table 31: Singapore Spend Analytics Technology Industry Revenue (Million) Forecast, by Application 2019 & 2032
- Table 32: Thailandc Spend Analytics Technology Industry Revenue (Million) Forecast, by Application 2019 & 2032
- Table 33: Rest of Asia Pacific Spend Analytics Technology Industry Revenue (Million) Forecast, by Application 2019 & 2032
- Table 34: Global Spend Analytics Technology Industry Revenue Million Forecast, by Country 2019 & 2032
- Table 35: Brazil Spend Analytics Technology Industry Revenue (Million) Forecast, by Application 2019 & 2032
- Table 36: Argentina Spend Analytics Technology Industry Revenue (Million) Forecast, by Application 2019 & 2032
- Table 37: Peru Spend Analytics Technology Industry Revenue (Million) Forecast, by Application 2019 & 2032
- Table 38: Chile Spend Analytics Technology Industry Revenue (Million) Forecast, by Application 2019 & 2032
- Table 39: Colombia Spend Analytics Technology Industry Revenue (Million) Forecast, by Application 2019 & 2032
- Table 40: Ecuador Spend Analytics Technology Industry Revenue (Million) Forecast, by Application 2019 & 2032
- Table 41: Venezuela Spend Analytics Technology Industry Revenue (Million) Forecast, by Application 2019 & 2032
- Table 42: Rest of South America Spend Analytics Technology Industry Revenue (Million) Forecast, by Application 2019 & 2032
- Table 43: Global Spend Analytics Technology Industry Revenue Million Forecast, by Country 2019 & 2032
- Table 44: United States Spend Analytics Technology Industry Revenue (Million) Forecast, by Application 2019 & 2032
- Table 45: Canada Spend Analytics Technology Industry Revenue (Million) Forecast, by Application 2019 & 2032
- Table 46: Mexico Spend Analytics Technology Industry Revenue (Million) Forecast, by Application 2019 & 2032
- Table 47: Global Spend Analytics Technology Industry Revenue Million Forecast, by Country 2019 & 2032
- Table 48: United Arab Emirates Spend Analytics Technology Industry Revenue (Million) Forecast, by Application 2019 & 2032
- Table 49: Saudi Arabia Spend Analytics Technology Industry Revenue (Million) Forecast, by Application 2019 & 2032
- Table 50: South Africa Spend Analytics Technology Industry Revenue (Million) Forecast, by Application 2019 & 2032
- Table 51: Rest of Middle East and Africa Spend Analytics Technology Industry Revenue (Million) Forecast, by Application 2019 & 2032
- Table 52: Global Spend Analytics Technology Industry Revenue Million Forecast, by Type 2019 & 2032
- Table 53: Global Spend Analytics Technology Industry Revenue Million Forecast, by Analysis 2019 & 2032
- Table 54: Global Spend Analytics Technology Industry Revenue Million Forecast, by Deployment 2019 & 2032
- Table 55: Global Spend Analytics Technology Industry Revenue Million Forecast, by End-user Industry 2019 & 2032
- Table 56: Global Spend Analytics Technology Industry Revenue Million Forecast, by Country 2019 & 2032
- Table 57: Global Spend Analytics Technology Industry Revenue Million Forecast, by Type 2019 & 2032
- Table 58: Global Spend Analytics Technology Industry Revenue Million Forecast, by Analysis 2019 & 2032
- Table 59: Global Spend Analytics Technology Industry Revenue Million Forecast, by Deployment 2019 & 2032
- Table 60: Global Spend Analytics Technology Industry Revenue Million Forecast, by End-user Industry 2019 & 2032
- Table 61: Global Spend Analytics Technology Industry Revenue Million Forecast, by Country 2019 & 2032
- Table 62: Global Spend Analytics Technology Industry Revenue Million Forecast, by Type 2019 & 2032
- Table 63: Global Spend Analytics Technology Industry Revenue Million Forecast, by Analysis 2019 & 2032
- Table 64: Global Spend Analytics Technology Industry Revenue Million Forecast, by Deployment 2019 & 2032
- Table 65: Global Spend Analytics Technology Industry Revenue Million Forecast, by End-user Industry 2019 & 2032
- Table 66: Global Spend Analytics Technology Industry Revenue Million Forecast, by Country 2019 & 2032
- Table 67: Global Spend Analytics Technology Industry Revenue Million Forecast, by Type 2019 & 2032
- Table 68: Global Spend Analytics Technology Industry Revenue Million Forecast, by Analysis 2019 & 2032
- Table 69: Global Spend Analytics Technology Industry Revenue Million Forecast, by Deployment 2019 & 2032
- Table 70: Global Spend Analytics Technology Industry Revenue Million Forecast, by End-user Industry 2019 & 2032
- Table 71: Global Spend Analytics Technology Industry Revenue Million Forecast, by Country 2019 & 2032
- Table 72: Global Spend Analytics Technology Industry Revenue Million Forecast, by Type 2019 & 2032
- Table 73: Global Spend Analytics Technology Industry Revenue Million Forecast, by Analysis 2019 & 2032
- Table 74: Global Spend Analytics Technology Industry Revenue Million Forecast, by Deployment 2019 & 2032
- Table 75: Global Spend Analytics Technology Industry Revenue Million Forecast, by End-user Industry 2019 & 2032
- Table 76: Global Spend Analytics Technology Industry Revenue Million Forecast, by Country 2019 & 2032
Frequently Asked Questions
1. What is the projected Compound Annual Growth Rate (CAGR) of the Spend Analytics Technology Industry?
The projected CAGR is approximately 17.90%.
2. Which companies are prominent players in the Spend Analytics Technology Industry?
Key companies in the market include SAS Institute Inc, Coupa Software, IBM Corporation, Genpact, Zycus Inc, Oracle Corporation, Empronc Solutions Pvt Ltd, JAGGAER Incorporation, Sievo Oy*List Not Exhaustive, Proactis Inc, SAP SE.
3. What are the main segments of the Spend Analytics Technology Industry?
The market segments include Type, Analysis, Deployment, End-user Industry.
4. Can you provide details about the market size?
The market size is estimated to be USD XX Million as of 2022.
5. What are some drivers contributing to market growth?
Rising Adoption in Procurement Process in Industries; Rising Adoption of Cloud Services and Increasing Penetration of IoT Applications.
6. What are the notable trends driving market growth?
Retail Segment is Expected to Hold Significant Share.
7. Are there any restraints impacting market growth?
Growing Data Breaches Cases.
8. Can you provide examples of recent developments in the market?
July 2022 - SAP SE announced the acquisition of Askdata, a startup specializing in search-driven analytics. SAP increases its capabilities to help enterprises make better-informed decisions by employing AI-driven natural language searches with the purchase of Askdata. Users may search, interact, and collaborate on real data to gain the most business insights.
9. What pricing options are available for accessing the report?
Pricing options include single-user, multi-user, and enterprise licenses priced at USD 4750, USD 5250, and USD 8750 respectively.
10. Is the market size provided in terms of value or volume?
The market size is provided in terms of value, measured in Million.
11. Are there any specific market keywords associated with the report?
Yes, the market keyword associated with the report is "Spend Analytics Technology Industry," which aids in identifying and referencing the specific market segment covered.
12. How do I determine which pricing option suits my needs best?
The pricing options vary based on user requirements and access needs. Individual users may opt for single-user licenses, while businesses requiring broader access may choose multi-user or enterprise licenses for cost-effective access to the report.
13. Are there any additional resources or data provided in the Spend Analytics Technology Industry report?
While the report offers comprehensive insights, it's advisable to review the specific contents or supplementary materials provided to ascertain if additional resources or data are available.
14. How can I stay updated on further developments or reports in the Spend Analytics Technology Industry?
To stay informed about further developments, trends, and reports in the Spend Analytics Technology Industry, consider subscribing to industry newsletters, following relevant companies and organizations, or regularly checking reputable industry news sources and publications.
Methodology
Step 1 - Identification of Relevant Samples Size from Population Database


Step 2 - Approaches for Defining Global Market Size (Value, Volume* & Price*)

Note*: In applicable scenarios
Step 3 - Data Sources
Primary Research
- Web Analytics
- Survey Reports
- Research Institute
- Latest Research Reports
- Opinion Leaders
Secondary Research
- Annual Reports
- White Paper
- Latest Press Release
- Industry Association
- Paid Database
- Investor Presentations

Step 4 - Data Triangulation
Involves using different sources of information in order to increase the validity of a study
These sources are likely to be stakeholders in a program - participants, other researchers, program staff, other community members, and so on.
Then we put all data in single framework & apply various statistical tools to find out the dynamic on the market.
During the analysis stage, feedback from the stakeholder groups would be compared to determine areas of agreement as well as areas of divergence
