

Key Insights
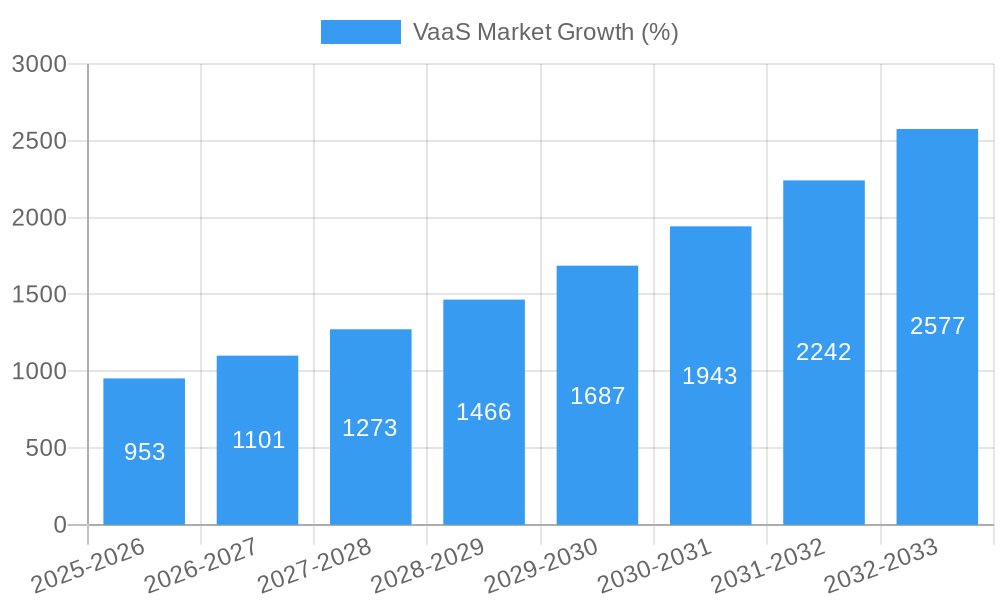
The global Video as a Service (VaaS) market is experiencing robust growth, projected to reach a substantial size by 2033. Driven by the increasing adoption of cloud-based solutions, the demand for enhanced collaboration tools, and the rise of remote work and hybrid work models, the market is witnessing a compound annual growth rate (CAGR) of 14.80%. Key segments fueling this expansion include managed services, public cloud deployment, and industries like government and defense, BFSI, and healthcare, all benefiting from VaaS's ability to improve communication, enhance operational efficiency, and reduce infrastructure costs. The strong growth is further supported by the escalating need for secure and reliable video conferencing and collaboration tools across various devices, from enterprise computing to mobility solutions. Specific platform needs within the market, like application, device, and network management, contribute to the market's complexity and growth potential.
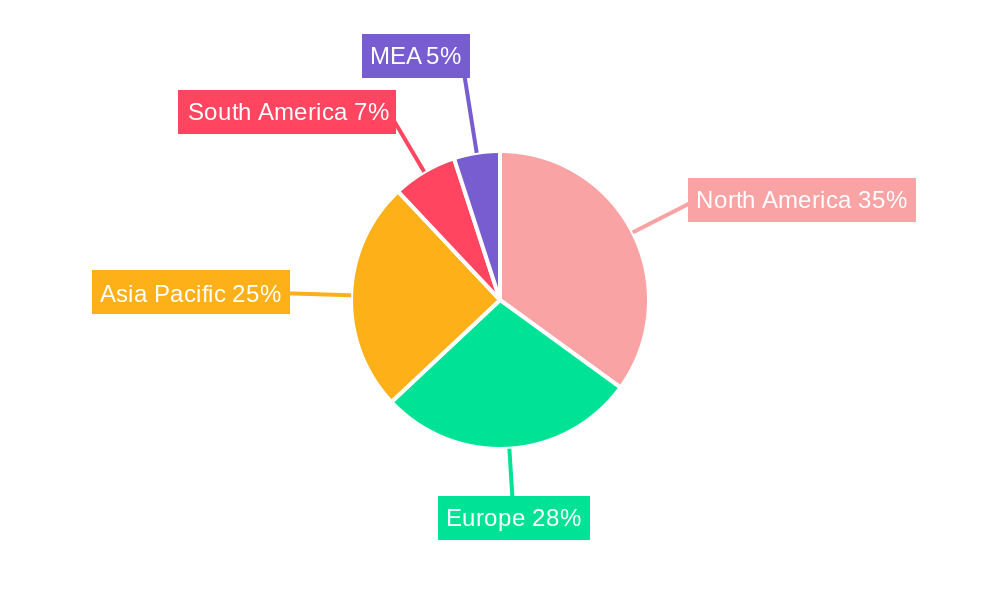
The competitive landscape includes both established technology giants like Cisco and Adobe, alongside specialized VaaS providers. The market's future trajectory will likely be shaped by technological advancements, such as improved video quality, enhanced security features, and seamless integration with other business applications. Further expansion is anticipated in emerging markets across Asia-Pacific and South America as digital infrastructure improves and businesses adopt increasingly sophisticated communication strategies. The hybrid cloud deployment model is poised for significant growth, offering organizations flexibility and scalability in their video communication infrastructure. While certain regulatory hurdles and cybersecurity concerns could act as potential restraints, the overall market outlook for VaaS remains overwhelmingly positive, driven by fundamental changes in the way businesses operate and communicate.
Unlock the Potential of the VaaS Market: A Comprehensive Report (2019-2033)
This in-depth report provides a comprehensive analysis of the Video as a Service (VaaS) market, offering invaluable insights for stakeholders seeking to navigate this rapidly evolving landscape. From market size and segmentation to key players and emerging trends, this report covers all the critical aspects impacting the VaaS market's trajectory. With a study period spanning 2019-2033, a base year of 2025, and a forecast period of 2025-2033, this report provides both historical context and future projections, enabling informed decision-making. The market is projected to reach xx Million by 2033, exhibiting a CAGR of xx%.
VaaS Market Concentration & Dynamics
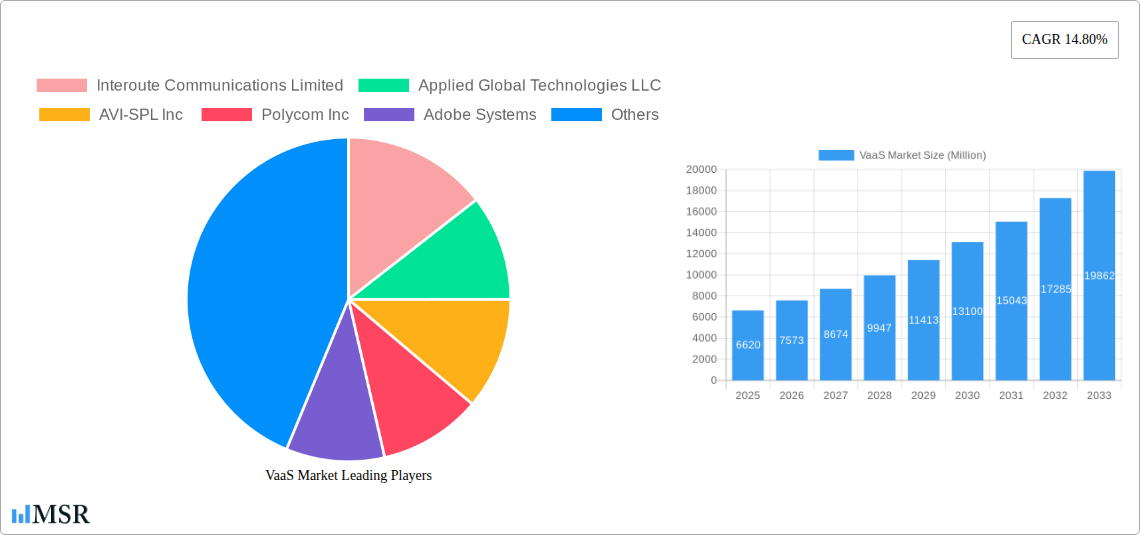
The VaaS market exhibits a moderately concentrated landscape, with a few major players holding significant market share. However, the presence of numerous smaller niche players fosters innovation and competition. Market share data reveals that Cisco Systems Inc. and Avaya Inc. currently hold a leading position, while Adobe Systems and Polycom Inc. maintain significant presence. The xx Million market is influenced by several factors, including:
- Innovation Ecosystems: Rapid technological advancements in video conferencing, cloud computing, and AI are driving innovation within the VaaS market.
- Regulatory Frameworks: Data privacy regulations and cybersecurity concerns are shaping the market dynamics, influencing product development and service delivery.
- Substitute Products: Traditional video conferencing solutions and other communication platforms pose competition to VaaS offerings.
- End-User Trends: The increasing adoption of remote work, hybrid work models, and the rise of digital collaboration are fueling the growth of the VaaS market. The shift towards cloud-based solutions is a major trend.
- M&A Activities: The VaaS market has witnessed several mergers and acquisitions in recent years, with xx M&A deals recorded in the historical period (2019-2024). These activities aim to enhance market share, expand service offerings, and strengthen competitive positions.
VaaS Market Industry Insights & Trends
The VaaS market is experiencing robust growth, driven by several key factors: The increasing adoption of cloud-based solutions, coupled with rising demand for flexible and scalable communication platforms, is accelerating market expansion. Technological advancements in areas such as AI-powered video analytics and enhanced security features are further enhancing the appeal of VaaS. The shift toward hybrid work models and remote collaborations is fundamentally reshaping the market. The integration of VaaS solutions with other communication and collaboration tools is also gaining traction, creating new opportunities for growth. The global VaaS market size was valued at xx Million in 2024, and is projected to reach xx Million by 2033. The market is expected to witness substantial growth during the forecast period (2025-2033), fueled by increasing investments in cloud infrastructure, growing demand for seamless communication across geographically dispersed teams, and the expanding adoption of AI-powered features within VaaS platforms.
Key Markets & Segments Leading VaaS Market
The North American region currently holds the dominant position in the VaaS market, driven by high adoption rates among large enterprises and SMEs across various sectors. However, Asia-Pacific is poised for significant growth in the coming years. Key segments driving market growth include:
Drivers:
- Economic Growth: Increased spending on IT infrastructure in developed and developing economies is a primary driver.
- Technological Advancements: AI integration and enhanced security features.
- Improved Infrastructure: Expansion of broadband networks and cloud computing infrastructure.
Dominance Analysis:
- By Service: Managed services account for a larger share of the VaaS market due to their cost-effectiveness and ease of implementation.
- By Deployment Model: The Public Cloud segment holds the largest market share, as businesses increasingly adopt cloud-based infrastructure for its scalability and flexibility.
- By End-user Industry: BFSI, IT & Telecom and Healthcare sectors are major adopters of VaaS, driven by increased remote operations.
- By Platform: Application management currently dominates the platform segment, followed by device and network management.
- By Device: Enterprise computing devices remain the primary devices used for VaaS, although mobility devices are rapidly gaining traction.
VaaS Market Product Developments
Recent product innovations have focused on enhancing the user experience, integrating AI-powered features, and improving security protocols. The introduction of features such as real-time translation, advanced analytics, and integration with other workplace collaboration tools are driving market competitiveness and adoption. This also includes the rise of specialized VaaS platforms tailored to specific industry needs.
Challenges in the VaaS Market Market
The VaaS market faces several challenges including:
- High Initial Investment Costs: Setting up and implementing a VaaS solution can require significant upfront investment for infrastructure and software.
- Security and Privacy Concerns: Data breaches and security vulnerabilities can lead to significant financial and reputational damage.
- Integration Complexity: Integrating VaaS with existing communication systems can be complex and time-consuming.
- Competition: Intense competition from established players and emerging startups is putting pressure on margins.
Forces Driving VaaS Market Growth
Key growth drivers include:
- Technological Advancements: AI-powered features, improved video quality, and enhanced security are boosting market adoption.
- Increased Demand for Remote Work Solutions: The shift toward hybrid work models is driving up demand.
- Expanding Cloud Infrastructure: The expansion of cloud computing infrastructure provides greater scalability and cost-effectiveness.
Challenges in the VaaS Market Market (Long-Term Growth Catalysts)
Long-term growth will be fueled by continued innovation, strategic partnerships, and expansion into new markets. Investment in AI and machine learning, the development of more secure and reliable platforms, and the integration of VaaS with other enterprise solutions are key factors.
Emerging Opportunities in VaaS Market
Emerging opportunities include the expansion of VaaS into new sectors like education and retail, the development of specialized VaaS platforms for specific industries, and the increasing integration of VaaS with IoT devices. The use of VR/AR technologies within VaaS is also an area of potential growth.
Leading Players in the VaaS Market Sector
- Interoute Communications Limited
- Applied Global Technologies LLC
- AVI-SPL Inc
- Polycom Inc
- Adobe Systems
- Cisco Systems Inc
- Avaya Inc
- BlueJeans Network
- Huawei Technologies Co Limited
- Vidyo Inc
Key Milestones in VaaS Market Industry
- November 2022: Tesla integrates Zoom app into its infotainment system, expanding VaaS reach to the automotive sector.
- October 2022: Cisco and Microsoft's alliance enhances Microsoft Teams integration into Cisco devices, strengthening market collaboration and driving adoption.
Strategic Outlook for VaaS Market Market
The VaaS market holds significant future potential, driven by technological advancements, the expansion of cloud infrastructure, and the increasing adoption of remote work models. Companies focusing on innovation, strategic partnerships, and expansion into emerging markets are well-positioned for success in this dynamic sector.
VaaS Market Segmentation
-
1. Platform
- 1.1. Application Management
- 1.2. Device Management
- 1.3. Network Management
-
2. Device
- 2.1. Mobility Devices
- 2.2. Enterprise Computing
-
3. Service
- 3.1. Managed
- 3.2. Professional
-
4. Deployment Model
- 4.1. Public Cloud
- 4.2. Private Cloud
- 4.3. Hybrid Cloud
-
5. End-user Industry
- 5.1. Government and Defense
- 5.2. BFSI
- 5.3. Healthcare
- 5.4. IT & Telecom
- 5.5. Media & Entertainment
- 5.6. Manufacturing
- 5.7. Other End-user Industries
VaaS Market Segmentation By Geography
- 1. North America
- 2. Europe
- 3. Asia
- 4. Latin America
- 5. Middle East and Africa
VaaS Market REPORT HIGHLIGHTS
| Aspects | Details |
|---|---|
| Study Period | 2019-2033 |
| Base Year | 2024 |
| Estimated Year | 2025 |
| Forecast Period | 2025-2033 |
| Historical Period | 2019-2024 |
| Growth Rate | CAGR of 14.80% from 2019-2033 |
| Segmentation |
|
Table of Contents
- 1. Introduction
- 1.1. Research Scope
- 1.2. Market Segmentation
- 1.3. Research Methodology
- 1.4. Definitions and Assumptions
- 2. Executive Summary
- 2.1. Introduction
- 3. Market Dynamics
- 3.1. Introduction
- 3.2. Market Drivers
- 3.2.1. Increasing Investment on Cloud-Based Video Services; Enabling Digital Workforce
- 3.3. Market Restrains
- 3.3.1. High Cost of Video Content Creation and Validity
- 3.4. Market Trends
- 3.4.1. The Hybrid Cloud Segment is Anticipated to Drive the Market Demand
- 4. Market Factor Analysis
- 4.1. Porters Five Forces
- 4.2. Supply/Value Chain
- 4.3. PESTEL analysis
- 4.4. Market Entropy
- 4.5. Patent/Trademark Analysis
- 5. Global VaaS Market Analysis, Insights and Forecast, 2019-2031
- 5.1. Market Analysis, Insights and Forecast - by Platform
- 5.1.1. Application Management
- 5.1.2. Device Management
- 5.1.3. Network Management
- 5.2. Market Analysis, Insights and Forecast - by Device
- 5.2.1. Mobility Devices
- 5.2.2. Enterprise Computing
- 5.3. Market Analysis, Insights and Forecast - by Service
- 5.3.1. Managed
- 5.3.2. Professional
- 5.4. Market Analysis, Insights and Forecast - by Deployment Model
- 5.4.1. Public Cloud
- 5.4.2. Private Cloud
- 5.4.3. Hybrid Cloud
- 5.5. Market Analysis, Insights and Forecast - by End-user Industry
- 5.5.1. Government and Defense
- 5.5.2. BFSI
- 5.5.3. Healthcare
- 5.5.4. IT & Telecom
- 5.5.5. Media & Entertainment
- 5.5.6. Manufacturing
- 5.5.7. Other End-user Industries
- 5.6. Market Analysis, Insights and Forecast - by Region
- 5.6.1. North America
- 5.6.2. Europe
- 5.6.3. Asia
- 5.6.4. Latin America
- 5.6.5. Middle East and Africa
- 5.1. Market Analysis, Insights and Forecast - by Platform
- 6. North America VaaS Market Analysis, Insights and Forecast, 2019-2031
- 6.1. Market Analysis, Insights and Forecast - by Platform
- 6.1.1. Application Management
- 6.1.2. Device Management
- 6.1.3. Network Management
- 6.2. Market Analysis, Insights and Forecast - by Device
- 6.2.1. Mobility Devices
- 6.2.2. Enterprise Computing
- 6.3. Market Analysis, Insights and Forecast - by Service
- 6.3.1. Managed
- 6.3.2. Professional
- 6.4. Market Analysis, Insights and Forecast - by Deployment Model
- 6.4.1. Public Cloud
- 6.4.2. Private Cloud
- 6.4.3. Hybrid Cloud
- 6.5. Market Analysis, Insights and Forecast - by End-user Industry
- 6.5.1. Government and Defense
- 6.5.2. BFSI
- 6.5.3. Healthcare
- 6.5.4. IT & Telecom
- 6.5.5. Media & Entertainment
- 6.5.6. Manufacturing
- 6.5.7. Other End-user Industries
- 6.1. Market Analysis, Insights and Forecast - by Platform
- 7. Europe VaaS Market Analysis, Insights and Forecast, 2019-2031
- 7.1. Market Analysis, Insights and Forecast - by Platform
- 7.1.1. Application Management
- 7.1.2. Device Management
- 7.1.3. Network Management
- 7.2. Market Analysis, Insights and Forecast - by Device
- 7.2.1. Mobility Devices
- 7.2.2. Enterprise Computing
- 7.3. Market Analysis, Insights and Forecast - by Service
- 7.3.1. Managed
- 7.3.2. Professional
- 7.4. Market Analysis, Insights and Forecast - by Deployment Model
- 7.4.1. Public Cloud
- 7.4.2. Private Cloud
- 7.4.3. Hybrid Cloud
- 7.5. Market Analysis, Insights and Forecast - by End-user Industry
- 7.5.1. Government and Defense
- 7.5.2. BFSI
- 7.5.3. Healthcare
- 7.5.4. IT & Telecom
- 7.5.5. Media & Entertainment
- 7.5.6. Manufacturing
- 7.5.7. Other End-user Industries
- 7.1. Market Analysis, Insights and Forecast - by Platform
- 8. Asia VaaS Market Analysis, Insights and Forecast, 2019-2031
- 8.1. Market Analysis, Insights and Forecast - by Platform
- 8.1.1. Application Management
- 8.1.2. Device Management
- 8.1.3. Network Management
- 8.2. Market Analysis, Insights and Forecast - by Device
- 8.2.1. Mobility Devices
- 8.2.2. Enterprise Computing
- 8.3. Market Analysis, Insights and Forecast - by Service
- 8.3.1. Managed
- 8.3.2. Professional
- 8.4. Market Analysis, Insights and Forecast - by Deployment Model
- 8.4.1. Public Cloud
- 8.4.2. Private Cloud
- 8.4.3. Hybrid Cloud
- 8.5. Market Analysis, Insights and Forecast - by End-user Industry
- 8.5.1. Government and Defense
- 8.5.2. BFSI
- 8.5.3. Healthcare
- 8.5.4. IT & Telecom
- 8.5.5. Media & Entertainment
- 8.5.6. Manufacturing
- 8.5.7. Other End-user Industries
- 8.1. Market Analysis, Insights and Forecast - by Platform
- 9. Latin America VaaS Market Analysis, Insights and Forecast, 2019-2031
- 9.1. Market Analysis, Insights and Forecast - by Platform
- 9.1.1. Application Management
- 9.1.2. Device Management
- 9.1.3. Network Management
- 9.2. Market Analysis, Insights and Forecast - by Device
- 9.2.1. Mobility Devices
- 9.2.2. Enterprise Computing
- 9.3. Market Analysis, Insights and Forecast - by Service
- 9.3.1. Managed
- 9.3.2. Professional
- 9.4. Market Analysis, Insights and Forecast - by Deployment Model
- 9.4.1. Public Cloud
- 9.4.2. Private Cloud
- 9.4.3. Hybrid Cloud
- 9.5. Market Analysis, Insights and Forecast - by End-user Industry
- 9.5.1. Government and Defense
- 9.5.2. BFSI
- 9.5.3. Healthcare
- 9.5.4. IT & Telecom
- 9.5.5. Media & Entertainment
- 9.5.6. Manufacturing
- 9.5.7. Other End-user Industries
- 9.1. Market Analysis, Insights and Forecast - by Platform
- 10. Middle East and Africa VaaS Market Analysis, Insights and Forecast, 2019-2031
- 10.1. Market Analysis, Insights and Forecast - by Platform
- 10.1.1. Application Management
- 10.1.2. Device Management
- 10.1.3. Network Management
- 10.2. Market Analysis, Insights and Forecast - by Device
- 10.2.1. Mobility Devices
- 10.2.2. Enterprise Computing
- 10.3. Market Analysis, Insights and Forecast - by Service
- 10.3.1. Managed
- 10.3.2. Professional
- 10.4. Market Analysis, Insights and Forecast - by Deployment Model
- 10.4.1. Public Cloud
- 10.4.2. Private Cloud
- 10.4.3. Hybrid Cloud
- 10.5. Market Analysis, Insights and Forecast - by End-user Industry
- 10.5.1. Government and Defense
- 10.5.2. BFSI
- 10.5.3. Healthcare
- 10.5.4. IT & Telecom
- 10.5.5. Media & Entertainment
- 10.5.6. Manufacturing
- 10.5.7. Other End-user Industries
- 10.1. Market Analysis, Insights and Forecast - by Platform
- 11. North America VaaS Market Analysis, Insights and Forecast, 2019-2031
- 11.1. Market Analysis, Insights and Forecast - By Country/Sub-region
- 11.1.1 United States
- 11.1.2 Canada
- 11.1.3 Mexico
- 12. Europe VaaS Market Analysis, Insights and Forecast, 2019-2031
- 12.1. Market Analysis, Insights and Forecast - By Country/Sub-region
- 12.1.1 Germany
- 12.1.2 United Kingdom
- 12.1.3 France
- 12.1.4 Spain
- 12.1.5 Italy
- 12.1.6 Spain
- 12.1.7 Belgium
- 12.1.8 Netherland
- 12.1.9 Nordics
- 12.1.10 Rest of Europe
- 13. Asia Pacific VaaS Market Analysis, Insights and Forecast, 2019-2031
- 13.1. Market Analysis, Insights and Forecast - By Country/Sub-region
- 13.1.1 China
- 13.1.2 Japan
- 13.1.3 India
- 13.1.4 South Korea
- 13.1.5 Southeast Asia
- 13.1.6 Australia
- 13.1.7 Indonesia
- 13.1.8 Phillipes
- 13.1.9 Singapore
- 13.1.10 Thailandc
- 13.1.11 Rest of Asia Pacific
- 14. South America VaaS Market Analysis, Insights and Forecast, 2019-2031
- 14.1. Market Analysis, Insights and Forecast - By Country/Sub-region
- 14.1.1 Brazil
- 14.1.2 Argentina
- 14.1.3 Peru
- 14.1.4 Chile
- 14.1.5 Colombia
- 14.1.6 Ecuador
- 14.1.7 Venezuela
- 14.1.8 Rest of South America
- 15. North America VaaS Market Analysis, Insights and Forecast, 2019-2031
- 15.1. Market Analysis, Insights and Forecast - By Country/Sub-region
- 15.1.1 United States
- 15.1.2 Canada
- 15.1.3 Mexico
- 16. MEA VaaS Market Analysis, Insights and Forecast, 2019-2031
- 16.1. Market Analysis, Insights and Forecast - By Country/Sub-region
- 16.1.1 United Arab Emirates
- 16.1.2 Saudi Arabia
- 16.1.3 South Africa
- 16.1.4 Rest of Middle East and Africa
- 17. Competitive Analysis
- 17.1. Global Market Share Analysis 2024
- 17.2. Company Profiles
- 17.2.1 Interoute Communications Limited
- 17.2.1.1. Overview
- 17.2.1.2. Products
- 17.2.1.3. SWOT Analysis
- 17.2.1.4. Recent Developments
- 17.2.1.5. Financials (Based on Availability)
- 17.2.2 Applied Global Technologies LLC
- 17.2.2.1. Overview
- 17.2.2.2. Products
- 17.2.2.3. SWOT Analysis
- 17.2.2.4. Recent Developments
- 17.2.2.5. Financials (Based on Availability)
- 17.2.3 AVI-SPL Inc
- 17.2.3.1. Overview
- 17.2.3.2. Products
- 17.2.3.3. SWOT Analysis
- 17.2.3.4. Recent Developments
- 17.2.3.5. Financials (Based on Availability)
- 17.2.4 Polycom Inc
- 17.2.4.1. Overview
- 17.2.4.2. Products
- 17.2.4.3. SWOT Analysis
- 17.2.4.4. Recent Developments
- 17.2.4.5. Financials (Based on Availability)
- 17.2.5 Adobe Systems
- 17.2.5.1. Overview
- 17.2.5.2. Products
- 17.2.5.3. SWOT Analysis
- 17.2.5.4. Recent Developments
- 17.2.5.5. Financials (Based on Availability)
- 17.2.6 Cisco Systems Inc
- 17.2.6.1. Overview
- 17.2.6.2. Products
- 17.2.6.3. SWOT Analysis
- 17.2.6.4. Recent Developments
- 17.2.6.5. Financials (Based on Availability)
- 17.2.7 Avaya Inc
- 17.2.7.1. Overview
- 17.2.7.2. Products
- 17.2.7.3. SWOT Analysis
- 17.2.7.4. Recent Developments
- 17.2.7.5. Financials (Based on Availability)
- 17.2.8 BlueJeans Network
- 17.2.8.1. Overview
- 17.2.8.2. Products
- 17.2.8.3. SWOT Analysis
- 17.2.8.4. Recent Developments
- 17.2.8.5. Financials (Based on Availability)
- 17.2.9 Huawei Technologies Co Limited
- 17.2.9.1. Overview
- 17.2.9.2. Products
- 17.2.9.3. SWOT Analysis
- 17.2.9.4. Recent Developments
- 17.2.9.5. Financials (Based on Availability)
- 17.2.10 Vidyo Inc
- 17.2.10.1. Overview
- 17.2.10.2. Products
- 17.2.10.3. SWOT Analysis
- 17.2.10.4. Recent Developments
- 17.2.10.5. Financials (Based on Availability)
- 17.2.1 Interoute Communications Limited
List of Figures
- Figure 1: Global VaaS Market Revenue Breakdown (Million, %) by Region 2024 & 2032
- Figure 2: North America VaaS Market Revenue (Million), by Country 2024 & 2032
- Figure 3: North America VaaS Market Revenue Share (%), by Country 2024 & 2032
- Figure 4: Europe VaaS Market Revenue (Million), by Country 2024 & 2032
- Figure 5: Europe VaaS Market Revenue Share (%), by Country 2024 & 2032
- Figure 6: Asia Pacific VaaS Market Revenue (Million), by Country 2024 & 2032
- Figure 7: Asia Pacific VaaS Market Revenue Share (%), by Country 2024 & 2032
- Figure 8: South America VaaS Market Revenue (Million), by Country 2024 & 2032
- Figure 9: South America VaaS Market Revenue Share (%), by Country 2024 & 2032
- Figure 10: North America VaaS Market Revenue (Million), by Country 2024 & 2032
- Figure 11: North America VaaS Market Revenue Share (%), by Country 2024 & 2032
- Figure 12: MEA VaaS Market Revenue (Million), by Country 2024 & 2032
- Figure 13: MEA VaaS Market Revenue Share (%), by Country 2024 & 2032
- Figure 14: North America VaaS Market Revenue (Million), by Platform 2024 & 2032
- Figure 15: North America VaaS Market Revenue Share (%), by Platform 2024 & 2032
- Figure 16: North America VaaS Market Revenue (Million), by Device 2024 & 2032
- Figure 17: North America VaaS Market Revenue Share (%), by Device 2024 & 2032
- Figure 18: North America VaaS Market Revenue (Million), by Service 2024 & 2032
- Figure 19: North America VaaS Market Revenue Share (%), by Service 2024 & 2032
- Figure 20: North America VaaS Market Revenue (Million), by Deployment Model 2024 & 2032
- Figure 21: North America VaaS Market Revenue Share (%), by Deployment Model 2024 & 2032
- Figure 22: North America VaaS Market Revenue (Million), by End-user Industry 2024 & 2032
- Figure 23: North America VaaS Market Revenue Share (%), by End-user Industry 2024 & 2032
- Figure 24: North America VaaS Market Revenue (Million), by Country 2024 & 2032
- Figure 25: North America VaaS Market Revenue Share (%), by Country 2024 & 2032
- Figure 26: Europe VaaS Market Revenue (Million), by Platform 2024 & 2032
- Figure 27: Europe VaaS Market Revenue Share (%), by Platform 2024 & 2032
- Figure 28: Europe VaaS Market Revenue (Million), by Device 2024 & 2032
- Figure 29: Europe VaaS Market Revenue Share (%), by Device 2024 & 2032
- Figure 30: Europe VaaS Market Revenue (Million), by Service 2024 & 2032
- Figure 31: Europe VaaS Market Revenue Share (%), by Service 2024 & 2032
- Figure 32: Europe VaaS Market Revenue (Million), by Deployment Model 2024 & 2032
- Figure 33: Europe VaaS Market Revenue Share (%), by Deployment Model 2024 & 2032
- Figure 34: Europe VaaS Market Revenue (Million), by End-user Industry 2024 & 2032
- Figure 35: Europe VaaS Market Revenue Share (%), by End-user Industry 2024 & 2032
- Figure 36: Europe VaaS Market Revenue (Million), by Country 2024 & 2032
- Figure 37: Europe VaaS Market Revenue Share (%), by Country 2024 & 2032
- Figure 38: Asia VaaS Market Revenue (Million), by Platform 2024 & 2032
- Figure 39: Asia VaaS Market Revenue Share (%), by Platform 2024 & 2032
- Figure 40: Asia VaaS Market Revenue (Million), by Device 2024 & 2032
- Figure 41: Asia VaaS Market Revenue Share (%), by Device 2024 & 2032
- Figure 42: Asia VaaS Market Revenue (Million), by Service 2024 & 2032
- Figure 43: Asia VaaS Market Revenue Share (%), by Service 2024 & 2032
- Figure 44: Asia VaaS Market Revenue (Million), by Deployment Model 2024 & 2032
- Figure 45: Asia VaaS Market Revenue Share (%), by Deployment Model 2024 & 2032
- Figure 46: Asia VaaS Market Revenue (Million), by End-user Industry 2024 & 2032
- Figure 47: Asia VaaS Market Revenue Share (%), by End-user Industry 2024 & 2032
- Figure 48: Asia VaaS Market Revenue (Million), by Country 2024 & 2032
- Figure 49: Asia VaaS Market Revenue Share (%), by Country 2024 & 2032
- Figure 50: Latin America VaaS Market Revenue (Million), by Platform 2024 & 2032
- Figure 51: Latin America VaaS Market Revenue Share (%), by Platform 2024 & 2032
- Figure 52: Latin America VaaS Market Revenue (Million), by Device 2024 & 2032
- Figure 53: Latin America VaaS Market Revenue Share (%), by Device 2024 & 2032
- Figure 54: Latin America VaaS Market Revenue (Million), by Service 2024 & 2032
- Figure 55: Latin America VaaS Market Revenue Share (%), by Service 2024 & 2032
- Figure 56: Latin America VaaS Market Revenue (Million), by Deployment Model 2024 & 2032
- Figure 57: Latin America VaaS Market Revenue Share (%), by Deployment Model 2024 & 2032
- Figure 58: Latin America VaaS Market Revenue (Million), by End-user Industry 2024 & 2032
- Figure 59: Latin America VaaS Market Revenue Share (%), by End-user Industry 2024 & 2032
- Figure 60: Latin America VaaS Market Revenue (Million), by Country 2024 & 2032
- Figure 61: Latin America VaaS Market Revenue Share (%), by Country 2024 & 2032
- Figure 62: Middle East and Africa VaaS Market Revenue (Million), by Platform 2024 & 2032
- Figure 63: Middle East and Africa VaaS Market Revenue Share (%), by Platform 2024 & 2032
- Figure 64: Middle East and Africa VaaS Market Revenue (Million), by Device 2024 & 2032
- Figure 65: Middle East and Africa VaaS Market Revenue Share (%), by Device 2024 & 2032
- Figure 66: Middle East and Africa VaaS Market Revenue (Million), by Service 2024 & 2032
- Figure 67: Middle East and Africa VaaS Market Revenue Share (%), by Service 2024 & 2032
- Figure 68: Middle East and Africa VaaS Market Revenue (Million), by Deployment Model 2024 & 2032
- Figure 69: Middle East and Africa VaaS Market Revenue Share (%), by Deployment Model 2024 & 2032
- Figure 70: Middle East and Africa VaaS Market Revenue (Million), by End-user Industry 2024 & 2032
- Figure 71: Middle East and Africa VaaS Market Revenue Share (%), by End-user Industry 2024 & 2032
- Figure 72: Middle East and Africa VaaS Market Revenue (Million), by Country 2024 & 2032
- Figure 73: Middle East and Africa VaaS Market Revenue Share (%), by Country 2024 & 2032
List of Tables
- Table 1: Global VaaS Market Revenue Million Forecast, by Region 2019 & 2032
- Table 2: Global VaaS Market Revenue Million Forecast, by Platform 2019 & 2032
- Table 3: Global VaaS Market Revenue Million Forecast, by Device 2019 & 2032
- Table 4: Global VaaS Market Revenue Million Forecast, by Service 2019 & 2032
- Table 5: Global VaaS Market Revenue Million Forecast, by Deployment Model 2019 & 2032
- Table 6: Global VaaS Market Revenue Million Forecast, by End-user Industry 2019 & 2032
- Table 7: Global VaaS Market Revenue Million Forecast, by Region 2019 & 2032
- Table 8: Global VaaS Market Revenue Million Forecast, by Country 2019 & 2032
- Table 9: United States VaaS Market Revenue (Million) Forecast, by Application 2019 & 2032
- Table 10: Canada VaaS Market Revenue (Million) Forecast, by Application 2019 & 2032
- Table 11: Mexico VaaS Market Revenue (Million) Forecast, by Application 2019 & 2032
- Table 12: Global VaaS Market Revenue Million Forecast, by Country 2019 & 2032
- Table 13: Germany VaaS Market Revenue (Million) Forecast, by Application 2019 & 2032
- Table 14: United Kingdom VaaS Market Revenue (Million) Forecast, by Application 2019 & 2032
- Table 15: France VaaS Market Revenue (Million) Forecast, by Application 2019 & 2032
- Table 16: Spain VaaS Market Revenue (Million) Forecast, by Application 2019 & 2032
- Table 17: Italy VaaS Market Revenue (Million) Forecast, by Application 2019 & 2032
- Table 18: Spain VaaS Market Revenue (Million) Forecast, by Application 2019 & 2032
- Table 19: Belgium VaaS Market Revenue (Million) Forecast, by Application 2019 & 2032
- Table 20: Netherland VaaS Market Revenue (Million) Forecast, by Application 2019 & 2032
- Table 21: Nordics VaaS Market Revenue (Million) Forecast, by Application 2019 & 2032
- Table 22: Rest of Europe VaaS Market Revenue (Million) Forecast, by Application 2019 & 2032
- Table 23: Global VaaS Market Revenue Million Forecast, by Country 2019 & 2032
- Table 24: China VaaS Market Revenue (Million) Forecast, by Application 2019 & 2032
- Table 25: Japan VaaS Market Revenue (Million) Forecast, by Application 2019 & 2032
- Table 26: India VaaS Market Revenue (Million) Forecast, by Application 2019 & 2032
- Table 27: South Korea VaaS Market Revenue (Million) Forecast, by Application 2019 & 2032
- Table 28: Southeast Asia VaaS Market Revenue (Million) Forecast, by Application 2019 & 2032
- Table 29: Australia VaaS Market Revenue (Million) Forecast, by Application 2019 & 2032
- Table 30: Indonesia VaaS Market Revenue (Million) Forecast, by Application 2019 & 2032
- Table 31: Phillipes VaaS Market Revenue (Million) Forecast, by Application 2019 & 2032
- Table 32: Singapore VaaS Market Revenue (Million) Forecast, by Application 2019 & 2032
- Table 33: Thailandc VaaS Market Revenue (Million) Forecast, by Application 2019 & 2032
- Table 34: Rest of Asia Pacific VaaS Market Revenue (Million) Forecast, by Application 2019 & 2032
- Table 35: Global VaaS Market Revenue Million Forecast, by Country 2019 & 2032
- Table 36: Brazil VaaS Market Revenue (Million) Forecast, by Application 2019 & 2032
- Table 37: Argentina VaaS Market Revenue (Million) Forecast, by Application 2019 & 2032
- Table 38: Peru VaaS Market Revenue (Million) Forecast, by Application 2019 & 2032
- Table 39: Chile VaaS Market Revenue (Million) Forecast, by Application 2019 & 2032
- Table 40: Colombia VaaS Market Revenue (Million) Forecast, by Application 2019 & 2032
- Table 41: Ecuador VaaS Market Revenue (Million) Forecast, by Application 2019 & 2032
- Table 42: Venezuela VaaS Market Revenue (Million) Forecast, by Application 2019 & 2032
- Table 43: Rest of South America VaaS Market Revenue (Million) Forecast, by Application 2019 & 2032
- Table 44: Global VaaS Market Revenue Million Forecast, by Country 2019 & 2032
- Table 45: United States VaaS Market Revenue (Million) Forecast, by Application 2019 & 2032
- Table 46: Canada VaaS Market Revenue (Million) Forecast, by Application 2019 & 2032
- Table 47: Mexico VaaS Market Revenue (Million) Forecast, by Application 2019 & 2032
- Table 48: Global VaaS Market Revenue Million Forecast, by Country 2019 & 2032
- Table 49: United Arab Emirates VaaS Market Revenue (Million) Forecast, by Application 2019 & 2032
- Table 50: Saudi Arabia VaaS Market Revenue (Million) Forecast, by Application 2019 & 2032
- Table 51: South Africa VaaS Market Revenue (Million) Forecast, by Application 2019 & 2032
- Table 52: Rest of Middle East and Africa VaaS Market Revenue (Million) Forecast, by Application 2019 & 2032
- Table 53: Global VaaS Market Revenue Million Forecast, by Platform 2019 & 2032
- Table 54: Global VaaS Market Revenue Million Forecast, by Device 2019 & 2032
- Table 55: Global VaaS Market Revenue Million Forecast, by Service 2019 & 2032
- Table 56: Global VaaS Market Revenue Million Forecast, by Deployment Model 2019 & 2032
- Table 57: Global VaaS Market Revenue Million Forecast, by End-user Industry 2019 & 2032
- Table 58: Global VaaS Market Revenue Million Forecast, by Country 2019 & 2032
- Table 59: Global VaaS Market Revenue Million Forecast, by Platform 2019 & 2032
- Table 60: Global VaaS Market Revenue Million Forecast, by Device 2019 & 2032
- Table 61: Global VaaS Market Revenue Million Forecast, by Service 2019 & 2032
- Table 62: Global VaaS Market Revenue Million Forecast, by Deployment Model 2019 & 2032
- Table 63: Global VaaS Market Revenue Million Forecast, by End-user Industry 2019 & 2032
- Table 64: Global VaaS Market Revenue Million Forecast, by Country 2019 & 2032
- Table 65: Global VaaS Market Revenue Million Forecast, by Platform 2019 & 2032
- Table 66: Global VaaS Market Revenue Million Forecast, by Device 2019 & 2032
- Table 67: Global VaaS Market Revenue Million Forecast, by Service 2019 & 2032
- Table 68: Global VaaS Market Revenue Million Forecast, by Deployment Model 2019 & 2032
- Table 69: Global VaaS Market Revenue Million Forecast, by End-user Industry 2019 & 2032
- Table 70: Global VaaS Market Revenue Million Forecast, by Country 2019 & 2032
- Table 71: Global VaaS Market Revenue Million Forecast, by Platform 2019 & 2032
- Table 72: Global VaaS Market Revenue Million Forecast, by Device 2019 & 2032
- Table 73: Global VaaS Market Revenue Million Forecast, by Service 2019 & 2032
- Table 74: Global VaaS Market Revenue Million Forecast, by Deployment Model 2019 & 2032
- Table 75: Global VaaS Market Revenue Million Forecast, by End-user Industry 2019 & 2032
- Table 76: Global VaaS Market Revenue Million Forecast, by Country 2019 & 2032
- Table 77: Global VaaS Market Revenue Million Forecast, by Platform 2019 & 2032
- Table 78: Global VaaS Market Revenue Million Forecast, by Device 2019 & 2032
- Table 79: Global VaaS Market Revenue Million Forecast, by Service 2019 & 2032
- Table 80: Global VaaS Market Revenue Million Forecast, by Deployment Model 2019 & 2032
- Table 81: Global VaaS Market Revenue Million Forecast, by End-user Industry 2019 & 2032
- Table 82: Global VaaS Market Revenue Million Forecast, by Country 2019 & 2032
Frequently Asked Questions
1. What is the projected Compound Annual Growth Rate (CAGR) of the VaaS Market?
The projected CAGR is approximately 14.80%.
2. Which companies are prominent players in the VaaS Market?
Key companies in the market include Interoute Communications Limited, Applied Global Technologies LLC, AVI-SPL Inc , Polycom Inc, Adobe Systems, Cisco Systems Inc, Avaya Inc, BlueJeans Network, Huawei Technologies Co Limited, Vidyo Inc.
3. What are the main segments of the VaaS Market?
The market segments include Platform, Device, Service, Deployment Model, End-user Industry.
4. Can you provide details about the market size?
The market size is estimated to be USD 6.62 Million as of 2022.
5. What are some drivers contributing to market growth?
Increasing Investment on Cloud-Based Video Services; Enabling Digital Workforce.
6. What are the notable trends driving market growth?
The Hybrid Cloud Segment is Anticipated to Drive the Market Demand.
7. Are there any restraints impacting market growth?
High Cost of Video Content Creation and Validity.
8. Can you provide examples of recent developments in the market?
November 2022: Tesla announced that a Tesla driver could use the Zoom app to make or receive video conversations in the vehicle. The Zoom call app would be directly accessed on Tesla's central touchscreen infotainment system. The software utilizes the in-car camera mounted on the rearview mirror.
9. What pricing options are available for accessing the report?
Pricing options include single-user, multi-user, and enterprise licenses priced at USD 4750, USD 5250, and USD 8750 respectively.
10. Is the market size provided in terms of value or volume?
The market size is provided in terms of value, measured in Million.
11. Are there any specific market keywords associated with the report?
Yes, the market keyword associated with the report is "VaaS Market," which aids in identifying and referencing the specific market segment covered.
12. How do I determine which pricing option suits my needs best?
The pricing options vary based on user requirements and access needs. Individual users may opt for single-user licenses, while businesses requiring broader access may choose multi-user or enterprise licenses for cost-effective access to the report.
13. Are there any additional resources or data provided in the VaaS Market report?
While the report offers comprehensive insights, it's advisable to review the specific contents or supplementary materials provided to ascertain if additional resources or data are available.
14. How can I stay updated on further developments or reports in the VaaS Market?
To stay informed about further developments, trends, and reports in the VaaS Market, consider subscribing to industry newsletters, following relevant companies and organizations, or regularly checking reputable industry news sources and publications.
Methodology
Step 1 - Identification of Relevant Samples Size from Population Database


Step 2 - Approaches for Defining Global Market Size (Value, Volume* & Price*)

Note*: In applicable scenarios
Step 3 - Data Sources
Primary Research
- Web Analytics
- Survey Reports
- Research Institute
- Latest Research Reports
- Opinion Leaders
Secondary Research
- Annual Reports
- White Paper
- Latest Press Release
- Industry Association
- Paid Database
- Investor Presentations

Step 4 - Data Triangulation
Involves using different sources of information in order to increase the validity of a study
These sources are likely to be stakeholders in a program - participants, other researchers, program staff, other community members, and so on.
Then we put all data in single framework & apply various statistical tools to find out the dynamic on the market.
During the analysis stage, feedback from the stakeholder groups would be compared to determine areas of agreement as well as areas of divergence
