

Key Insights
The global Video on Demand (VoD) software market is poised for significant expansion, projected to reach $16.1 billion in 2025 with a robust CAGR of 16.4% through 2033. This impressive growth is fueled by an escalating demand for on-demand content across diverse sectors, primarily driven by the ever-increasing consumption of entertainment content. The proliferation of internet accessibility, coupled with the widespread adoption of smart devices, has democratized access to VoD services, making them a staple for global audiences. Furthermore, the education and training sectors are increasingly leveraging VoD platforms for flexible and accessible learning experiences, contributing substantially to market expansion. The burgeoning network video kiosks and the integration of VoD into online commerce platforms are also key growth enablers, reflecting a dynamic market adapting to evolving consumer behaviors and technological advancements.
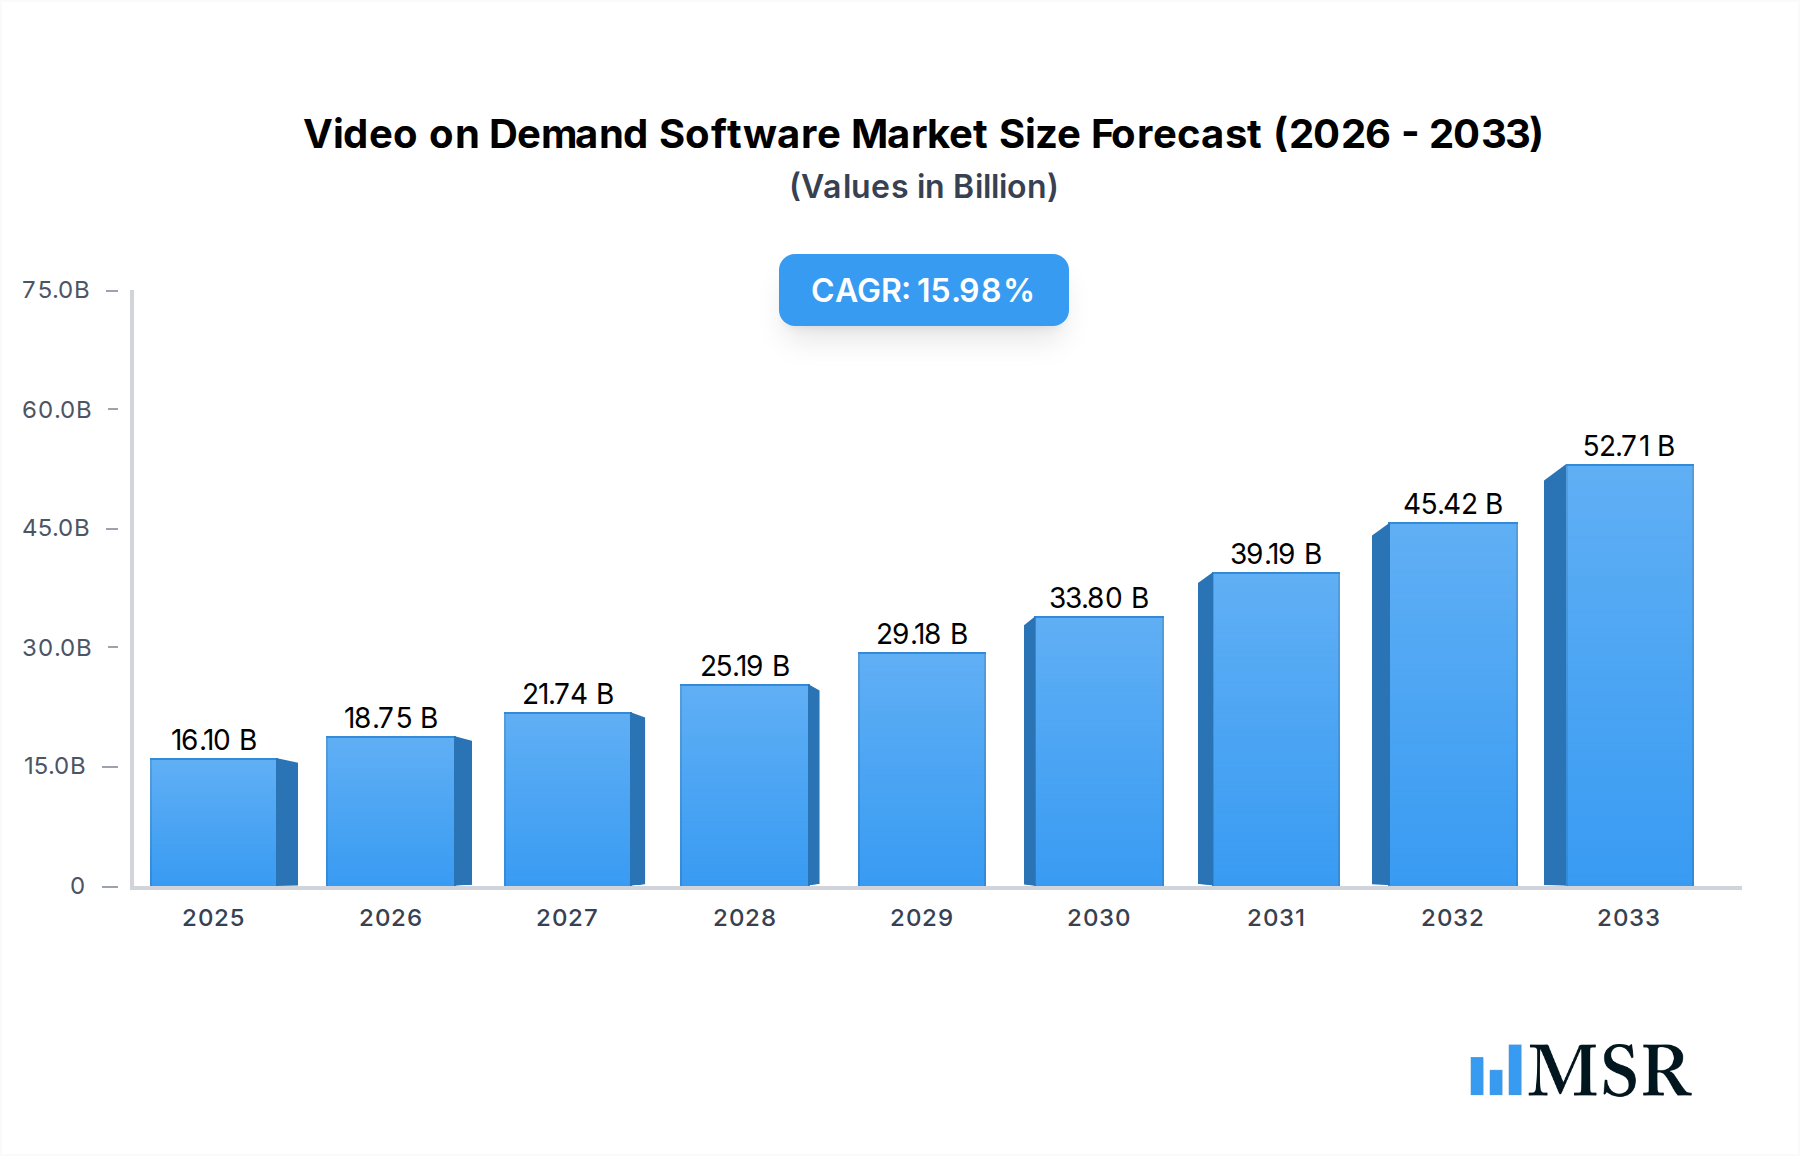
Video on Demand Software Market Size (In Billion)
The market is segmented by application and type, with Entertainment and Subscription Video on Demand (SVOD) dominating current and future revenue streams. While the market exhibits strong growth, it faces certain restraints, including content licensing complexities and increasing competition among service providers, which could impact profitability and market accessibility. However, ongoing technological innovations, such as the development of advanced streaming technologies and personalized content delivery systems, are expected to mitigate these challenges. Key players like IBM, SAP, Adobe, Microsoft, Apple, and Google are heavily investing in R&D, pushing the boundaries of VoD capabilities and ensuring the market's continued upward trajectory. The Asia Pacific region is anticipated to emerge as a major growth hub, driven by its large and digitally-savvy population, alongside established markets in North America and Europe.

Video on Demand Software Company Market Share
Unlock the Future of Entertainment: Comprehensive Video on Demand Software Market Report
This in-depth report delivers actionable insights and strategic intelligence on the global Video on Demand (VOD) Software market. Spanning the historical period of 2019-2024 and projecting through the forecast period of 2025-2033, with a base year and estimated year of 2025, this analysis is your essential guide to navigating the rapidly evolving landscape of digital content delivery. Discover how IBM, SAP, Adobe, Microsoft, Apple, Google, Lightbox, Fujitsu, ZTE, Huawei Technologies, Akamai Technologies, Avaya, Level 3 Communications, AT&T, Cisco, and Ericsson Television are shaping the future of Entertainment, Education and Training, Network Video Kiosks, Online Commerce, Digital Libraries, and other segments. Delve into the dominance of Transactional Video on Demand (TVOD), Subscription Video on Demand (SVOD), Near-Video on Demand (NVOD), and other types. With a projected market size of over $300 billion by 2033, this report is crucial for industry stakeholders, content creators, platform providers, and investors seeking to capitalize on this booming sector.
Video on Demand Software Market Concentration & Dynamics
The global Video on Demand (VOD) Software market exhibits a moderate to high concentration, characterized by the presence of several large, established technology giants and a growing number of innovative startups. Key players like Google, Microsoft, and Apple command significant market share due to their extensive ecosystems and robust infrastructure. The innovation ecosystem is vibrant, with continuous advancements in streaming technology, artificial intelligence for content recommendation, and cloud-based VOD solutions. Regulatory frameworks are evolving, focusing on content licensing, data privacy, and anti-piracy measures, which can impact market entry and operations. Substitute products, such as traditional broadcast television and live streaming events, continue to co-exist, but the convenience and personalization offered by VOD software are increasingly drawing consumers away. End-user trends are heavily influenced by the demand for on-demand access, personalized content, and multi-device compatibility. Mergers and Acquisitions (M&A) activity is a significant driver of market consolidation, with an estimated 250+ M&A deals recorded during the historical period, further shaping the competitive landscape. For instance, the acquisition of 10+ smaller VOD platforms by major players in 2023 highlights this trend.
Video on Demand Software Industry Insights & Trends
The Video on Demand Software industry is experiencing robust growth, projected to reach over $300 billion by 2033, with an estimated Compound Annual Growth Rate (CAGR) of 18% from 2025 to 2033. This expansion is fueled by a confluence of powerful market growth drivers. The increasing penetration of high-speed internet and the proliferation of smart devices worldwide are fundamental enablers, providing the necessary infrastructure for seamless VOD consumption. Evolving consumer behaviors, marked by a growing preference for personalized, anytime, and anywhere access to content, are a primary catalyst. The 'cord-cutting' phenomenon, where consumers are ditching traditional cable subscriptions for flexible VOD services, continues to be a major trend. Technological disruptions are constantly reshaping the VOD landscape. Advancements in streaming codecs, such as AV1 and HEVC, are improving video quality while reducing bandwidth requirements, enhancing user experience. The integration of Artificial Intelligence (AI) and Machine Learning (ML) for personalized content recommendations, viewer analytics, and automated content management is a key differentiating factor. The rise of cloud computing has made VOD solutions more scalable, affordable, and accessible for businesses of all sizes. Furthermore, the growing adoption of 5G technology promises ultra-low latency and higher bandwidth, enabling richer VOD experiences, including high-definition streaming and interactive content. The COVID-19 pandemic significantly accelerated the adoption of VOD services, a trend that is expected to persist as digital entertainment becomes increasingly integral to daily life. The expansion of VOD into new verticals like education and corporate training, beyond its traditional entertainment stronghold, further broadens its market appeal and revenue streams. The global market size for VOD software was estimated at approximately $150 billion in 2025.
Key Markets & Segments Leading Video on Demand Software
The North America region, driven by the United States and Canada, currently dominates the Video on Demand Software market, with an estimated market share exceeding 35%. This dominance is attributed to a mature digital infrastructure, high disposable incomes, a large tech-savvy population, and the early adoption of VOD services by both consumers and content providers.
Application Segments:
- Entertainment: This remains the largest and most influential application segment, accounting for over 60% of the VOD software market.
- Drivers: Proliferation of streaming services (Netflix, Disney+, Amazon Prime Video), demand for on-demand movie and TV show access, growth of original content production, increasing smartphone and smart TV penetration.
- Dominance Analysis: Major players like Netflix and Disney+ have set high benchmarks, while platforms from Apple and Google leverage their device ecosystems to capture significant user bases. The sheer volume of content consumption for leisure drives substantial investment in VOD infrastructure and software.
- Education and Training: This segment is experiencing rapid growth, with an estimated CAGR of 22%.
- Drivers: Rise of e-learning platforms, demand for flexible and accessible professional development, integration of VOD in academic curricula, corporate training initiatives.
- Online Commerce: VOD is increasingly being integrated into e-commerce for product demonstrations and shoppable videos.
- Drivers: Enhanced customer engagement, improved conversion rates, interactive shopping experiences.
- Digital Libraries: Archiving and providing access to vast collections of media.
- Drivers: Preservation of cultural heritage, accessibility of educational resources, growing demand for digital archives.
- Network Video Kiosks: While a niche, these offer on-demand content access in public spaces.
- Drivers: Airports, public transport hubs, hotels seeking to offer entertainment options.
- Others: Includes various niche applications and emerging use cases.
Type Segments:
- Subscription Video on Demand (SVOD): This model continues to be the most prevalent, holding over 70% of the market share.
- Drivers: Predictable recurring revenue for content providers, unlimited access to a vast library for consumers, strong customer loyalty. Key players like Netflix and Disney+ have built their empires on this model.
- Dominance Analysis: The ease of use and value proposition of unlimited content for a monthly fee makes SVOD the preferred choice for most consumers, driving significant adoption and investment.
- Transactional Video on Demand (TVOD): Offers content for purchase or rental on a per-title basis.
- Drivers: Access to the latest releases, pay-per-view events, flexibility for users who prefer not to subscribe. Platforms like Apple TV and Google Play Movies are strong in this segment.
- Near-Video on Demand (NVOD): Offers content at staggered start times to simulate live broadcasting.
- Drivers: Catering to users who miss a specific broadcast time, offering a perceived sense of live availability.
- Others: Encompasses newer models and hybrid approaches.
Video on Demand Software Product Developments
The VOD software market is characterized by continuous product innovation aimed at enhancing user experience and operational efficiency. Companies are investing heavily in AI-powered recommendation engines, offering hyper-personalized content suggestions that drive user engagement and retention. Advancements in adaptive bitrate streaming (ABS) ensure seamless playback across varying network conditions, minimizing buffering. The integration of interactive features, such as live polling, shoppable content, and gamified experiences, is transforming passive viewing into active participation. Furthermore, the development of cross-platform compatibility and robust content management systems (CMS) allows providers to manage and distribute content efficiently across web, mobile, and smart TV devices. The emphasis is on creating scalable, cloud-native solutions that can handle massive amounts of data and traffic.
Challenges in the Video on Demand Software Market
The Video on Demand Software market faces several significant challenges that can impede growth. Intensifying competition among numerous VOD platforms leads to increased customer acquisition costs and pressure on pricing. Content licensing complexities and rising content acquisition costs can significantly impact profitability. Piracy and copyright infringement remain persistent threats, leading to revenue losses. Technical challenges related to infrastructure scalability and bandwidth limitations, especially in emerging markets, can hinder widespread adoption. Regulatory hurdles related to data privacy and content moderation require careful navigation. The estimated impact of piracy on the global VOD industry is upwards of $50 billion annually.
Forces Driving Video on Demand Software Growth
Several powerful forces are propelling the growth of the Video on Demand Software market. The ubiquitous adoption of high-speed internet and mobile devices provides the fundamental infrastructure for VOD consumption. The growing demand for personalized and on-demand entertainment aligns perfectly with the VOD model. Technological advancements in streaming technology, cloud computing, and AI are continuously enhancing the VOD experience and reducing operational costs. The shift in consumer behavior away from traditional linear television towards flexible digital alternatives is a significant market driver. Furthermore, government initiatives promoting digital infrastructure development and content creation also contribute to market expansion.
Challenges in the Video on Demand Software Market
The Video on Demand Software market's long-term growth catalysts lie in its continuous innovation and expansion into new frontiers. The development of immersive VOD experiences, such as virtual reality (VR) and augmented reality (AR) content delivery, presents a significant opportunity. Strategic partnerships and collaborations between content creators, technology providers, and telecommunication companies will unlock new distribution channels and revenue streams. The expansion into underserved emerging markets, where digital infrastructure is rapidly improving, offers substantial growth potential. Furthermore, the increasing integration of VOD with other digital services, such as gaming and social media, will create a more interconnected and engaging entertainment ecosystem. The anticipated investment in 8K streaming technology will further push the boundaries of visual fidelity.
Emerging Opportunities in Video on Demand Software
Emerging opportunities in the Video on Demand Software market are ripe for exploitation. The growth of user-generated content platforms and the creator economy presents opportunities for VOD software to support independent creators. The increasing demand for niche content and specialized streaming services is creating space for smaller, targeted VOD platforms. The integration of VOD with interactive gaming and metaverse platforms offers new avenues for engagement and monetization. Furthermore, the development of advanced analytics and data monetization strategies will enable providers to better understand their audience and optimize content offerings. The potential for AI-driven content creation and personalized content generation is also a significant emerging trend.
Leading Players in the Video on Demand Software Sector
- IBM
- SAP
- Adobe
- Microsoft
- Apple
- Lightbox
- Fujitsu
- ZTE
- Huawei Technologies
- Akamai Technologies
- Avaya
- Level 3 Communications
- AT&T
- Cisco
- Ericsson Television
Key Milestones in Video on Demand Software Industry
- 2019: Significant growth in SVOD subscriber numbers globally, exceeding 500 million by year-end.
- 2020: The COVID-19 pandemic leads to an unprecedented surge in VOD consumption, with streaming hours increasing by over 40%.
- 2021: Major advancements in 8K streaming technology showcased, promising higher visual fidelity.
- 2022: Increased M&A activity as larger players acquire innovative VOD startups to enhance their offerings, with over 40 deals announced.
- 2023: Focus on AI-powered personalization and interactive VOD features intensifies.
- 2024: Expansion of VOD services into emerging markets accelerates, driven by improved internet penetration.
Strategic Outlook for Video on Demand Software Market
The strategic outlook for the Video on Demand Software market remains exceptionally strong, with continued growth fueled by technological advancements and evolving consumer preferences. Key growth accelerators include the ongoing shift from linear to on-demand consumption, the expansion of 5G networks enabling richer streaming experiences, and the increasing adoption of AI for personalization and operational efficiency. The market is expected to witness further consolidation through strategic acquisitions and partnerships, as companies aim to expand their content libraries and global reach. Investment in immersive content formats and interactive VOD will create new revenue streams and enhance user engagement, positioning the VOD software market for sustained expansion and innovation.
Video on Demand Software Segmentation
-
1. Application
- 1.1. Entertainment
- 1.2. Education and Training
- 1.3. Network Video Kiosks
- 1.4. Online Commerce
- 1.5. Digital Libraries
- 1.6. Others
-
2. Types
- 2.1. Transactional Video on Demand (TVOD)
- 2.2. Subscription Video on Demand (SVOD)
- 2.3. Near-Video on Demand (NVOD)
- 2.4. Others
Video on Demand Software Segmentation By Geography
-
1. North America
- 1.1. United States
- 1.2. Canada
- 1.3. Mexico
-
2. South America
- 2.1. Brazil
- 2.2. Argentina
- 2.3. Rest of South America
-
3. Europe
- 3.1. United Kingdom
- 3.2. Germany
- 3.3. France
- 3.4. Italy
- 3.5. Spain
- 3.6. Russia
- 3.7. Benelux
- 3.8. Nordics
- 3.9. Rest of Europe
-
4. Middle East & Africa
- 4.1. Turkey
- 4.2. Israel
- 4.3. GCC
- 4.4. North Africa
- 4.5. South Africa
- 4.6. Rest of Middle East & Africa
-
5. Asia Pacific
- 5.1. China
- 5.2. India
- 5.3. Japan
- 5.4. South Korea
- 5.5. ASEAN
- 5.6. Oceania
- 5.7. Rest of Asia Pacific
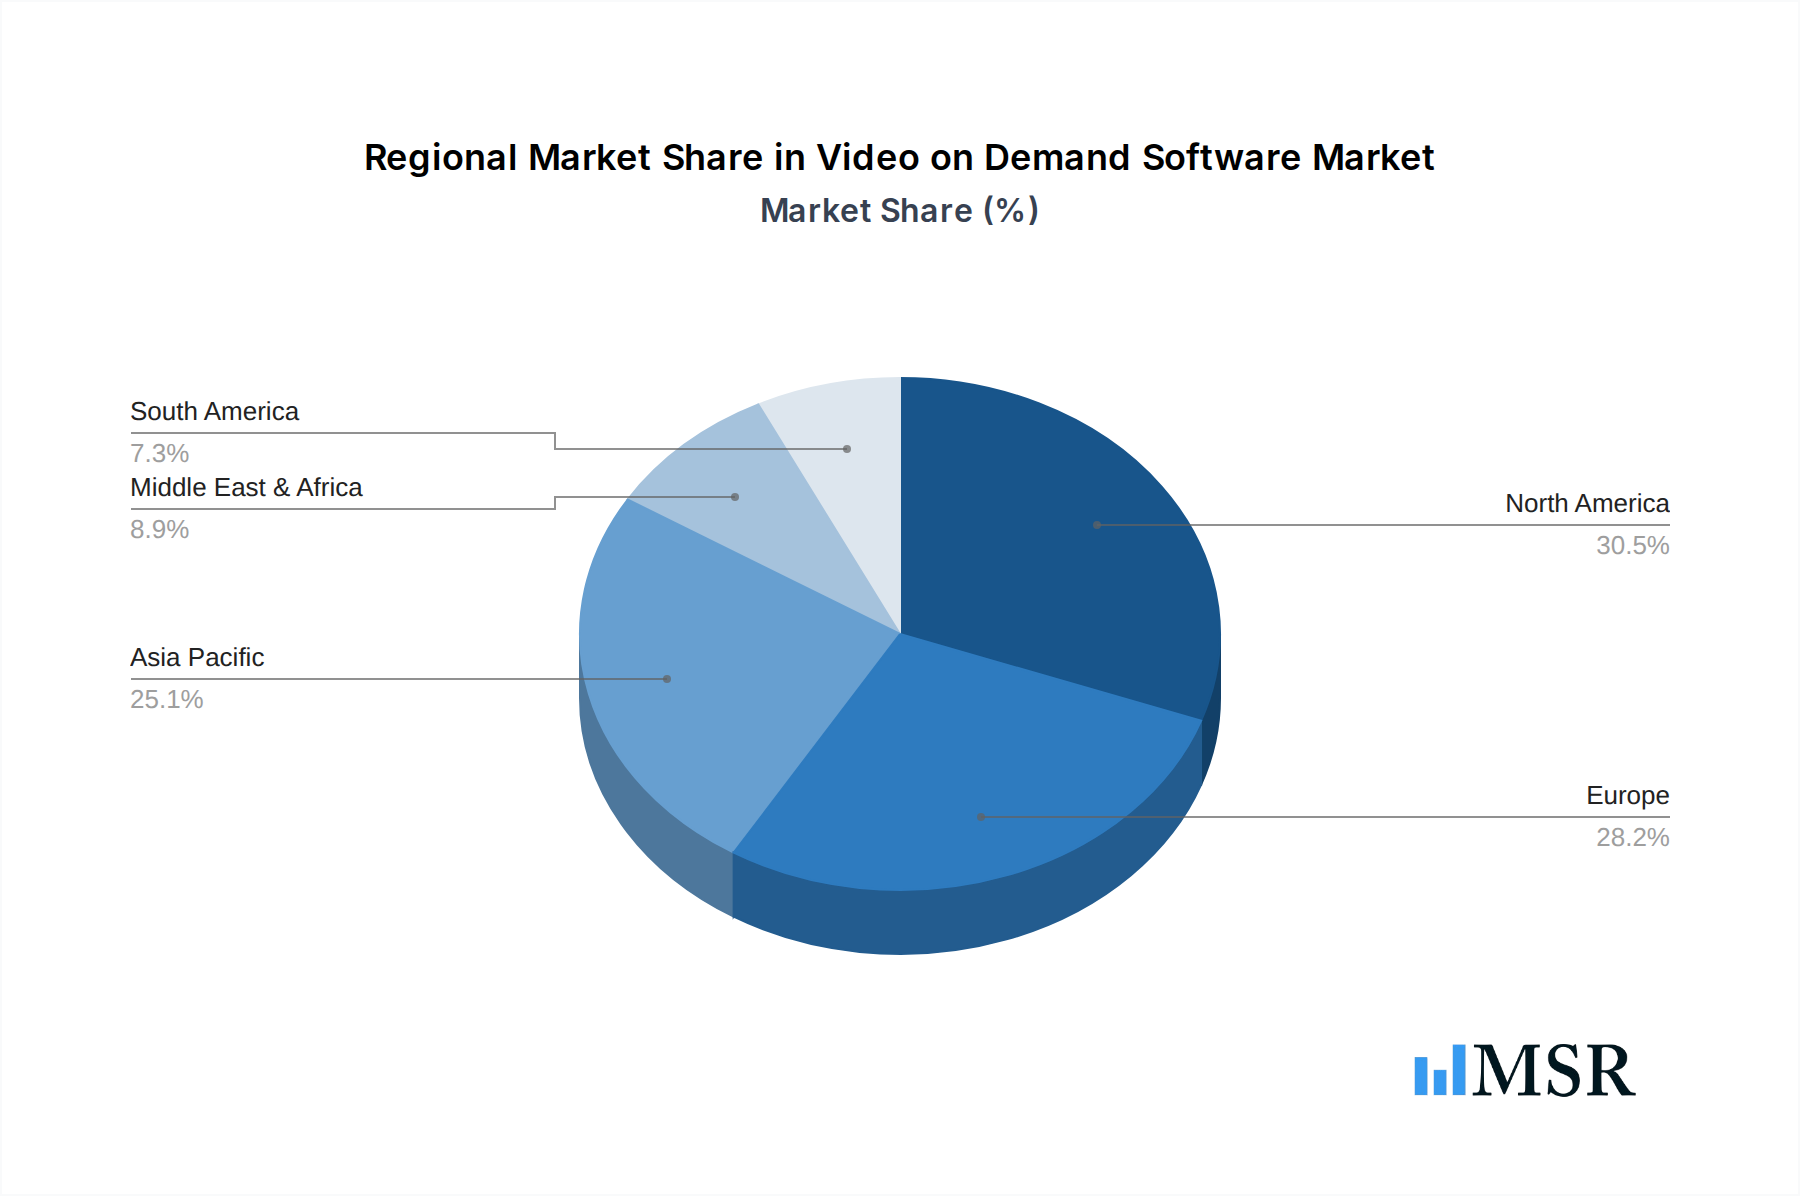
Video on Demand Software Regional Market Share
Geographic Coverage of Video on Demand Software
Video on Demand Software REPORT HIGHLIGHTS
| Aspects | Details |
|---|---|
| Study Period | 2020-2034 |
| Base Year | 2025 |
| Estimated Year | 2026 |
| Forecast Period | 2026-2034 |
| Historical Period | 2020-2025 |
| Growth Rate | CAGR of 16.4% from 2020-2034 |
| Segmentation |
|
Table of Contents
- 1. Introduction
- 1.1. Research Scope
- 1.2. Market Segmentation
- 1.3. Research Methodology
- 1.4. Definitions and Assumptions
- 2. Executive Summary
- 2.1. Introduction
- 3. Market Dynamics
- 3.1. Introduction
- 3.2. Market Drivers
- 3.3. Market Restrains
- 3.4. Market Trends
- 4. Market Factor Analysis
- 4.1. Porters Five Forces
- 4.2. Supply/Value Chain
- 4.3. PESTEL analysis
- 4.4. Market Entropy
- 4.5. Patent/Trademark Analysis
- 5. Global Video on Demand Software Analysis, Insights and Forecast, 2020-2032
- 5.1. Market Analysis, Insights and Forecast - by Application
- 5.1.1. Entertainment
- 5.1.2. Education and Training
- 5.1.3. Network Video Kiosks
- 5.1.4. Online Commerce
- 5.1.5. Digital Libraries
- 5.1.6. Others
- 5.2. Market Analysis, Insights and Forecast - by Types
- 5.2.1. Transactional Video on Demand (TVOD)
- 5.2.2. Subscription Video on Demand (SVOD)
- 5.2.3. Near-Video on Demand (NVOD)
- 5.2.4. Others
- 5.3. Market Analysis, Insights and Forecast - by Region
- 5.3.1. North America
- 5.3.2. South America
- 5.3.3. Europe
- 5.3.4. Middle East & Africa
- 5.3.5. Asia Pacific
- 5.1. Market Analysis, Insights and Forecast - by Application
- 6. North America Video on Demand Software Analysis, Insights and Forecast, 2020-2032
- 6.1. Market Analysis, Insights and Forecast - by Application
- 6.1.1. Entertainment
- 6.1.2. Education and Training
- 6.1.3. Network Video Kiosks
- 6.1.4. Online Commerce
- 6.1.5. Digital Libraries
- 6.1.6. Others
- 6.2. Market Analysis, Insights and Forecast - by Types
- 6.2.1. Transactional Video on Demand (TVOD)
- 6.2.2. Subscription Video on Demand (SVOD)
- 6.2.3. Near-Video on Demand (NVOD)
- 6.2.4. Others
- 6.1. Market Analysis, Insights and Forecast - by Application
- 7. South America Video on Demand Software Analysis, Insights and Forecast, 2020-2032
- 7.1. Market Analysis, Insights and Forecast - by Application
- 7.1.1. Entertainment
- 7.1.2. Education and Training
- 7.1.3. Network Video Kiosks
- 7.1.4. Online Commerce
- 7.1.5. Digital Libraries
- 7.1.6. Others
- 7.2. Market Analysis, Insights and Forecast - by Types
- 7.2.1. Transactional Video on Demand (TVOD)
- 7.2.2. Subscription Video on Demand (SVOD)
- 7.2.3. Near-Video on Demand (NVOD)
- 7.2.4. Others
- 7.1. Market Analysis, Insights and Forecast - by Application
- 8. Europe Video on Demand Software Analysis, Insights and Forecast, 2020-2032
- 8.1. Market Analysis, Insights and Forecast - by Application
- 8.1.1. Entertainment
- 8.1.2. Education and Training
- 8.1.3. Network Video Kiosks
- 8.1.4. Online Commerce
- 8.1.5. Digital Libraries
- 8.1.6. Others
- 8.2. Market Analysis, Insights and Forecast - by Types
- 8.2.1. Transactional Video on Demand (TVOD)
- 8.2.2. Subscription Video on Demand (SVOD)
- 8.2.3. Near-Video on Demand (NVOD)
- 8.2.4. Others
- 8.1. Market Analysis, Insights and Forecast - by Application
- 9. Middle East & Africa Video on Demand Software Analysis, Insights and Forecast, 2020-2032
- 9.1. Market Analysis, Insights and Forecast - by Application
- 9.1.1. Entertainment
- 9.1.2. Education and Training
- 9.1.3. Network Video Kiosks
- 9.1.4. Online Commerce
- 9.1.5. Digital Libraries
- 9.1.6. Others
- 9.2. Market Analysis, Insights and Forecast - by Types
- 9.2.1. Transactional Video on Demand (TVOD)
- 9.2.2. Subscription Video on Demand (SVOD)
- 9.2.3. Near-Video on Demand (NVOD)
- 9.2.4. Others
- 9.1. Market Analysis, Insights and Forecast - by Application
- 10. Asia Pacific Video on Demand Software Analysis, Insights and Forecast, 2020-2032
- 10.1. Market Analysis, Insights and Forecast - by Application
- 10.1.1. Entertainment
- 10.1.2. Education and Training
- 10.1.3. Network Video Kiosks
- 10.1.4. Online Commerce
- 10.1.5. Digital Libraries
- 10.1.6. Others
- 10.2. Market Analysis, Insights and Forecast - by Types
- 10.2.1. Transactional Video on Demand (TVOD)
- 10.2.2. Subscription Video on Demand (SVOD)
- 10.2.3. Near-Video on Demand (NVOD)
- 10.2.4. Others
- 10.1. Market Analysis, Insights and Forecast - by Application
- 11. Competitive Analysis
- 11.1. Global Market Share Analysis 2025
- 11.2. Company Profiles
- 11.2.1 IBM
- 11.2.1.1. Overview
- 11.2.1.2. Products
- 11.2.1.3. SWOT Analysis
- 11.2.1.4. Recent Developments
- 11.2.1.5. Financials (Based on Availability)
- 11.2.2 SAP
- 11.2.2.1. Overview
- 11.2.2.2. Products
- 11.2.2.3. SWOT Analysis
- 11.2.2.4. Recent Developments
- 11.2.2.5. Financials (Based on Availability)
- 11.2.3 Adobe
- 11.2.3.1. Overview
- 11.2.3.2. Products
- 11.2.3.3. SWOT Analysis
- 11.2.3.4. Recent Developments
- 11.2.3.5. Financials (Based on Availability)
- 11.2.4 Microsoft
- 11.2.4.1. Overview
- 11.2.4.2. Products
- 11.2.4.3. SWOT Analysis
- 11.2.4.4. Recent Developments
- 11.2.4.5. Financials (Based on Availability)
- 11.2.5 Apple
- 11.2.5.1. Overview
- 11.2.5.2. Products
- 11.2.5.3. SWOT Analysis
- 11.2.5.4. Recent Developments
- 11.2.5.5. Financials (Based on Availability)
- 11.2.6 Google
- 11.2.6.1. Overview
- 11.2.6.2. Products
- 11.2.6.3. SWOT Analysis
- 11.2.6.4. Recent Developments
- 11.2.6.5. Financials (Based on Availability)
- 11.2.7 Lightbox
- 11.2.7.1. Overview
- 11.2.7.2. Products
- 11.2.7.3. SWOT Analysis
- 11.2.7.4. Recent Developments
- 11.2.7.5. Financials (Based on Availability)
- 11.2.8 Fujitsu
- 11.2.8.1. Overview
- 11.2.8.2. Products
- 11.2.8.3. SWOT Analysis
- 11.2.8.4. Recent Developments
- 11.2.8.5. Financials (Based on Availability)
- 11.2.9 ZTE
- 11.2.9.1. Overview
- 11.2.9.2. Products
- 11.2.9.3. SWOT Analysis
- 11.2.9.4. Recent Developments
- 11.2.9.5. Financials (Based on Availability)
- 11.2.10 Huawei Technologies
- 11.2.10.1. Overview
- 11.2.10.2. Products
- 11.2.10.3. SWOT Analysis
- 11.2.10.4. Recent Developments
- 11.2.10.5. Financials (Based on Availability)
- 11.2.11 Akamai Technologies
- 11.2.11.1. Overview
- 11.2.11.2. Products
- 11.2.11.3. SWOT Analysis
- 11.2.11.4. Recent Developments
- 11.2.11.5. Financials (Based on Availability)
- 11.2.12 Avaya
- 11.2.12.1. Overview
- 11.2.12.2. Products
- 11.2.12.3. SWOT Analysis
- 11.2.12.4. Recent Developments
- 11.2.12.5. Financials (Based on Availability)
- 11.2.13 Level 3 Communications
- 11.2.13.1. Overview
- 11.2.13.2. Products
- 11.2.13.3. SWOT Analysis
- 11.2.13.4. Recent Developments
- 11.2.13.5. Financials (Based on Availability)
- 11.2.14 AT&T
- 11.2.14.1. Overview
- 11.2.14.2. Products
- 11.2.14.3. SWOT Analysis
- 11.2.14.4. Recent Developments
- 11.2.14.5. Financials (Based on Availability)
- 11.2.15 Cisco
- 11.2.15.1. Overview
- 11.2.15.2. Products
- 11.2.15.3. SWOT Analysis
- 11.2.15.4. Recent Developments
- 11.2.15.5. Financials (Based on Availability)
- 11.2.16 Ericsson Television
- 11.2.16.1. Overview
- 11.2.16.2. Products
- 11.2.16.3. SWOT Analysis
- 11.2.16.4. Recent Developments
- 11.2.16.5. Financials (Based on Availability)
- 11.2.1 IBM
List of Figures
- Figure 1: Global Video on Demand Software Revenue Breakdown (undefined, %) by Region 2025 & 2033
- Figure 2: North America Video on Demand Software Revenue (undefined), by Application 2025 & 2033
- Figure 3: North America Video on Demand Software Revenue Share (%), by Application 2025 & 2033
- Figure 4: North America Video on Demand Software Revenue (undefined), by Types 2025 & 2033
- Figure 5: North America Video on Demand Software Revenue Share (%), by Types 2025 & 2033
- Figure 6: North America Video on Demand Software Revenue (undefined), by Country 2025 & 2033
- Figure 7: North America Video on Demand Software Revenue Share (%), by Country 2025 & 2033
- Figure 8: South America Video on Demand Software Revenue (undefined), by Application 2025 & 2033
- Figure 9: South America Video on Demand Software Revenue Share (%), by Application 2025 & 2033
- Figure 10: South America Video on Demand Software Revenue (undefined), by Types 2025 & 2033
- Figure 11: South America Video on Demand Software Revenue Share (%), by Types 2025 & 2033
- Figure 12: South America Video on Demand Software Revenue (undefined), by Country 2025 & 2033
- Figure 13: South America Video on Demand Software Revenue Share (%), by Country 2025 & 2033
- Figure 14: Europe Video on Demand Software Revenue (undefined), by Application 2025 & 2033
- Figure 15: Europe Video on Demand Software Revenue Share (%), by Application 2025 & 2033
- Figure 16: Europe Video on Demand Software Revenue (undefined), by Types 2025 & 2033
- Figure 17: Europe Video on Demand Software Revenue Share (%), by Types 2025 & 2033
- Figure 18: Europe Video on Demand Software Revenue (undefined), by Country 2025 & 2033
- Figure 19: Europe Video on Demand Software Revenue Share (%), by Country 2025 & 2033
- Figure 20: Middle East & Africa Video on Demand Software Revenue (undefined), by Application 2025 & 2033
- Figure 21: Middle East & Africa Video on Demand Software Revenue Share (%), by Application 2025 & 2033
- Figure 22: Middle East & Africa Video on Demand Software Revenue (undefined), by Types 2025 & 2033
- Figure 23: Middle East & Africa Video on Demand Software Revenue Share (%), by Types 2025 & 2033
- Figure 24: Middle East & Africa Video on Demand Software Revenue (undefined), by Country 2025 & 2033
- Figure 25: Middle East & Africa Video on Demand Software Revenue Share (%), by Country 2025 & 2033
- Figure 26: Asia Pacific Video on Demand Software Revenue (undefined), by Application 2025 & 2033
- Figure 27: Asia Pacific Video on Demand Software Revenue Share (%), by Application 2025 & 2033
- Figure 28: Asia Pacific Video on Demand Software Revenue (undefined), by Types 2025 & 2033
- Figure 29: Asia Pacific Video on Demand Software Revenue Share (%), by Types 2025 & 2033
- Figure 30: Asia Pacific Video on Demand Software Revenue (undefined), by Country 2025 & 2033
- Figure 31: Asia Pacific Video on Demand Software Revenue Share (%), by Country 2025 & 2033
List of Tables
- Table 1: Global Video on Demand Software Revenue undefined Forecast, by Application 2020 & 2033
- Table 2: Global Video on Demand Software Revenue undefined Forecast, by Types 2020 & 2033
- Table 3: Global Video on Demand Software Revenue undefined Forecast, by Region 2020 & 2033
- Table 4: Global Video on Demand Software Revenue undefined Forecast, by Application 2020 & 2033
- Table 5: Global Video on Demand Software Revenue undefined Forecast, by Types 2020 & 2033
- Table 6: Global Video on Demand Software Revenue undefined Forecast, by Country 2020 & 2033
- Table 7: United States Video on Demand Software Revenue (undefined) Forecast, by Application 2020 & 2033
- Table 8: Canada Video on Demand Software Revenue (undefined) Forecast, by Application 2020 & 2033
- Table 9: Mexico Video on Demand Software Revenue (undefined) Forecast, by Application 2020 & 2033
- Table 10: Global Video on Demand Software Revenue undefined Forecast, by Application 2020 & 2033
- Table 11: Global Video on Demand Software Revenue undefined Forecast, by Types 2020 & 2033
- Table 12: Global Video on Demand Software Revenue undefined Forecast, by Country 2020 & 2033
- Table 13: Brazil Video on Demand Software Revenue (undefined) Forecast, by Application 2020 & 2033
- Table 14: Argentina Video on Demand Software Revenue (undefined) Forecast, by Application 2020 & 2033
- Table 15: Rest of South America Video on Demand Software Revenue (undefined) Forecast, by Application 2020 & 2033
- Table 16: Global Video on Demand Software Revenue undefined Forecast, by Application 2020 & 2033
- Table 17: Global Video on Demand Software Revenue undefined Forecast, by Types 2020 & 2033
- Table 18: Global Video on Demand Software Revenue undefined Forecast, by Country 2020 & 2033
- Table 19: United Kingdom Video on Demand Software Revenue (undefined) Forecast, by Application 2020 & 2033
- Table 20: Germany Video on Demand Software Revenue (undefined) Forecast, by Application 2020 & 2033
- Table 21: France Video on Demand Software Revenue (undefined) Forecast, by Application 2020 & 2033
- Table 22: Italy Video on Demand Software Revenue (undefined) Forecast, by Application 2020 & 2033
- Table 23: Spain Video on Demand Software Revenue (undefined) Forecast, by Application 2020 & 2033
- Table 24: Russia Video on Demand Software Revenue (undefined) Forecast, by Application 2020 & 2033
- Table 25: Benelux Video on Demand Software Revenue (undefined) Forecast, by Application 2020 & 2033
- Table 26: Nordics Video on Demand Software Revenue (undefined) Forecast, by Application 2020 & 2033
- Table 27: Rest of Europe Video on Demand Software Revenue (undefined) Forecast, by Application 2020 & 2033
- Table 28: Global Video on Demand Software Revenue undefined Forecast, by Application 2020 & 2033
- Table 29: Global Video on Demand Software Revenue undefined Forecast, by Types 2020 & 2033
- Table 30: Global Video on Demand Software Revenue undefined Forecast, by Country 2020 & 2033
- Table 31: Turkey Video on Demand Software Revenue (undefined) Forecast, by Application 2020 & 2033
- Table 32: Israel Video on Demand Software Revenue (undefined) Forecast, by Application 2020 & 2033
- Table 33: GCC Video on Demand Software Revenue (undefined) Forecast, by Application 2020 & 2033
- Table 34: North Africa Video on Demand Software Revenue (undefined) Forecast, by Application 2020 & 2033
- Table 35: South Africa Video on Demand Software Revenue (undefined) Forecast, by Application 2020 & 2033
- Table 36: Rest of Middle East & Africa Video on Demand Software Revenue (undefined) Forecast, by Application 2020 & 2033
- Table 37: Global Video on Demand Software Revenue undefined Forecast, by Application 2020 & 2033
- Table 38: Global Video on Demand Software Revenue undefined Forecast, by Types 2020 & 2033
- Table 39: Global Video on Demand Software Revenue undefined Forecast, by Country 2020 & 2033
- Table 40: China Video on Demand Software Revenue (undefined) Forecast, by Application 2020 & 2033
- Table 41: India Video on Demand Software Revenue (undefined) Forecast, by Application 2020 & 2033
- Table 42: Japan Video on Demand Software Revenue (undefined) Forecast, by Application 2020 & 2033
- Table 43: South Korea Video on Demand Software Revenue (undefined) Forecast, by Application 2020 & 2033
- Table 44: ASEAN Video on Demand Software Revenue (undefined) Forecast, by Application 2020 & 2033
- Table 45: Oceania Video on Demand Software Revenue (undefined) Forecast, by Application 2020 & 2033
- Table 46: Rest of Asia Pacific Video on Demand Software Revenue (undefined) Forecast, by Application 2020 & 2033
Frequently Asked Questions
1. What is the projected Compound Annual Growth Rate (CAGR) of the Video on Demand Software?
The projected CAGR is approximately 16.4%.
2. Which companies are prominent players in the Video on Demand Software?
Key companies in the market include IBM, SAP, Adobe, Microsoft, Apple, Google, Lightbox, Fujitsu, ZTE, Huawei Technologies, Akamai Technologies, Avaya, Level 3 Communications, AT&T, Cisco, Ericsson Television.
3. What are the main segments of the Video on Demand Software?
The market segments include Application, Types.
4. Can you provide details about the market size?
The market size is estimated to be USD XXX N/A as of 2022.
5. What are some drivers contributing to market growth?
N/A
6. What are the notable trends driving market growth?
N/A
7. Are there any restraints impacting market growth?
N/A
8. Can you provide examples of recent developments in the market?
N/A
9. What pricing options are available for accessing the report?
Pricing options include single-user, multi-user, and enterprise licenses priced at USD 3950.00, USD 5925.00, and USD 7900.00 respectively.
10. Is the market size provided in terms of value or volume?
The market size is provided in terms of value, measured in N/A.
11. Are there any specific market keywords associated with the report?
Yes, the market keyword associated with the report is "Video on Demand Software," which aids in identifying and referencing the specific market segment covered.
12. How do I determine which pricing option suits my needs best?
The pricing options vary based on user requirements and access needs. Individual users may opt for single-user licenses, while businesses requiring broader access may choose multi-user or enterprise licenses for cost-effective access to the report.
13. Are there any additional resources or data provided in the Video on Demand Software report?
While the report offers comprehensive insights, it's advisable to review the specific contents or supplementary materials provided to ascertain if additional resources or data are available.
14. How can I stay updated on further developments or reports in the Video on Demand Software?
To stay informed about further developments, trends, and reports in the Video on Demand Software, consider subscribing to industry newsletters, following relevant companies and organizations, or regularly checking reputable industry news sources and publications.
Methodology
Step 1 - Identification of Relevant Samples Size from Population Database


Step 2 - Approaches for Defining Global Market Size (Value, Volume* & Price*)

Note*: In applicable scenarios
Step 3 - Data Sources
Primary Research
- Web Analytics
- Survey Reports
- Research Institute
- Latest Research Reports
- Opinion Leaders
Secondary Research
- Annual Reports
- White Paper
- Latest Press Release
- Industry Association
- Paid Database
- Investor Presentations

Step 4 - Data Triangulation
Involves using different sources of information in order to increase the validity of a study
These sources are likely to be stakeholders in a program - participants, other researchers, program staff, other community members, and so on.
Then we put all data in single framework & apply various statistical tools to find out the dynamic on the market.
During the analysis stage, feedback from the stakeholder groups would be compared to determine areas of agreement as well as areas of divergence