

Key Insights
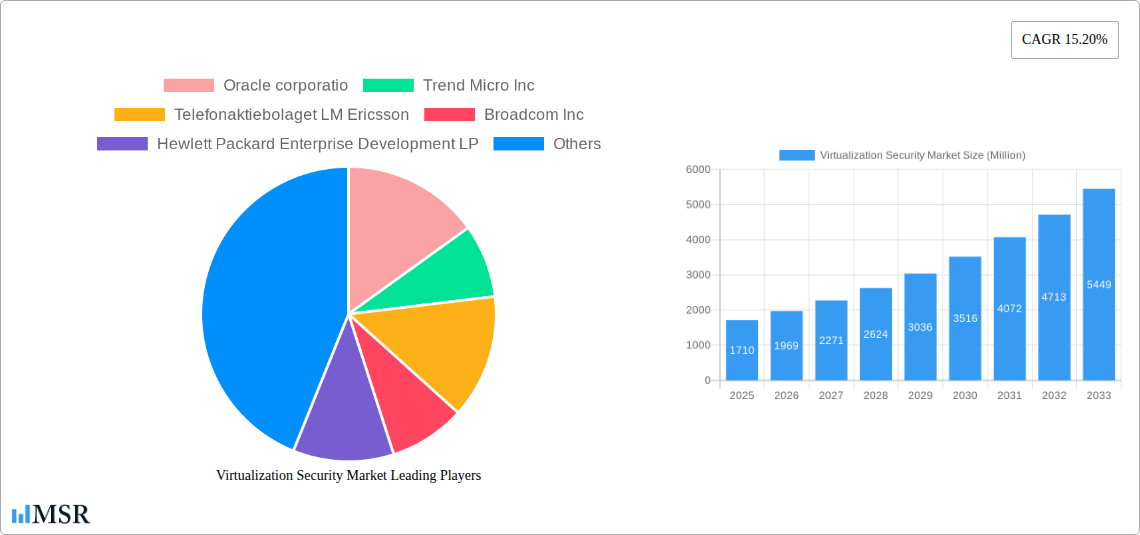
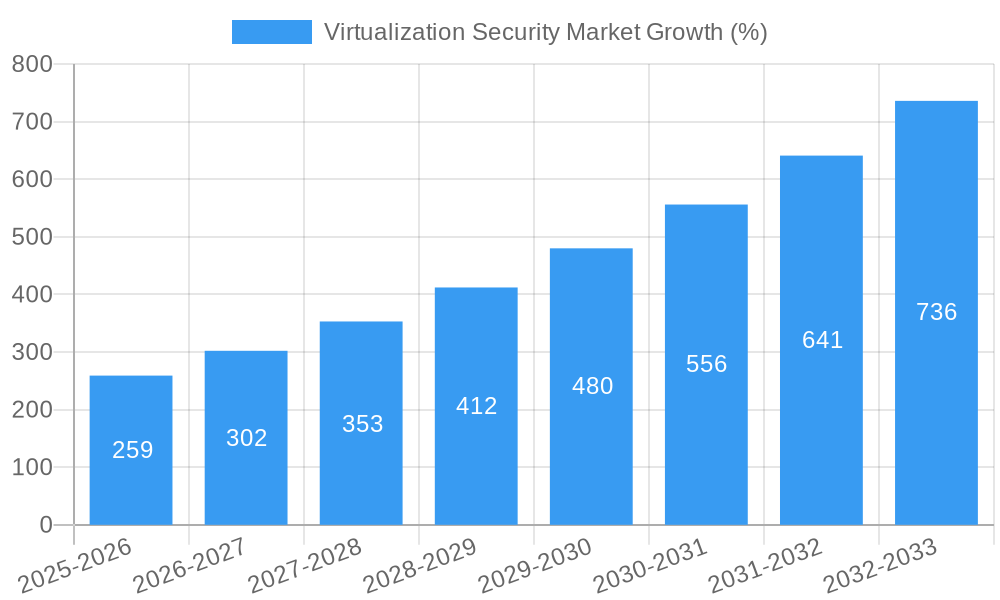
The virtualization security market, currently valued at $1.71 billion in 2025, is experiencing robust growth, projected to expand at a Compound Annual Growth Rate (CAGR) of 15.20% from 2025 to 2033. This significant expansion is driven by the increasing adoption of virtualization technologies across diverse sectors, including IT & Telecom, data centers, and cloud service providers. The rising need to protect virtualized environments from cyber threats, including ransomware, malware, and data breaches, is a primary catalyst. Hardware virtualization, offering enhanced security at the infrastructure level, currently holds a larger market share compared to application virtualization, which focuses on securing individual applications. However, the increasing complexity of application environments is fueling growth in the application virtualization security segment. Geographic growth is expected to be diverse, with North America and Europe maintaining strong market presence due to advanced IT infrastructure and stringent data protection regulations. Asia-Pacific is anticipated to witness significant growth fueled by increasing digitalization and cloud adoption. Key players like VMware, Oracle, and others are driving innovation through advanced security solutions, including micro-segmentation, network access control, and vulnerability management. Competitive pressures will continue to drive innovation and potentially lead to mergers and acquisitions within the market. The restraining factors include the complexity of implementing and managing virtualization security solutions and the associated costs. However, the long-term benefits in terms of enhanced security posture and operational efficiency are expected to outweigh these concerns.
The forecast period (2025-2033) promises continued expansion for the virtualization security market, driven by advancements in cloud-native security, increased adoption of containerization technologies, and the growing demand for integrated security solutions. As businesses continue to migrate to cloud environments and adopt DevOps methodologies, the need for robust and scalable security solutions will only intensify. The market will witness further segmentation based on specific security functionalities, such as intrusion detection and prevention, data loss prevention, and security information and event management (SIEM). The continued evolution of cyber threats will necessitate constant innovation in security solutions, driving further market growth and the development of specialized products and services tailored to addressing the unique challenges presented by each virtualization technology.
Virtualization Security Market: A Comprehensive Report (2019-2033)
This in-depth report provides a comprehensive analysis of the Virtualization Security Market, offering valuable insights for industry stakeholders, investors, and businesses seeking to navigate this dynamic landscape. The study period covers 2019-2033, with 2025 as the base and estimated year, and a forecast period of 2025-2033. The historical period analyzed is 2019-2024. The market is projected to reach xx Million by 2033, exhibiting a CAGR of xx% during the forecast period. This report delves into market dynamics, key segments, leading players (including Oracle Corporation, Trend Micro Inc, Telefonaktiebolaget LM Ericsson, Broadcom Inc, Hewlett Packard Enterprise Development LP, Dell Inc, Altor Networks, and VMware Inc), and emerging opportunities, providing actionable intelligence to inform strategic decision-making.
Virtualization Security Market Market Concentration & Dynamics
The Virtualization Security Market exhibits a moderately concentrated landscape, with a few major players holding significant market share. Market concentration is influenced by factors such as technological advancements, regulatory changes, and mergers and acquisitions (M&A) activities. The report analyzes the competitive intensity, identifying key players and their market share percentages. For example, VMware and other large players may hold over xx% of the market. Innovation ecosystems play a crucial role, with continuous advancements in virtualization technologies driving market growth. Regulatory frameworks, such as GDPR and CCPA, impact data security practices and influence market dynamics. The presence of substitute products, such as traditional security solutions, also influences market competitiveness. End-user trends towards cloud adoption and digital transformation are key drivers of market demand. M&A activity in the sector is relatively high, with several significant acquisitions driving consolidation. The report provides detailed analysis of M&A trends, including the number of deals and their impact on market concentration.
- Market Share: VMware, xx%; Oracle, xx%; others, xx%.
- M&A Deal Count (2019-2024): xx deals.
- Key Factors Influencing Concentration: Technological innovation, regulatory compliance, M&A activity.
Virtualization Security Market Industry Insights & Trends
The Virtualization Security Market is experiencing significant growth driven by the increasing adoption of cloud computing, virtualization technologies, and the rising need for robust cybersecurity solutions. The market size was valued at xx Million in 2024 and is projected to reach xx Million by 2033. This growth is fueled by several factors, including the rising adoption of cloud-based services, the increasing prevalence of cyber threats, and the growing need for secure virtualization environments. Technological advancements, such as AI-powered security solutions and improved threat detection capabilities, further enhance market growth. Evolving consumer behavior, with an increasing preference for secure and reliable digital services, significantly impacts market demand. The report also examines technological disruptions, such as the emergence of serverless computing and edge computing, which are reshaping the virtualization security landscape. The shift towards digital transformation initiatives across various industries is further propelling market growth. The report incorporates a detailed analysis of these factors, using real-world examples and quantifiable metrics to support the analysis.
Key Markets & Segments Leading Virtualization Security Market
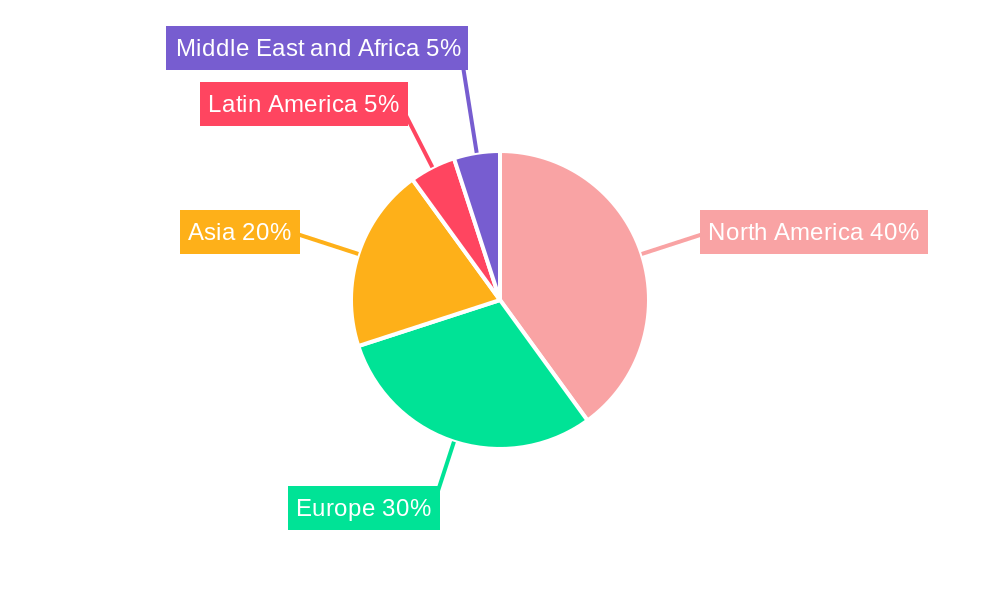
The North American region currently holds the largest market share, driven by robust IT infrastructure, high adoption rates of cloud services, and a strong focus on cybersecurity. However, the Asia Pacific region is projected to witness the fastest growth rate due to rapid economic development, increasing digitalization, and government initiatives promoting technology adoption.
By Type:
- Hardware Virtualization: This segment dominates the market due to its widespread adoption in data centers and enterprise IT environments. Key drivers include cost optimization, improved resource utilization, and enhanced scalability.
- Application Virtualization: This segment is witnessing significant growth driven by increased adoption of cloud-based applications and the need for enhanced application security.
By End-user Application:
- Data Center: This segment is a significant contributor to market growth, driven by the need to secure critical data and infrastructure.
- Cloud Service Providers: This segment shows significant growth potential driven by the rising adoption of cloud-based services and the inherent security risks associated with cloud environments.
- IT & Telecom: The IT and Telecom segment benefits from strong demand for secure network infrastructure and data protection.
Drivers:
- Economic growth: Increased spending on IT infrastructure in developing economies fuels market growth.
- Government initiatives: Investment in digital infrastructure and cybersecurity regulations drive market adoption.
- Technological advancements: The development of new security solutions and improved virtualization technologies expands market potential.
Virtualization Security Market Product Developments
The virtualization security market is witnessing rapid innovation, with the introduction of AI-powered security solutions, advanced threat detection systems, and improved encryption technologies. These advancements enhance the security of virtualized environments, offering better protection against cyber threats. The development of integrated security solutions that seamlessly integrate with virtualization platforms is also a key trend, simplifying security management and improving efficiency. These product innovations are driving market growth and providing competitive edges for leading players.
Challenges in the Virtualization Security Market Market
The Virtualization Security Market faces several challenges, including increasing regulatory compliance requirements, which can lead to significant costs and complexity. Supply chain disruptions can impact the availability of critical components and services, hindering market growth. Intense competition from existing players and new entrants puts pressure on profit margins. For instance, the cost of compliance with GDPR and CCPA is estimated to negatively impact market growth by approximately xx% in the next few years.
Forces Driving Virtualization Security Market Growth
Several factors contribute to the growth of the Virtualization Security Market. Firstly, increased adoption of cloud computing and virtualization technologies drives demand for enhanced security solutions. Secondly, rising cyber threats and data breaches necessitate robust security measures. Thirdly, stringent government regulations regarding data protection compel organizations to invest in advanced security systems. For example, the increasing prevalence of ransomware attacks is a significant driver for market growth.
Challenges in the Virtualization Security Market Market
Long-term growth in the Virtualization Security Market hinges on ongoing innovation in security technologies, strategic partnerships to improve solutions, and market expansion into new geographical regions. The development of AI-driven security solutions and the integration of virtualization and security tools are vital for sustaining long-term growth.
Emerging Opportunities in Virtualization Security Market
Emerging opportunities exist in the development of specialized security solutions for specific virtualization platforms, expansion into emerging markets with high growth potential, and increased integration of security solutions with IoT devices. The growing demand for secure multi-cloud environments is also driving market growth and creating new business opportunities.
Leading Players in the Virtualization Security Market Sector
- Oracle Corporation
- Trend Micro Inc
- Telefonaktiebolaget LM Ericsson
- Broadcom Inc
- Hewlett Packard Enterprise Development LP
- Dell Inc
- Altor Networks
- VMware Inc
Key Milestones in Virtualization Security Market Industry
- August 2023: Lenovo and VMware's expanded partnership introduces NVIDIA-powered generative AI and multi-cloud solutions, impacting the market by offering hybrid multi-cloud capabilities and boosting data utilization for intelligent transformation.
- March 2023: Hewlett Packard Enterprise's acquisition of Axis Security strengthens network security, offering integrated networking and security solutions as a service, thus increasing the demand for secure service edge solutions.
Strategic Outlook for Virtualization Security Market Market
The Virtualization Security Market holds significant future potential, driven by the continued growth of cloud computing, increased adoption of virtualization technologies, and the persistent threat of cyberattacks. Strategic opportunities include developing advanced security solutions leveraging AI and machine learning, focusing on securing multi-cloud environments, and expanding into emerging markets. Companies that can offer innovative, integrated, and cost-effective security solutions will be well-positioned for success in this dynamic market.
Virtualization Security Market Segmentation
-
1. Type
- 1.1. Hardware Virtualization
- 1.2. Application Virtualization
-
2. End-user Application
- 2.1. IT & Telecom
- 2.2. Data Center
- 2.3. Cloud Service Providers
Virtualization Security Market Segmentation By Geography
-
1. North America
- 1.1. United States
- 1.2. Canada
-
2. Europe
- 2.1. United Kingdom
- 2.2. Germany
- 2.3. France
-
3. Asia
- 3.1. China
- 3.2. Japan
- 4. Australia and New Zealand
-
5. Latin America
- 5.1. Mexico
- 5.2. Brazil
- 6. Middle East and Africa
Virtualization Security Market REPORT HIGHLIGHTS
| Aspects | Details |
|---|---|
| Study Period | 2019-2033 |
| Base Year | 2024 |
| Estimated Year | 2025 |
| Forecast Period | 2025-2033 |
| Historical Period | 2019-2024 |
| Growth Rate | CAGR of 15.20% from 2019-2033 |
| Segmentation |
|
Table of Contents
- 1. Introduction
- 1.1. Research Scope
- 1.2. Market Segmentation
- 1.3. Research Methodology
- 1.4. Definitions and Assumptions
- 2. Executive Summary
- 2.1. Introduction
- 3. Market Dynamics
- 3.1. Introduction
- 3.2. Market Drivers
- 3.2.1. Rapid Increase in Data Generated to Witness the Growth
- 3.3. Market Restrains
- 3.3.1. High Up-front Costs Involved
- 3.4. Market Trends
- 3.4.1. IT & Telecom is Expected to Hold a Major Market Share
- 4. Market Factor Analysis
- 4.1. Porters Five Forces
- 4.2. Supply/Value Chain
- 4.3. PESTEL analysis
- 4.4. Market Entropy
- 4.5. Patent/Trademark Analysis
- 5. Global Virtualization Security Market Analysis, Insights and Forecast, 2019-2031
- 5.1. Market Analysis, Insights and Forecast - by Type
- 5.1.1. Hardware Virtualization
- 5.1.2. Application Virtualization
- 5.2. Market Analysis, Insights and Forecast - by End-user Application
- 5.2.1. IT & Telecom
- 5.2.2. Data Center
- 5.2.3. Cloud Service Providers
- 5.3. Market Analysis, Insights and Forecast - by Region
- 5.3.1. North America
- 5.3.2. Europe
- 5.3.3. Asia
- 5.3.4. Australia and New Zealand
- 5.3.5. Latin America
- 5.3.6. Middle East and Africa
- 5.1. Market Analysis, Insights and Forecast - by Type
- 6. North America Virtualization Security Market Analysis, Insights and Forecast, 2019-2031
- 6.1. Market Analysis, Insights and Forecast - by Type
- 6.1.1. Hardware Virtualization
- 6.1.2. Application Virtualization
- 6.2. Market Analysis, Insights and Forecast - by End-user Application
- 6.2.1. IT & Telecom
- 6.2.2. Data Center
- 6.2.3. Cloud Service Providers
- 6.1. Market Analysis, Insights and Forecast - by Type
- 7. Europe Virtualization Security Market Analysis, Insights and Forecast, 2019-2031
- 7.1. Market Analysis, Insights and Forecast - by Type
- 7.1.1. Hardware Virtualization
- 7.1.2. Application Virtualization
- 7.2. Market Analysis, Insights and Forecast - by End-user Application
- 7.2.1. IT & Telecom
- 7.2.2. Data Center
- 7.2.3. Cloud Service Providers
- 7.1. Market Analysis, Insights and Forecast - by Type
- 8. Asia Virtualization Security Market Analysis, Insights and Forecast, 2019-2031
- 8.1. Market Analysis, Insights and Forecast - by Type
- 8.1.1. Hardware Virtualization
- 8.1.2. Application Virtualization
- 8.2. Market Analysis, Insights and Forecast - by End-user Application
- 8.2.1. IT & Telecom
- 8.2.2. Data Center
- 8.2.3. Cloud Service Providers
- 8.1. Market Analysis, Insights and Forecast - by Type
- 9. Australia and New Zealand Virtualization Security Market Analysis, Insights and Forecast, 2019-2031
- 9.1. Market Analysis, Insights and Forecast - by Type
- 9.1.1. Hardware Virtualization
- 9.1.2. Application Virtualization
- 9.2. Market Analysis, Insights and Forecast - by End-user Application
- 9.2.1. IT & Telecom
- 9.2.2. Data Center
- 9.2.3. Cloud Service Providers
- 9.1. Market Analysis, Insights and Forecast - by Type
- 10. Latin America Virtualization Security Market Analysis, Insights and Forecast, 2019-2031
- 10.1. Market Analysis, Insights and Forecast - by Type
- 10.1.1. Hardware Virtualization
- 10.1.2. Application Virtualization
- 10.2. Market Analysis, Insights and Forecast - by End-user Application
- 10.2.1. IT & Telecom
- 10.2.2. Data Center
- 10.2.3. Cloud Service Providers
- 10.1. Market Analysis, Insights and Forecast - by Type
- 11. Middle East and Africa Virtualization Security Market Analysis, Insights and Forecast, 2019-2031
- 11.1. Market Analysis, Insights and Forecast - by Type
- 11.1.1. Hardware Virtualization
- 11.1.2. Application Virtualization
- 11.2. Market Analysis, Insights and Forecast - by End-user Application
- 11.2.1. IT & Telecom
- 11.2.2. Data Center
- 11.2.3. Cloud Service Providers
- 11.1. Market Analysis, Insights and Forecast - by Type
- 12. North America Virtualization Security Market Analysis, Insights and Forecast, 2019-2031
- 12.1. Market Analysis, Insights and Forecast - By Country/Sub-region
- 12.1.1 United States
- 12.1.2 Canada
- 13. Europe Virtualization Security Market Analysis, Insights and Forecast, 2019-2031
- 13.1. Market Analysis, Insights and Forecast - By Country/Sub-region
- 13.1.1 United Kingdom
- 13.1.2 Germany
- 13.1.3 France
- 14. Asia Virtualization Security Market Analysis, Insights and Forecast, 2019-2031
- 14.1. Market Analysis, Insights and Forecast - By Country/Sub-region
- 14.1.1 China
- 14.1.2 Japan
- 14.1.3 Australia
- 15. Latin America Virtualization Security Market Analysis, Insights and Forecast, 2019-2031
- 15.1. Market Analysis, Insights and Forecast - By Country/Sub-region
- 15.1.1 Mexico
- 15.1.2 Brazil
- 16. Middle East and Africa Virtualization Security Market Analysis, Insights and Forecast, 2019-2031
- 16.1. Market Analysis, Insights and Forecast - By Country/Sub-region
- 16.1.1.
- 17. Competitive Analysis
- 17.1. Global Market Share Analysis 2024
- 17.2. Company Profiles
- 17.2.1 Oracle corporatio
- 17.2.1.1. Overview
- 17.2.1.2. Products
- 17.2.1.3. SWOT Analysis
- 17.2.1.4. Recent Developments
- 17.2.1.5. Financials (Based on Availability)
- 17.2.2 Trend Micro Inc
- 17.2.2.1. Overview
- 17.2.2.2. Products
- 17.2.2.3. SWOT Analysis
- 17.2.2.4. Recent Developments
- 17.2.2.5. Financials (Based on Availability)
- 17.2.3 Telefonaktiebolaget LM Ericsson
- 17.2.3.1. Overview
- 17.2.3.2. Products
- 17.2.3.3. SWOT Analysis
- 17.2.3.4. Recent Developments
- 17.2.3.5. Financials (Based on Availability)
- 17.2.4 Broadcom Inc
- 17.2.4.1. Overview
- 17.2.4.2. Products
- 17.2.4.3. SWOT Analysis
- 17.2.4.4. Recent Developments
- 17.2.4.5. Financials (Based on Availability)
- 17.2.5 Hewlett Packard Enterprise Development LP
- 17.2.5.1. Overview
- 17.2.5.2. Products
- 17.2.5.3. SWOT Analysis
- 17.2.5.4. Recent Developments
- 17.2.5.5. Financials (Based on Availability)
- 17.2.6 Dell Inc
- 17.2.6.1. Overview
- 17.2.6.2. Products
- 17.2.6.3. SWOT Analysis
- 17.2.6.4. Recent Developments
- 17.2.6.5. Financials (Based on Availability)
- 17.2.7 Altor Networks
- 17.2.7.1. Overview
- 17.2.7.2. Products
- 17.2.7.3. SWOT Analysis
- 17.2.7.4. Recent Developments
- 17.2.7.5. Financials (Based on Availability)
- 17.2.8 VMware Inc
- 17.2.8.1. Overview
- 17.2.8.2. Products
- 17.2.8.3. SWOT Analysis
- 17.2.8.4. Recent Developments
- 17.2.8.5. Financials (Based on Availability)
- 17.2.1 Oracle corporatio
List of Figures
- Figure 1: Global Virtualization Security Market Revenue Breakdown (Million, %) by Region 2024 & 2032
- Figure 2: North America Virtualization Security Market Revenue (Million), by Country 2024 & 2032
- Figure 3: North America Virtualization Security Market Revenue Share (%), by Country 2024 & 2032
- Figure 4: Europe Virtualization Security Market Revenue (Million), by Country 2024 & 2032
- Figure 5: Europe Virtualization Security Market Revenue Share (%), by Country 2024 & 2032
- Figure 6: Asia Virtualization Security Market Revenue (Million), by Country 2024 & 2032
- Figure 7: Asia Virtualization Security Market Revenue Share (%), by Country 2024 & 2032
- Figure 8: Latin America Virtualization Security Market Revenue (Million), by Country 2024 & 2032
- Figure 9: Latin America Virtualization Security Market Revenue Share (%), by Country 2024 & 2032
- Figure 10: Middle East and Africa Virtualization Security Market Revenue (Million), by Country 2024 & 2032
- Figure 11: Middle East and Africa Virtualization Security Market Revenue Share (%), by Country 2024 & 2032
- Figure 12: North America Virtualization Security Market Revenue (Million), by Type 2024 & 2032
- Figure 13: North America Virtualization Security Market Revenue Share (%), by Type 2024 & 2032
- Figure 14: North America Virtualization Security Market Revenue (Million), by End-user Application 2024 & 2032
- Figure 15: North America Virtualization Security Market Revenue Share (%), by End-user Application 2024 & 2032
- Figure 16: North America Virtualization Security Market Revenue (Million), by Country 2024 & 2032
- Figure 17: North America Virtualization Security Market Revenue Share (%), by Country 2024 & 2032
- Figure 18: Europe Virtualization Security Market Revenue (Million), by Type 2024 & 2032
- Figure 19: Europe Virtualization Security Market Revenue Share (%), by Type 2024 & 2032
- Figure 20: Europe Virtualization Security Market Revenue (Million), by End-user Application 2024 & 2032
- Figure 21: Europe Virtualization Security Market Revenue Share (%), by End-user Application 2024 & 2032
- Figure 22: Europe Virtualization Security Market Revenue (Million), by Country 2024 & 2032
- Figure 23: Europe Virtualization Security Market Revenue Share (%), by Country 2024 & 2032
- Figure 24: Asia Virtualization Security Market Revenue (Million), by Type 2024 & 2032
- Figure 25: Asia Virtualization Security Market Revenue Share (%), by Type 2024 & 2032
- Figure 26: Asia Virtualization Security Market Revenue (Million), by End-user Application 2024 & 2032
- Figure 27: Asia Virtualization Security Market Revenue Share (%), by End-user Application 2024 & 2032
- Figure 28: Asia Virtualization Security Market Revenue (Million), by Country 2024 & 2032
- Figure 29: Asia Virtualization Security Market Revenue Share (%), by Country 2024 & 2032
- Figure 30: Australia and New Zealand Virtualization Security Market Revenue (Million), by Type 2024 & 2032
- Figure 31: Australia and New Zealand Virtualization Security Market Revenue Share (%), by Type 2024 & 2032
- Figure 32: Australia and New Zealand Virtualization Security Market Revenue (Million), by End-user Application 2024 & 2032
- Figure 33: Australia and New Zealand Virtualization Security Market Revenue Share (%), by End-user Application 2024 & 2032
- Figure 34: Australia and New Zealand Virtualization Security Market Revenue (Million), by Country 2024 & 2032
- Figure 35: Australia and New Zealand Virtualization Security Market Revenue Share (%), by Country 2024 & 2032
- Figure 36: Latin America Virtualization Security Market Revenue (Million), by Type 2024 & 2032
- Figure 37: Latin America Virtualization Security Market Revenue Share (%), by Type 2024 & 2032
- Figure 38: Latin America Virtualization Security Market Revenue (Million), by End-user Application 2024 & 2032
- Figure 39: Latin America Virtualization Security Market Revenue Share (%), by End-user Application 2024 & 2032
- Figure 40: Latin America Virtualization Security Market Revenue (Million), by Country 2024 & 2032
- Figure 41: Latin America Virtualization Security Market Revenue Share (%), by Country 2024 & 2032
- Figure 42: Middle East and Africa Virtualization Security Market Revenue (Million), by Type 2024 & 2032
- Figure 43: Middle East and Africa Virtualization Security Market Revenue Share (%), by Type 2024 & 2032
- Figure 44: Middle East and Africa Virtualization Security Market Revenue (Million), by End-user Application 2024 & 2032
- Figure 45: Middle East and Africa Virtualization Security Market Revenue Share (%), by End-user Application 2024 & 2032
- Figure 46: Middle East and Africa Virtualization Security Market Revenue (Million), by Country 2024 & 2032
- Figure 47: Middle East and Africa Virtualization Security Market Revenue Share (%), by Country 2024 & 2032
List of Tables
- Table 1: Global Virtualization Security Market Revenue Million Forecast, by Region 2019 & 2032
- Table 2: Global Virtualization Security Market Revenue Million Forecast, by Type 2019 & 2032
- Table 3: Global Virtualization Security Market Revenue Million Forecast, by End-user Application 2019 & 2032
- Table 4: Global Virtualization Security Market Revenue Million Forecast, by Region 2019 & 2032
- Table 5: Global Virtualization Security Market Revenue Million Forecast, by Country 2019 & 2032
- Table 6: United States Virtualization Security Market Revenue (Million) Forecast, by Application 2019 & 2032
- Table 7: Canada Virtualization Security Market Revenue (Million) Forecast, by Application 2019 & 2032
- Table 8: Global Virtualization Security Market Revenue Million Forecast, by Country 2019 & 2032
- Table 9: United Kingdom Virtualization Security Market Revenue (Million) Forecast, by Application 2019 & 2032
- Table 10: Germany Virtualization Security Market Revenue (Million) Forecast, by Application 2019 & 2032
- Table 11: France Virtualization Security Market Revenue (Million) Forecast, by Application 2019 & 2032
- Table 12: Global Virtualization Security Market Revenue Million Forecast, by Country 2019 & 2032
- Table 13: China Virtualization Security Market Revenue (Million) Forecast, by Application 2019 & 2032
- Table 14: Japan Virtualization Security Market Revenue (Million) Forecast, by Application 2019 & 2032
- Table 15: Australia Virtualization Security Market Revenue (Million) Forecast, by Application 2019 & 2032
- Table 16: Global Virtualization Security Market Revenue Million Forecast, by Country 2019 & 2032
- Table 17: Mexico Virtualization Security Market Revenue (Million) Forecast, by Application 2019 & 2032
- Table 18: Brazil Virtualization Security Market Revenue (Million) Forecast, by Application 2019 & 2032
- Table 19: Global Virtualization Security Market Revenue Million Forecast, by Country 2019 & 2032
- Table 20: Virtualization Security Market Revenue (Million) Forecast, by Application 2019 & 2032
- Table 21: Global Virtualization Security Market Revenue Million Forecast, by Type 2019 & 2032
- Table 22: Global Virtualization Security Market Revenue Million Forecast, by End-user Application 2019 & 2032
- Table 23: Global Virtualization Security Market Revenue Million Forecast, by Country 2019 & 2032
- Table 24: United States Virtualization Security Market Revenue (Million) Forecast, by Application 2019 & 2032
- Table 25: Canada Virtualization Security Market Revenue (Million) Forecast, by Application 2019 & 2032
- Table 26: Global Virtualization Security Market Revenue Million Forecast, by Type 2019 & 2032
- Table 27: Global Virtualization Security Market Revenue Million Forecast, by End-user Application 2019 & 2032
- Table 28: Global Virtualization Security Market Revenue Million Forecast, by Country 2019 & 2032
- Table 29: United Kingdom Virtualization Security Market Revenue (Million) Forecast, by Application 2019 & 2032
- Table 30: Germany Virtualization Security Market Revenue (Million) Forecast, by Application 2019 & 2032
- Table 31: France Virtualization Security Market Revenue (Million) Forecast, by Application 2019 & 2032
- Table 32: Global Virtualization Security Market Revenue Million Forecast, by Type 2019 & 2032
- Table 33: Global Virtualization Security Market Revenue Million Forecast, by End-user Application 2019 & 2032
- Table 34: Global Virtualization Security Market Revenue Million Forecast, by Country 2019 & 2032
- Table 35: China Virtualization Security Market Revenue (Million) Forecast, by Application 2019 & 2032
- Table 36: Japan Virtualization Security Market Revenue (Million) Forecast, by Application 2019 & 2032
- Table 37: Global Virtualization Security Market Revenue Million Forecast, by Type 2019 & 2032
- Table 38: Global Virtualization Security Market Revenue Million Forecast, by End-user Application 2019 & 2032
- Table 39: Global Virtualization Security Market Revenue Million Forecast, by Country 2019 & 2032
- Table 40: Global Virtualization Security Market Revenue Million Forecast, by Type 2019 & 2032
- Table 41: Global Virtualization Security Market Revenue Million Forecast, by End-user Application 2019 & 2032
- Table 42: Global Virtualization Security Market Revenue Million Forecast, by Country 2019 & 2032
- Table 43: Mexico Virtualization Security Market Revenue (Million) Forecast, by Application 2019 & 2032
- Table 44: Brazil Virtualization Security Market Revenue (Million) Forecast, by Application 2019 & 2032
- Table 45: Global Virtualization Security Market Revenue Million Forecast, by Type 2019 & 2032
- Table 46: Global Virtualization Security Market Revenue Million Forecast, by End-user Application 2019 & 2032
- Table 47: Global Virtualization Security Market Revenue Million Forecast, by Country 2019 & 2032
Frequently Asked Questions
1. What is the projected Compound Annual Growth Rate (CAGR) of the Virtualization Security Market?
The projected CAGR is approximately 15.20%.
2. Which companies are prominent players in the Virtualization Security Market?
Key companies in the market include Oracle corporatio, Trend Micro Inc, Telefonaktiebolaget LM Ericsson, Broadcom Inc, Hewlett Packard Enterprise Development LP, Dell Inc, Altor Networks, VMware Inc.
3. What are the main segments of the Virtualization Security Market?
The market segments include Type, End-user Application.
4. Can you provide details about the market size?
The market size is estimated to be USD 1.71 Million as of 2022.
5. What are some drivers contributing to market growth?
Rapid Increase in Data Generated to Witness the Growth.
6. What are the notable trends driving market growth?
IT & Telecom is Expected to Hold a Major Market Share.
7. Are there any restraints impacting market growth?
High Up-front Costs Involved.
8. Can you provide examples of recent developments in the market?
August 2023: Lenovo and VMware expanded their partnership to bring new NVIDIA-powered turnkey generative AI and multi-cloud solutions to every business. They will deliver modern hybrid multi-cloud capabilities to mid-size companies and help customers more easily harness data to empower their intelligent transformation.
9. What pricing options are available for accessing the report?
Pricing options include single-user, multi-user, and enterprise licenses priced at USD 4750, USD 5250, and USD 8750 respectively.
10. Is the market size provided in terms of value or volume?
The market size is provided in terms of value, measured in Million.
11. Are there any specific market keywords associated with the report?
Yes, the market keyword associated with the report is "Virtualization Security Market," which aids in identifying and referencing the specific market segment covered.
12. How do I determine which pricing option suits my needs best?
The pricing options vary based on user requirements and access needs. Individual users may opt for single-user licenses, while businesses requiring broader access may choose multi-user or enterprise licenses for cost-effective access to the report.
13. Are there any additional resources or data provided in the Virtualization Security Market report?
While the report offers comprehensive insights, it's advisable to review the specific contents or supplementary materials provided to ascertain if additional resources or data are available.
14. How can I stay updated on further developments or reports in the Virtualization Security Market?
To stay informed about further developments, trends, and reports in the Virtualization Security Market, consider subscribing to industry newsletters, following relevant companies and organizations, or regularly checking reputable industry news sources and publications.
Methodology
Step 1 - Identification of Relevant Samples Size from Population Database


Step 2 - Approaches for Defining Global Market Size (Value, Volume* & Price*)

Note*: In applicable scenarios
Step 3 - Data Sources
Primary Research
- Web Analytics
- Survey Reports
- Research Institute
- Latest Research Reports
- Opinion Leaders
Secondary Research
- Annual Reports
- White Paper
- Latest Press Release
- Industry Association
- Paid Database
- Investor Presentations

Step 4 - Data Triangulation
Involves using different sources of information in order to increase the validity of a study
These sources are likely to be stakeholders in a program - participants, other researchers, program staff, other community members, and so on.
Then we put all data in single framework & apply various statistical tools to find out the dynamic on the market.
During the analysis stage, feedback from the stakeholder groups would be compared to determine areas of agreement as well as areas of divergence
