

Key Insights
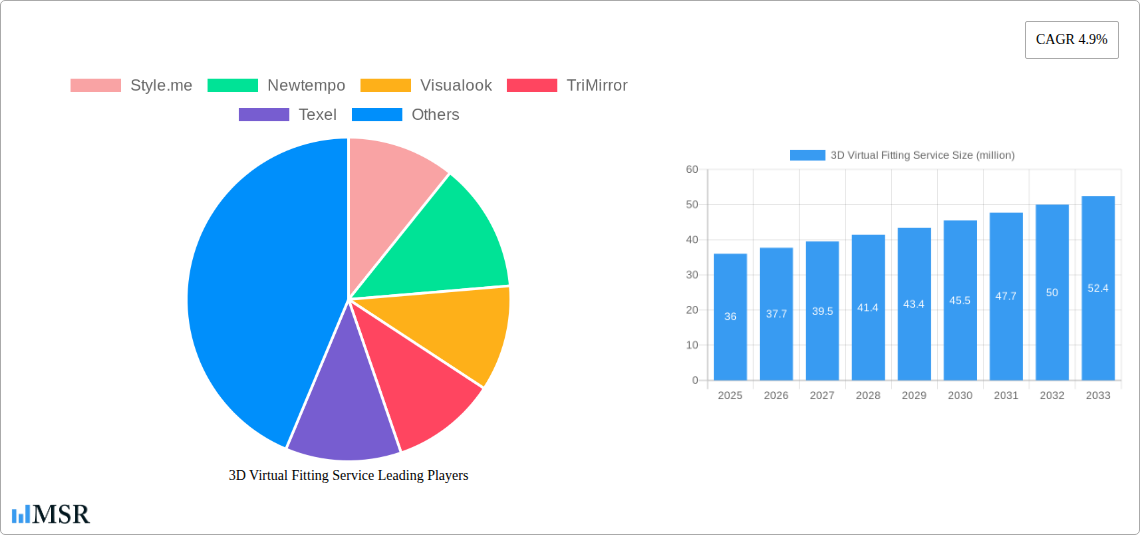
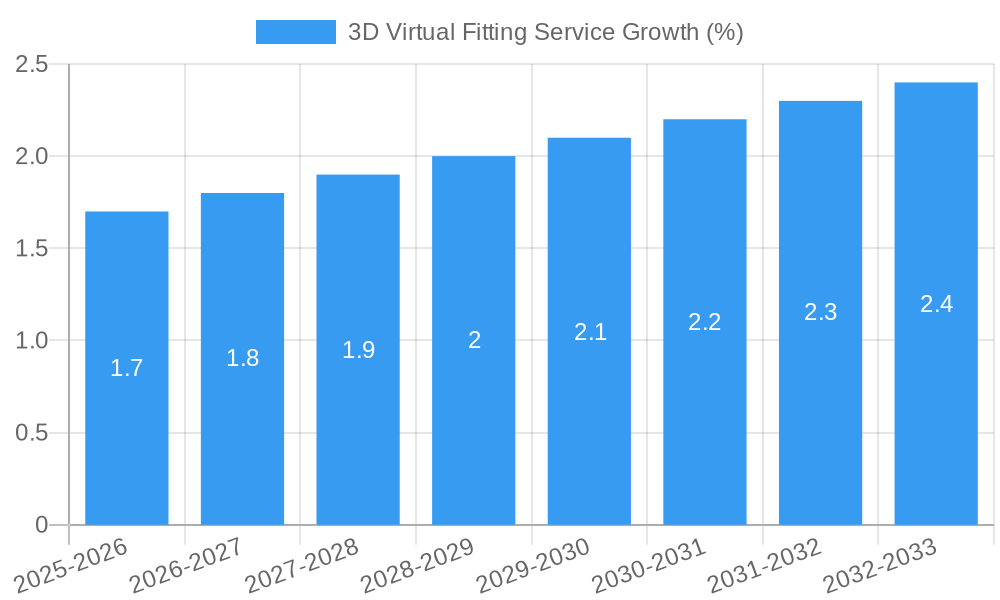
The global 3D virtual fitting service market, valued at $36 million in 2025, is projected to experience robust growth, driven by the increasing adoption of e-commerce and the rising demand for personalized shopping experiences. A Compound Annual Growth Rate (CAGR) of 4.9% from 2025 to 2033 indicates a significant expansion, reaching an estimated market size of approximately $55 million by 2033. This growth is fueled by several key factors. Firstly, the escalating popularity of online shopping necessitates innovative solutions to address the limitations of traditional fitting rooms. 3D virtual fitting technology provides a seamless and convenient alternative, allowing consumers to try on clothes virtually before purchasing, thereby minimizing returns and enhancing customer satisfaction. Secondly, advancements in augmented reality (AR) and artificial intelligence (AI) are continuously improving the accuracy and realism of virtual fitting experiences, making them increasingly appealing to both retailers and consumers. Furthermore, the growing integration of 3D virtual fitting into various retail platforms and mobile applications is expanding market reach and accessibility. However, challenges remain, including the need for high-quality 3D body scans and the potential for technical issues impacting the user experience.
Despite these challenges, the market is poised for continued expansion. Key players like Style.me, Newtempo, and others are actively innovating and developing more sophisticated 3D virtual fitting solutions. The increasing sophistication of 3D body scanning technology and its integration with other retail technologies like virtual stylists and AI-powered recommendation engines will further accelerate market growth. Geographic expansion, particularly into emerging markets with growing e-commerce penetration, also presents significant opportunities. The ongoing efforts to improve user experience, address technical hurdles, and expand the range of supported apparel types are expected to drive broader adoption and solidify the long-term success of the 3D virtual fitting service market.
Unlock Explosive Growth: The Definitive 3D Virtual Fitting Service Market Report (2019-2033)
This comprehensive report provides an in-depth analysis of the booming 3D virtual fitting service market, projecting a multi-million-dollar valuation by 2033. Ideal for investors, industry stakeholders, and businesses seeking to capitalize on this transformative technology, this report offers actionable insights and forecasts for strategic decision-making. The study period covers 2019-2033, with a base year of 2025 and a forecast period of 2025-2033. Historical data from 2019-2024 provides crucial context for future projections.
3D Virtual Fitting Service Market Concentration & Dynamics
The 3D virtual fitting service market exhibits a moderately concentrated landscape, with key players like Style.me, Newtempo, and Visualook commanding significant market share in 2025. However, the market is experiencing rapid expansion, fueled by technological advancements and increasing consumer adoption. Market share data for 2025 indicates that the top 5 players hold approximately xx% of the market, while the remaining share is distributed among numerous smaller companies and emerging startups. The innovation ecosystem is dynamic, with significant investments in research and development driving continuous improvements in accuracy, realism, and user experience. Regulatory frameworks are still evolving, posing both opportunities and challenges for market participants. Substitute products, such as traditional fitting rooms and physical catalogs, are gradually becoming less relevant, as consumers increasingly favor the convenience and personalized experience offered by 3D virtual fitting. The market has witnessed xx M&A deals in the historical period (2019-2024), signifying increasing consolidation and strategic alliances within the industry. End-user trends indicate a strong preference for seamless integration with online shopping platforms and personalized recommendations.
3D Virtual Fitting Service Industry Insights & Trends
The global 3D virtual fitting service market is poised for exponential growth, with a projected market size of $xx million in 2025 and a Compound Annual Growth Rate (CAGR) of xx% during the forecast period (2025-2033). This remarkable expansion is driven by several key factors: the increasing prevalence of e-commerce, the rising demand for personalized shopping experiences, advancements in 3D scanning and rendering technologies, and the growing adoption of augmented reality (AR) and virtual reality (VR) technologies. Technological disruptions, such as the development of more accurate and user-friendly body scanning techniques, are continuously improving the accuracy and appeal of virtual fitting. Consumer behavior is shifting towards convenience and personalized experiences, further fueling the demand for 3D virtual fitting services. The integration of AI and machine learning is enhancing personalization and recommendation capabilities, leading to increased customer satisfaction and brand loyalty.
Key Markets & Segments Leading 3D Virtual Fitting Service
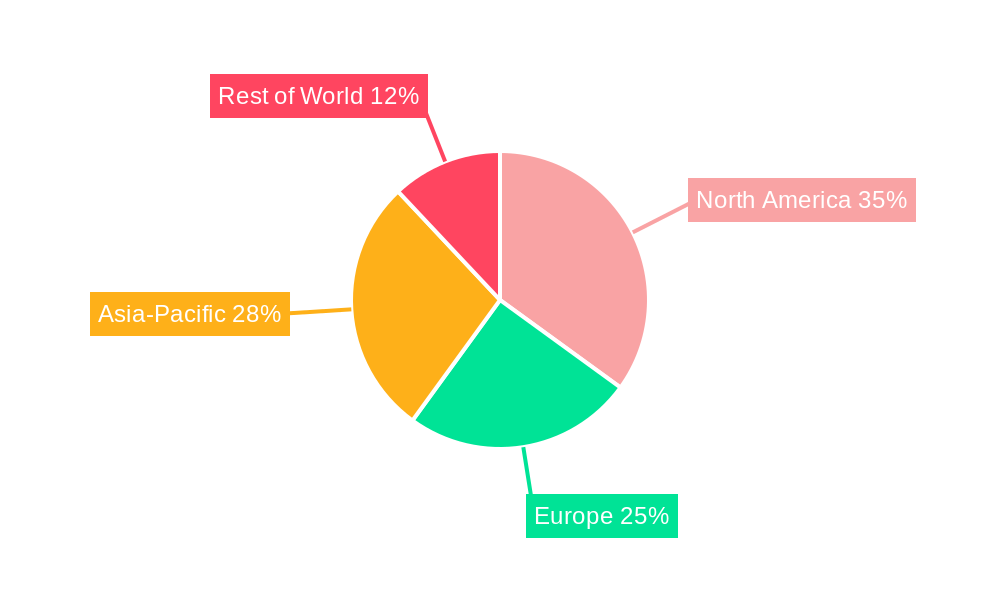
The North American market currently dominates the 3D virtual fitting service landscape, accounting for xx% of the global market share in 2025. This dominance is primarily attributed to:
- High e-commerce penetration: A mature and highly developed e-commerce sector provides a fertile ground for the adoption of 3D virtual fitting technologies.
- Strong technological infrastructure: Robust internet connectivity and technological advancement facilitate the widespread adoption of AR/VR technologies.
- High disposable income: The high disposable income levels among consumers allow for increased spending on technologically advanced shopping experiences.
Europe and Asia-Pacific regions are also exhibiting significant growth potential, driven by factors such as increasing internet penetration, rising smartphone usage, and the growing popularity of online shopping. Detailed analysis shows that the apparel segment holds the largest market share, followed by footwear and accessories.
3D Virtual Fitting Service Product Developments
Recent years have witnessed significant advancements in 3D virtual fitting technology. Innovations include improved body scanning techniques, more realistic rendering capabilities, and seamless integration with various e-commerce platforms. These improvements are enhancing the accuracy, speed, and user experience of virtual fitting, driving increased market adoption. The development of AI-powered personalized recommendation systems further enhances the appeal and effectiveness of these services, providing a competitive edge for companies offering these solutions.
Challenges in the 3D Virtual Fitting Service Market
The 3D virtual fitting service market faces several challenges, including the high initial investment costs associated with implementing advanced technologies, the need for accurate and reliable body scanning solutions, and the ongoing concerns around data privacy and security. Furthermore, the market faces competitive pressures from both established players and new entrants, creating a dynamic and challenging environment. These hurdles create significant entry barriers, potentially hindering smaller companies from entering the market.
Forces Driving 3D Virtual Fitting Service Growth
Several factors contribute to the robust growth trajectory of the 3D virtual fitting service market. Technological advancements, including improvements in 3D scanning, rendering, and AI, are enhancing the accuracy and user experience, leading to increased adoption. The rise of e-commerce and the growing preference for convenient and personalized shopping experiences provide strong tailwinds. Furthermore, supportive government policies and regulations in several countries are fostering innovation and market expansion.
Long-Term Growth Catalysts in the 3D Virtual Fitting Service Market
Continued innovation in 3D scanning and rendering technology, coupled with the increasing integration of AI and machine learning, will drive long-term growth. Strategic partnerships between technology providers and retailers will further expand market reach and adoption. Expansion into new markets and segments, particularly in developing economies, presents significant growth opportunities.
Emerging Opportunities in 3D Virtual Fitting Service
The integration of metaverse technologies and the expansion into new sectors, such as healthcare and manufacturing, present exciting opportunities. The development of more affordable and accessible 3D scanning solutions will further broaden market penetration. Growing demand for sustainability and ethical consumption opens avenues for virtual try-ons reducing the need for physical samples.
Leading Players in the 3D Virtual Fitting Service Sector
- Style.me
- Newtempo
- Visualook
- TriMirror
- Texel
- Magic Mirror
- FestaVR
- Metail
- Reactive Reality
- Voofit
- Virtooal
- Jiangsu Mihe Digital Technology Co.,Ltd
- Huizhan Technology Co.,Ltd
Key Milestones in 3D Virtual Fitting Service Industry
- 2020: Significant advancements in 3D body scanning technology lead to increased accuracy in virtual fitting experiences.
- 2022: Major e-commerce platforms integrate 3D virtual fitting services into their platforms.
- 2023: Several strategic partnerships are formed between technology providers and retailers, boosting market penetration.
- 2024: The introduction of AI-powered personalized recommendation systems enhances the overall customer experience.
Strategic Outlook for 3D Virtual Fitting Service Market
The 3D virtual fitting service market is poised for sustained growth, driven by technological innovations, increasing consumer demand, and strategic partnerships. The market presents significant opportunities for companies to capitalize on the growing preference for personalized and convenient shopping experiences. Forward-thinking companies should focus on investing in research and development, forging strategic alliances, and expanding into new markets to maximize their share of this rapidly evolving sector.
3D Virtual Fitting Service Segmentation
-
1. Application
- 1.1. Department store
- 1.2. Clothing Specialty Store
- 1.3. Individual
- 1.4. Other
-
2. Types
- 2.1. Product
- 2.2. Software
3D Virtual Fitting Service Segmentation By Geography
-
1. North America
- 1.1. United States
- 1.2. Canada
- 1.3. Mexico
-
2. South America
- 2.1. Brazil
- 2.2. Argentina
- 2.3. Rest of South America
-
3. Europe
- 3.1. United Kingdom
- 3.2. Germany
- 3.3. France
- 3.4. Italy
- 3.5. Spain
- 3.6. Russia
- 3.7. Benelux
- 3.8. Nordics
- 3.9. Rest of Europe
-
4. Middle East & Africa
- 4.1. Turkey
- 4.2. Israel
- 4.3. GCC
- 4.4. North Africa
- 4.5. South Africa
- 4.6. Rest of Middle East & Africa
-
5. Asia Pacific
- 5.1. China
- 5.2. India
- 5.3. Japan
- 5.4. South Korea
- 5.5. ASEAN
- 5.6. Oceania
- 5.7. Rest of Asia Pacific
3D Virtual Fitting Service REPORT HIGHLIGHTS
| Aspects | Details |
|---|---|
| Study Period | 2019-2033 |
| Base Year | 2024 |
| Estimated Year | 2025 |
| Forecast Period | 2025-2033 |
| Historical Period | 2019-2024 |
| Growth Rate | CAGR of 4.9% from 2019-2033 |
| Segmentation |
|
Table of Contents
- 1. Introduction
- 1.1. Research Scope
- 1.2. Market Segmentation
- 1.3. Research Methodology
- 1.4. Definitions and Assumptions
- 2. Executive Summary
- 2.1. Introduction
- 3. Market Dynamics
- 3.1. Introduction
- 3.2. Market Drivers
- 3.3. Market Restrains
- 3.4. Market Trends
- 4. Market Factor Analysis
- 4.1. Porters Five Forces
- 4.2. Supply/Value Chain
- 4.3. PESTEL analysis
- 4.4. Market Entropy
- 4.5. Patent/Trademark Analysis
- 5. Global 3D Virtual Fitting Service Analysis, Insights and Forecast, 2019-2031
- 5.1. Market Analysis, Insights and Forecast - by Application
- 5.1.1. Department store
- 5.1.2. Clothing Specialty Store
- 5.1.3. Individual
- 5.1.4. Other
- 5.2. Market Analysis, Insights and Forecast - by Types
- 5.2.1. Product
- 5.2.2. Software
- 5.3. Market Analysis, Insights and Forecast - by Region
- 5.3.1. North America
- 5.3.2. South America
- 5.3.3. Europe
- 5.3.4. Middle East & Africa
- 5.3.5. Asia Pacific
- 5.1. Market Analysis, Insights and Forecast - by Application
- 6. North America 3D Virtual Fitting Service Analysis, Insights and Forecast, 2019-2031
- 6.1. Market Analysis, Insights and Forecast - by Application
- 6.1.1. Department store
- 6.1.2. Clothing Specialty Store
- 6.1.3. Individual
- 6.1.4. Other
- 6.2. Market Analysis, Insights and Forecast - by Types
- 6.2.1. Product
- 6.2.2. Software
- 6.1. Market Analysis, Insights and Forecast - by Application
- 7. South America 3D Virtual Fitting Service Analysis, Insights and Forecast, 2019-2031
- 7.1. Market Analysis, Insights and Forecast - by Application
- 7.1.1. Department store
- 7.1.2. Clothing Specialty Store
- 7.1.3. Individual
- 7.1.4. Other
- 7.2. Market Analysis, Insights and Forecast - by Types
- 7.2.1. Product
- 7.2.2. Software
- 7.1. Market Analysis, Insights and Forecast - by Application
- 8. Europe 3D Virtual Fitting Service Analysis, Insights and Forecast, 2019-2031
- 8.1. Market Analysis, Insights and Forecast - by Application
- 8.1.1. Department store
- 8.1.2. Clothing Specialty Store
- 8.1.3. Individual
- 8.1.4. Other
- 8.2. Market Analysis, Insights and Forecast - by Types
- 8.2.1. Product
- 8.2.2. Software
- 8.1. Market Analysis, Insights and Forecast - by Application
- 9. Middle East & Africa 3D Virtual Fitting Service Analysis, Insights and Forecast, 2019-2031
- 9.1. Market Analysis, Insights and Forecast - by Application
- 9.1.1. Department store
- 9.1.2. Clothing Specialty Store
- 9.1.3. Individual
- 9.1.4. Other
- 9.2. Market Analysis, Insights and Forecast - by Types
- 9.2.1. Product
- 9.2.2. Software
- 9.1. Market Analysis, Insights and Forecast - by Application
- 10. Asia Pacific 3D Virtual Fitting Service Analysis, Insights and Forecast, 2019-2031
- 10.1. Market Analysis, Insights and Forecast - by Application
- 10.1.1. Department store
- 10.1.2. Clothing Specialty Store
- 10.1.3. Individual
- 10.1.4. Other
- 10.2. Market Analysis, Insights and Forecast - by Types
- 10.2.1. Product
- 10.2.2. Software
- 10.1. Market Analysis, Insights and Forecast - by Application
- 11. Competitive Analysis
- 11.1. Global Market Share Analysis 2024
- 11.2. Company Profiles
- 11.2.1 Style.me
- 11.2.1.1. Overview
- 11.2.1.2. Products
- 11.2.1.3. SWOT Analysis
- 11.2.1.4. Recent Developments
- 11.2.1.5. Financials (Based on Availability)
- 11.2.2 Newtempo
- 11.2.2.1. Overview
- 11.2.2.2. Products
- 11.2.2.3. SWOT Analysis
- 11.2.2.4. Recent Developments
- 11.2.2.5. Financials (Based on Availability)
- 11.2.3 Visualook
- 11.2.3.1. Overview
- 11.2.3.2. Products
- 11.2.3.3. SWOT Analysis
- 11.2.3.4. Recent Developments
- 11.2.3.5. Financials (Based on Availability)
- 11.2.4 TriMirror
- 11.2.4.1. Overview
- 11.2.4.2. Products
- 11.2.4.3. SWOT Analysis
- 11.2.4.4. Recent Developments
- 11.2.4.5. Financials (Based on Availability)
- 11.2.5 Texel
- 11.2.5.1. Overview
- 11.2.5.2. Products
- 11.2.5.3. SWOT Analysis
- 11.2.5.4. Recent Developments
- 11.2.5.5. Financials (Based on Availability)
- 11.2.6 Magic Mirror
- 11.2.6.1. Overview
- 11.2.6.2. Products
- 11.2.6.3. SWOT Analysis
- 11.2.6.4. Recent Developments
- 11.2.6.5. Financials (Based on Availability)
- 11.2.7 FestaVR
- 11.2.7.1. Overview
- 11.2.7.2. Products
- 11.2.7.3. SWOT Analysis
- 11.2.7.4. Recent Developments
- 11.2.7.5. Financials (Based on Availability)
- 11.2.8 Metail
- 11.2.8.1. Overview
- 11.2.8.2. Products
- 11.2.8.3. SWOT Analysis
- 11.2.8.4. Recent Developments
- 11.2.8.5. Financials (Based on Availability)
- 11.2.9 Reactive Reality
- 11.2.9.1. Overview
- 11.2.9.2. Products
- 11.2.9.3. SWOT Analysis
- 11.2.9.4. Recent Developments
- 11.2.9.5. Financials (Based on Availability)
- 11.2.10 Voofit
- 11.2.10.1. Overview
- 11.2.10.2. Products
- 11.2.10.3. SWOT Analysis
- 11.2.10.4. Recent Developments
- 11.2.10.5. Financials (Based on Availability)
- 11.2.11 Virtooal
- 11.2.11.1. Overview
- 11.2.11.2. Products
- 11.2.11.3. SWOT Analysis
- 11.2.11.4. Recent Developments
- 11.2.11.5. Financials (Based on Availability)
- 11.2.12 Jiangsu Mihe Digital Technology Co.
- 11.2.12.1. Overview
- 11.2.12.2. Products
- 11.2.12.3. SWOT Analysis
- 11.2.12.4. Recent Developments
- 11.2.12.5. Financials (Based on Availability)
- 11.2.13 Ltd
- 11.2.13.1. Overview
- 11.2.13.2. Products
- 11.2.13.3. SWOT Analysis
- 11.2.13.4. Recent Developments
- 11.2.13.5. Financials (Based on Availability)
- 11.2.14 Huizhan Technology Co.
- 11.2.14.1. Overview
- 11.2.14.2. Products
- 11.2.14.3. SWOT Analysis
- 11.2.14.4. Recent Developments
- 11.2.14.5. Financials (Based on Availability)
- 11.2.15 Ltd
- 11.2.15.1. Overview
- 11.2.15.2. Products
- 11.2.15.3. SWOT Analysis
- 11.2.15.4. Recent Developments
- 11.2.15.5. Financials (Based on Availability)
- 11.2.1 Style.me
List of Figures
- Figure 1: Global 3D Virtual Fitting Service Revenue Breakdown (million, %) by Region 2024 & 2032
- Figure 2: North America 3D Virtual Fitting Service Revenue (million), by Application 2024 & 2032
- Figure 3: North America 3D Virtual Fitting Service Revenue Share (%), by Application 2024 & 2032
- Figure 4: North America 3D Virtual Fitting Service Revenue (million), by Types 2024 & 2032
- Figure 5: North America 3D Virtual Fitting Service Revenue Share (%), by Types 2024 & 2032
- Figure 6: North America 3D Virtual Fitting Service Revenue (million), by Country 2024 & 2032
- Figure 7: North America 3D Virtual Fitting Service Revenue Share (%), by Country 2024 & 2032
- Figure 8: South America 3D Virtual Fitting Service Revenue (million), by Application 2024 & 2032
- Figure 9: South America 3D Virtual Fitting Service Revenue Share (%), by Application 2024 & 2032
- Figure 10: South America 3D Virtual Fitting Service Revenue (million), by Types 2024 & 2032
- Figure 11: South America 3D Virtual Fitting Service Revenue Share (%), by Types 2024 & 2032
- Figure 12: South America 3D Virtual Fitting Service Revenue (million), by Country 2024 & 2032
- Figure 13: South America 3D Virtual Fitting Service Revenue Share (%), by Country 2024 & 2032
- Figure 14: Europe 3D Virtual Fitting Service Revenue (million), by Application 2024 & 2032
- Figure 15: Europe 3D Virtual Fitting Service Revenue Share (%), by Application 2024 & 2032
- Figure 16: Europe 3D Virtual Fitting Service Revenue (million), by Types 2024 & 2032
- Figure 17: Europe 3D Virtual Fitting Service Revenue Share (%), by Types 2024 & 2032
- Figure 18: Europe 3D Virtual Fitting Service Revenue (million), by Country 2024 & 2032
- Figure 19: Europe 3D Virtual Fitting Service Revenue Share (%), by Country 2024 & 2032
- Figure 20: Middle East & Africa 3D Virtual Fitting Service Revenue (million), by Application 2024 & 2032
- Figure 21: Middle East & Africa 3D Virtual Fitting Service Revenue Share (%), by Application 2024 & 2032
- Figure 22: Middle East & Africa 3D Virtual Fitting Service Revenue (million), by Types 2024 & 2032
- Figure 23: Middle East & Africa 3D Virtual Fitting Service Revenue Share (%), by Types 2024 & 2032
- Figure 24: Middle East & Africa 3D Virtual Fitting Service Revenue (million), by Country 2024 & 2032
- Figure 25: Middle East & Africa 3D Virtual Fitting Service Revenue Share (%), by Country 2024 & 2032
- Figure 26: Asia Pacific 3D Virtual Fitting Service Revenue (million), by Application 2024 & 2032
- Figure 27: Asia Pacific 3D Virtual Fitting Service Revenue Share (%), by Application 2024 & 2032
- Figure 28: Asia Pacific 3D Virtual Fitting Service Revenue (million), by Types 2024 & 2032
- Figure 29: Asia Pacific 3D Virtual Fitting Service Revenue Share (%), by Types 2024 & 2032
- Figure 30: Asia Pacific 3D Virtual Fitting Service Revenue (million), by Country 2024 & 2032
- Figure 31: Asia Pacific 3D Virtual Fitting Service Revenue Share (%), by Country 2024 & 2032
List of Tables
- Table 1: Global 3D Virtual Fitting Service Revenue million Forecast, by Region 2019 & 2032
- Table 2: Global 3D Virtual Fitting Service Revenue million Forecast, by Application 2019 & 2032
- Table 3: Global 3D Virtual Fitting Service Revenue million Forecast, by Types 2019 & 2032
- Table 4: Global 3D Virtual Fitting Service Revenue million Forecast, by Region 2019 & 2032
- Table 5: Global 3D Virtual Fitting Service Revenue million Forecast, by Application 2019 & 2032
- Table 6: Global 3D Virtual Fitting Service Revenue million Forecast, by Types 2019 & 2032
- Table 7: Global 3D Virtual Fitting Service Revenue million Forecast, by Country 2019 & 2032
- Table 8: United States 3D Virtual Fitting Service Revenue (million) Forecast, by Application 2019 & 2032
- Table 9: Canada 3D Virtual Fitting Service Revenue (million) Forecast, by Application 2019 & 2032
- Table 10: Mexico 3D Virtual Fitting Service Revenue (million) Forecast, by Application 2019 & 2032
- Table 11: Global 3D Virtual Fitting Service Revenue million Forecast, by Application 2019 & 2032
- Table 12: Global 3D Virtual Fitting Service Revenue million Forecast, by Types 2019 & 2032
- Table 13: Global 3D Virtual Fitting Service Revenue million Forecast, by Country 2019 & 2032
- Table 14: Brazil 3D Virtual Fitting Service Revenue (million) Forecast, by Application 2019 & 2032
- Table 15: Argentina 3D Virtual Fitting Service Revenue (million) Forecast, by Application 2019 & 2032
- Table 16: Rest of South America 3D Virtual Fitting Service Revenue (million) Forecast, by Application 2019 & 2032
- Table 17: Global 3D Virtual Fitting Service Revenue million Forecast, by Application 2019 & 2032
- Table 18: Global 3D Virtual Fitting Service Revenue million Forecast, by Types 2019 & 2032
- Table 19: Global 3D Virtual Fitting Service Revenue million Forecast, by Country 2019 & 2032
- Table 20: United Kingdom 3D Virtual Fitting Service Revenue (million) Forecast, by Application 2019 & 2032
- Table 21: Germany 3D Virtual Fitting Service Revenue (million) Forecast, by Application 2019 & 2032
- Table 22: France 3D Virtual Fitting Service Revenue (million) Forecast, by Application 2019 & 2032
- Table 23: Italy 3D Virtual Fitting Service Revenue (million) Forecast, by Application 2019 & 2032
- Table 24: Spain 3D Virtual Fitting Service Revenue (million) Forecast, by Application 2019 & 2032
- Table 25: Russia 3D Virtual Fitting Service Revenue (million) Forecast, by Application 2019 & 2032
- Table 26: Benelux 3D Virtual Fitting Service Revenue (million) Forecast, by Application 2019 & 2032
- Table 27: Nordics 3D Virtual Fitting Service Revenue (million) Forecast, by Application 2019 & 2032
- Table 28: Rest of Europe 3D Virtual Fitting Service Revenue (million) Forecast, by Application 2019 & 2032
- Table 29: Global 3D Virtual Fitting Service Revenue million Forecast, by Application 2019 & 2032
- Table 30: Global 3D Virtual Fitting Service Revenue million Forecast, by Types 2019 & 2032
- Table 31: Global 3D Virtual Fitting Service Revenue million Forecast, by Country 2019 & 2032
- Table 32: Turkey 3D Virtual Fitting Service Revenue (million) Forecast, by Application 2019 & 2032
- Table 33: Israel 3D Virtual Fitting Service Revenue (million) Forecast, by Application 2019 & 2032
- Table 34: GCC 3D Virtual Fitting Service Revenue (million) Forecast, by Application 2019 & 2032
- Table 35: North Africa 3D Virtual Fitting Service Revenue (million) Forecast, by Application 2019 & 2032
- Table 36: South Africa 3D Virtual Fitting Service Revenue (million) Forecast, by Application 2019 & 2032
- Table 37: Rest of Middle East & Africa 3D Virtual Fitting Service Revenue (million) Forecast, by Application 2019 & 2032
- Table 38: Global 3D Virtual Fitting Service Revenue million Forecast, by Application 2019 & 2032
- Table 39: Global 3D Virtual Fitting Service Revenue million Forecast, by Types 2019 & 2032
- Table 40: Global 3D Virtual Fitting Service Revenue million Forecast, by Country 2019 & 2032
- Table 41: China 3D Virtual Fitting Service Revenue (million) Forecast, by Application 2019 & 2032
- Table 42: India 3D Virtual Fitting Service Revenue (million) Forecast, by Application 2019 & 2032
- Table 43: Japan 3D Virtual Fitting Service Revenue (million) Forecast, by Application 2019 & 2032
- Table 44: South Korea 3D Virtual Fitting Service Revenue (million) Forecast, by Application 2019 & 2032
- Table 45: ASEAN 3D Virtual Fitting Service Revenue (million) Forecast, by Application 2019 & 2032
- Table 46: Oceania 3D Virtual Fitting Service Revenue (million) Forecast, by Application 2019 & 2032
- Table 47: Rest of Asia Pacific 3D Virtual Fitting Service Revenue (million) Forecast, by Application 2019 & 2032
Frequently Asked Questions
1. What is the projected Compound Annual Growth Rate (CAGR) of the 3D Virtual Fitting Service?
The projected CAGR is approximately 4.9%.
2. Which companies are prominent players in the 3D Virtual Fitting Service?
Key companies in the market include Style.me, Newtempo, Visualook, TriMirror, Texel, Magic Mirror, FestaVR, Metail, Reactive Reality, Voofit, Virtooal, Jiangsu Mihe Digital Technology Co., Ltd, Huizhan Technology Co., Ltd.
3. What are the main segments of the 3D Virtual Fitting Service?
The market segments include Application, Types.
4. Can you provide details about the market size?
The market size is estimated to be USD 36 million as of 2022.
5. What are some drivers contributing to market growth?
N/A
6. What are the notable trends driving market growth?
N/A
7. Are there any restraints impacting market growth?
N/A
8. Can you provide examples of recent developments in the market?
N/A
9. What pricing options are available for accessing the report?
Pricing options include single-user, multi-user, and enterprise licenses priced at USD 3950.00, USD 5925.00, and USD 7900.00 respectively.
10. Is the market size provided in terms of value or volume?
The market size is provided in terms of value, measured in million.
11. Are there any specific market keywords associated with the report?
Yes, the market keyword associated with the report is "3D Virtual Fitting Service," which aids in identifying and referencing the specific market segment covered.
12. How do I determine which pricing option suits my needs best?
The pricing options vary based on user requirements and access needs. Individual users may opt for single-user licenses, while businesses requiring broader access may choose multi-user or enterprise licenses for cost-effective access to the report.
13. Are there any additional resources or data provided in the 3D Virtual Fitting Service report?
While the report offers comprehensive insights, it's advisable to review the specific contents or supplementary materials provided to ascertain if additional resources or data are available.
14. How can I stay updated on further developments or reports in the 3D Virtual Fitting Service?
To stay informed about further developments, trends, and reports in the 3D Virtual Fitting Service, consider subscribing to industry newsletters, following relevant companies and organizations, or regularly checking reputable industry news sources and publications.
Methodology
Step 1 - Identification of Relevant Samples Size from Population Database


Step 2 - Approaches for Defining Global Market Size (Value, Volume* & Price*)

Note*: In applicable scenarios
Step 3 - Data Sources
Primary Research
- Web Analytics
- Survey Reports
- Research Institute
- Latest Research Reports
- Opinion Leaders
Secondary Research
- Annual Reports
- White Paper
- Latest Press Release
- Industry Association
- Paid Database
- Investor Presentations

Step 4 - Data Triangulation
Involves using different sources of information in order to increase the validity of a study
These sources are likely to be stakeholders in a program - participants, other researchers, program staff, other community members, and so on.
Then we put all data in single framework & apply various statistical tools to find out the dynamic on the market.
During the analysis stage, feedback from the stakeholder groups would be compared to determine areas of agreement as well as areas of divergence
