

Key Insights
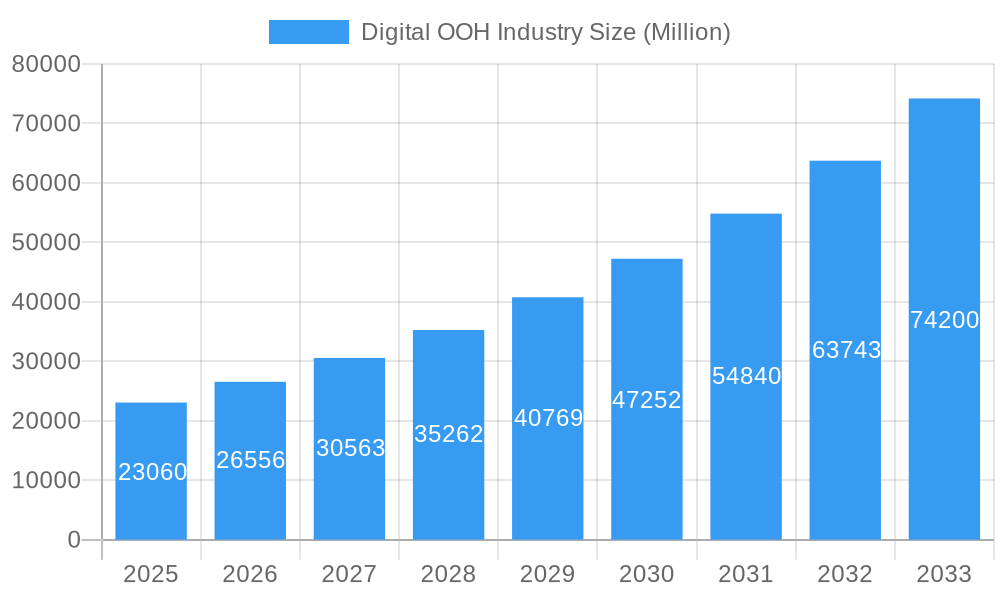
The Digital Out-of-Home (DOOH) advertising market is experiencing robust growth, projected to reach \$23.06 billion in 2025 and maintain a Compound Annual Growth Rate (CAGR) of 15.20% from 2025 to 2033. This expansion is fueled by several key drivers. Firstly, the increasing adoption of programmatic advertising allows for more targeted and efficient DOOH campaigns, mirroring the precision of online advertising but leveraging the high impact of physical displays. Secondly, the integration of data analytics provides advertisers with valuable insights into audience demographics and engagement, optimizing campaign performance and ROI. Thirdly, the continuous innovation in display technology, featuring higher resolution screens and interactive capabilities, enhances the visual appeal and effectiveness of DOOH advertising, attracting brands seeking more immersive and engaging customer experiences. Finally, the rise of smart cities and increased urbanization is creating a larger audience base for DOOH displays strategically located in high-traffic areas. This synergy between technological advancement, data-driven strategies, and urban expansion is propelling the DOOH market's phenomenal growth.
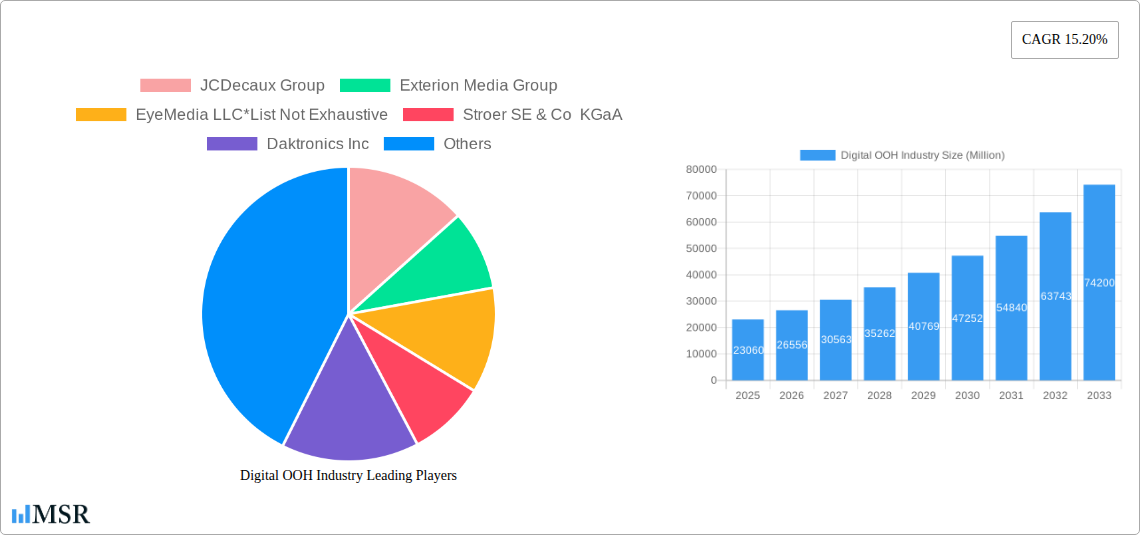
Digital OOH Industry Market Size (In Billion)
Several market segments contribute significantly to this growth trajectory. The Retail and Healthcare/Pharmaceutical sectors are major adopters of DOOH, leveraging it for product promotion and brand building. Similarly, the Financial Services, Automotive, and Telecom/Utilities industries utilize DOOH for targeted advertising campaigns reaching specific demographics. Different DOOH application types, including billboards, transit advertising, and street furniture, also play a vital role in shaping market dynamics. Geographic variations exist, with North America and Europe currently holding larger market shares, however, the Asia-Pacific region is anticipated to witness accelerated growth in the coming years driven by rising urbanization and increasing disposable income. Competition within the DOOH market is intense, with major players like JCDecaux, Exterion Media, and Clear Channel Outdoor Holdings Inc. constantly innovating and expanding their network of displays to maintain market dominance. The overall outlook for the DOOH industry remains extremely positive, promising sustained growth and exciting opportunities for advertisers and technology providers alike.
Digital OOH Industry Company Market Share
Digital OOH Industry Market Report: 2019-2033 Forecast
This comprehensive report provides a detailed analysis of the Digital Out-of-Home (DOOH) advertising industry, projecting a market value exceeding $XX Million by 2033. The study covers the period from 2019 to 2033, with 2025 serving as both the base and estimated year. This in-depth analysis is essential for industry stakeholders, investors, and businesses seeking to understand the growth trajectory and future opportunities within the dynamic DOOH landscape. Key players like JCDecaux Group, Exterion Media Group, and Clear Channel Outdoor Holdings Inc. are profiled, alongside emerging trends and challenges shaping the sector.
Digital OOH Industry Market Concentration & Dynamics
The Digital OOH market exhibits a moderately concentrated structure, with a few major players holding significant market share. While precise figures fluctuate, JCDecaux Group, Exterion Media Group, and Clear Channel Outdoor Holdings Inc., among others, command substantial portions of the global market. This concentration is influenced by factors including economies of scale, strong brand recognition, and extensive network reach. However, the market is dynamic with consistent innovation, especially in programmatic advertising and data-driven targeting.
The regulatory landscape varies significantly across geographies, impacting deployment and advertising practices. Furthermore, the presence of alternative advertising channels, like digital media and social media, introduces competitive pressure, though DOOH's unique ability to reach engaged audiences in physical spaces helps maintain its edge. M&A activities are relatively frequent, reflecting industry consolidation and expansion efforts. Over the historical period (2019-2024), approximately xx M&A deals were recorded, with an estimated xx million dollars in total deal value. End-user trends show increasing demand from retail, healthcare, and financial services sectors, driving growth.
Digital OOH Industry Insights & Trends
The Digital OOH industry has witnessed remarkable growth, boasting a Compound Annual Growth Rate (CAGR) of xx% during the historical period (2019-2024), reaching a market size of $xx Million in 2024. This growth is fueled by several key drivers: increasing adoption of programmatic advertising, enhancing audience targeting capabilities, and the integration of data analytics for campaign optimization. Technological advancements, such as the development of high-resolution displays, improved software for content management, and the rise of connected screens, further propel market expansion.
Evolving consumer behaviors, marked by increased exposure to digital platforms and a heightened preference for personalized experiences, further boost DOOH's appeal. The ability of DOOH to deliver targeted, engaging campaigns in high-traffic public locations makes it increasingly attractive to advertisers seeking to achieve tangible results. Programmatic advertising, in particular, has transformed the industry by enabling automated buying and real-time optimization, improving efficiency and increasing campaign ROI. We project the market to reach $xx Million by 2025 and $XX Million by 2033, driven by continued technological advancements and increased advertiser adoption.
Key Markets & Segments Leading Digital OOH Industry
The global Digital OOH market demonstrates significant regional variations. North America and Europe currently hold the largest market shares, driven by advanced infrastructure, high digital literacy rates, and robust advertising budgets. However, Asia-Pacific is emerging as a fast-growing region, with rapid urbanization and expanding digital infrastructure fostering considerable growth potential.
Application Dominance: Billboard advertising remains a major segment, contributing to a significant portion of the market revenue. However, transit and street furniture advertising are also experiencing substantial growth, reflecting the increasing importance of out-of-home advertising in public transportation hubs and high-foot-traffic areas. Other applications, such as mall displays and experiential activations, are also gaining traction.
End-User Segmentation: Retail remains a significant end-user segment, with businesses leveraging DOOH for brand building, promotional campaigns, and targeted advertising. Healthcare/Pharmaceuticals and Financial Services are also prominent users, reflecting the effectiveness of DOOH in reaching specific demographic segments with targeted messages. The automotive, telecom/utilities, and government agencies sectors are also increasingly adopting DOOH solutions.
Growth Drivers:
- Strong economic growth in key markets.
- Increased investment in urban infrastructure development.
- Rising adoption of programmatic advertising.
- Growing demand for targeted and personalized advertising.
- Advances in technology leading to innovative display formats.
Digital OOH Industry Product Developments
Recent years have witnessed significant product innovation in the DOOH sector. This includes the development of more energy-efficient displays, improved content management systems with enhanced analytics capabilities, and the integration of programmatic advertising platforms. Advancements in display technology, including the adoption of higher resolutions and interactive screens, are enhancing the overall user experience and increasing the effectiveness of DOOH campaigns. These developments are driving competitiveness by offering advertisers more sophisticated targeting options and better measurement capabilities, leading to enhanced return on investment.
Challenges in the Digital OOH Industry Market
The Digital OOH market faces several challenges, including regulatory hurdles around advertising placement and content restrictions in certain locations (leading to a xx% reduction in potential revenue in some regions). Supply chain disruptions and the rising costs of raw materials, particularly impacting the manufacturing and deployment of new displays, are also significant constraints. Furthermore, intense competition from other advertising channels, including digital and social media platforms, requires continuous innovation to remain competitive, impacting market growth by an estimated xx%.
Forces Driving Digital OOH Industry Growth
Several factors drive the Digital OOH industry's growth. Technological advancements, such as the development of high-resolution displays and advanced programmatic capabilities, are significantly enhancing campaign effectiveness and targeting precision. Robust economic growth in key markets fuels increased advertising spending, further boosting the industry's expansion. Favorable regulatory environments that promote innovation and competition are crucial for fostering market development, whilst also encouraging growth through public-private partnerships in infrastructure development.
Long-Term Growth Catalysts in the Digital OOH Industry
The long-term growth of the DOOH market hinges on continued innovation in display technology, particularly the exploration of augmented reality (AR) and virtual reality (VR) integrations to create immersive and interactive advertising experiences. Strategic partnerships between DOOH providers and data analytics firms will be key in unlocking the full potential of audience targeting and campaign optimization. Expansions into new and emerging markets with rising disposable incomes will further solidify the industry's long-term growth trajectory.
Emerging Opportunities in Digital OOH Industry
Several opportunities exist within the DOOH sector. The expansion into emerging markets, particularly in Asia-Pacific and Latin America, presents significant growth potential, given the increasing urbanization and rising advertising spending in these regions. The integration of artificial intelligence (AI) and machine learning (ML) for more advanced campaign automation and predictive analytics is a major growth area. Personalized and interactive DOOH displays, catering to individual consumer preferences, will offer new levels of engagement and effectiveness for advertisers.
Leading Players in the Digital OOH Industry Sector
- JCDecaux Group
- Exterion Media Group
- EyeMedia LLC
- Stroer SE & Co KGaA
- Daktronics Inc
- The Times Group
- BroadSign International LLC
- OUTFRONT Media
- oOh!media Limited
- SevenOne Media GmbH
- Talon Outdoor Ltd
- QMS Media Limited
- Clear Channel Outdoor Holdings Inc
Key Milestones in Digital OOH Industry Industry
- June 2022: JCDecaux launches its programmatic DOOH product in Brazil in collaboration with VIOOH, boosting programmatic advertising adoption in a key emerging market.
- April 2022: Adani Airports integrates programmatic DOOH media through Lemma, modernizing airport advertising in India and expanding programmatic reach in a high-traffic environment.
Strategic Outlook for Digital OOH Industry Market
The Digital OOH market is poised for continued robust growth, driven by technological innovation, expanding market penetration, and the increasing demand for targeted and engaging advertising solutions. Strategic partnerships, focused on data integration and the development of innovative advertising formats, will be key to unlocking the full potential of this dynamic industry. The focus on audience-centric campaigns and the utilization of data-driven insights will shape future market expansion and growth opportunities.
Digital OOH Industry Segmentation
-
1. Application
- 1.1. Billboard
- 1.2. Transit
- 1.3. Street Furniture
- 1.4. Other Applications
-
2. End-User
- 2.1. Retail
- 2.2. Healthcare/Pharmaceuticals
- 2.3. Financial Services
- 2.4. Automotive
- 2.5. Telecom/Utilities
- 2.6. Government Agencies
- 2.7. Other End-Users
Digital OOH Industry Segmentation By Geography
-
1. North America
- 1.1. United States
- 1.2. Canada
-
2. Europe
- 2.1. Germany
- 2.2. United Kingdom
- 2.3. Spain
- 2.4. France
- 2.5. Rest of Europe
-
3. Asia Pacific
- 3.1. China
- 3.2. India
- 3.3. Japan
- 3.4. Singapore
- 3.5. South Korea
- 3.6. Rest of Asia Pacific
-
4. Latin America
- 4.1. Brazil
- 4.2. Mexico
- 4.3. Chile
- 4.4. Rest of Latin America
-
5. Middle East and Africa
- 5.1. GCC
- 5.2. South Africa
- 5.3. Rest of Middle East and Africa
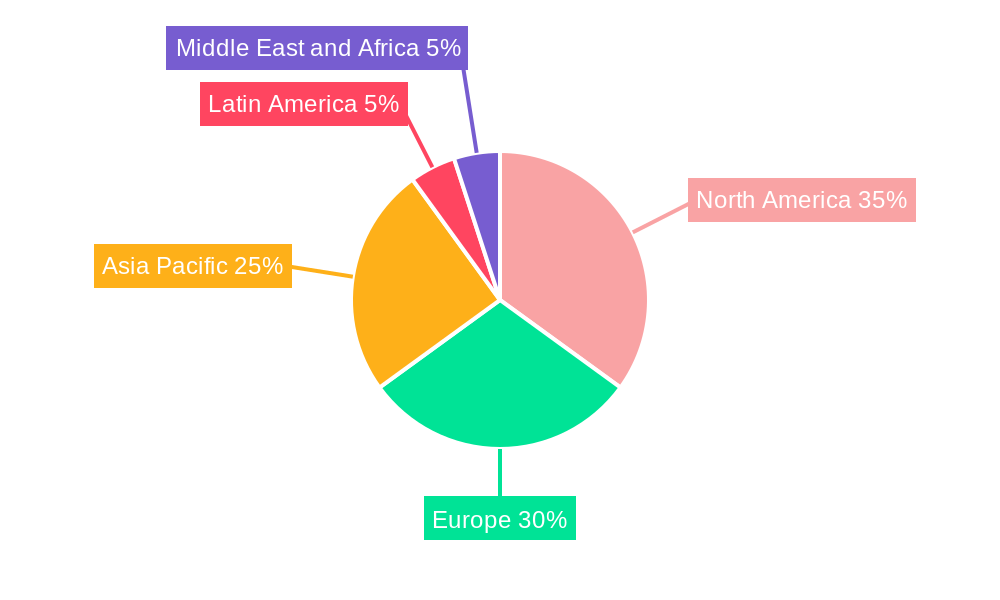
Digital OOH Industry Regional Market Share
Geographic Coverage of Digital OOH Industry
Digital OOH Industry REPORT HIGHLIGHTS
| Aspects | Details |
|---|---|
| Study Period | 2020-2034 |
| Base Year | 2025 |
| Estimated Year | 2026 |
| Forecast Period | 2026-2034 |
| Historical Period | 2020-2025 |
| Growth Rate | CAGR of 15.20% from 2020-2034 |
| Segmentation |
|
Table of Contents
- 1. Introduction
- 1.1. Research Scope
- 1.2. Market Segmentation
- 1.3. Research Objective
- 1.4. Definitions and Assumptions
- 2. Executive Summary
- 2.1. Market Snapshot
- 3. Market Dynamics
- 3.1. Market Drivers
- 3.2. Market Restrains
- 3.3. Market Trends
- 3.4. Market Opportunities
- 4. Market Factor Analysis
- 4.1. Porters Five Forces
- 4.1.1. Bargaining Power of Suppliers
- 4.1.2. Bargaining Power of Buyers
- 4.1.3. Threat of New Entrants
- 4.1.4. Threat of Substitutes
- 4.1.5. Competitive Rivalry
- 4.2. PESTEL analysis
- 4.3. BCG Analysis
- 4.3.1. Stars (High Growth, High Market Share)
- 4.3.2. Cash Cows (Low Growth, High Market Share)
- 4.3.3. Question Mark (High Growth, Low Market Share)
- 4.3.4. Dogs (Low Growth, Low Market Share)
- 4.4. Ansoff Matrix Analysis
- 4.5. Supply Chain Analysis
- 4.6. Regulatory Landscape
- 4.7. Current Market Potential and Opportunity Assessment (TAM–SAM–SOM Framework)
- 4.8. MSR Analyst Note
- 4.1. Porters Five Forces
- 5. Market Analysis, Insights and Forecast 2021-2033
- 5.1. Market Analysis, Insights and Forecast - by Application
- 5.1.1. Billboard
- 5.1.2. Transit
- 5.1.3. Street Furniture
- 5.1.4. Other Applications
- 5.2. Market Analysis, Insights and Forecast - by End-User
- 5.2.1. Retail
- 5.2.2. Healthcare/Pharmaceuticals
- 5.2.3. Financial Services
- 5.2.4. Automotive
- 5.2.5. Telecom/Utilities
- 5.2.6. Government Agencies
- 5.2.7. Other End-Users
- 5.3. Market Analysis, Insights and Forecast - by Region
- 5.3.1. North America
- 5.3.2. Europe
- 5.3.3. Asia Pacific
- 5.3.4. Latin America
- 5.3.5. Middle East and Africa
- 5.1. Market Analysis, Insights and Forecast - by Application
- 6. Global Digital OOH Industry Analysis, Insights and Forecast, 2021-2033
- 6.1. Market Analysis, Insights and Forecast - by Application
- 6.1.1. Billboard
- 6.1.2. Transit
- 6.1.3. Street Furniture
- 6.1.4. Other Applications
- 6.2. Market Analysis, Insights and Forecast - by End-User
- 6.2.1. Retail
- 6.2.2. Healthcare/Pharmaceuticals
- 6.2.3. Financial Services
- 6.2.4. Automotive
- 6.2.5. Telecom/Utilities
- 6.2.6. Government Agencies
- 6.2.7. Other End-Users
- 6.1. Market Analysis, Insights and Forecast - by Application
- 7. North America Digital OOH Industry Analysis, Insights and Forecast, 2020-2032
- 7.1. Market Analysis, Insights and Forecast - by Application
- 7.1.1. Billboard
- 7.1.2. Transit
- 7.1.3. Street Furniture
- 7.1.4. Other Applications
- 7.2. Market Analysis, Insights and Forecast - by End-User
- 7.2.1. Retail
- 7.2.2. Healthcare/Pharmaceuticals
- 7.2.3. Financial Services
- 7.2.4. Automotive
- 7.2.5. Telecom/Utilities
- 7.2.6. Government Agencies
- 7.2.7. Other End-Users
- 7.1. Market Analysis, Insights and Forecast - by Application
- 8. Europe Digital OOH Industry Analysis, Insights and Forecast, 2020-2032
- 8.1. Market Analysis, Insights and Forecast - by Application
- 8.1.1. Billboard
- 8.1.2. Transit
- 8.1.3. Street Furniture
- 8.1.4. Other Applications
- 8.2. Market Analysis, Insights and Forecast - by End-User
- 8.2.1. Retail
- 8.2.2. Healthcare/Pharmaceuticals
- 8.2.3. Financial Services
- 8.2.4. Automotive
- 8.2.5. Telecom/Utilities
- 8.2.6. Government Agencies
- 8.2.7. Other End-Users
- 8.1. Market Analysis, Insights and Forecast - by Application
- 9. Asia Pacific Digital OOH Industry Analysis, Insights and Forecast, 2020-2032
- 9.1. Market Analysis, Insights and Forecast - by Application
- 9.1.1. Billboard
- 9.1.2. Transit
- 9.1.3. Street Furniture
- 9.1.4. Other Applications
- 9.2. Market Analysis, Insights and Forecast - by End-User
- 9.2.1. Retail
- 9.2.2. Healthcare/Pharmaceuticals
- 9.2.3. Financial Services
- 9.2.4. Automotive
- 9.2.5. Telecom/Utilities
- 9.2.6. Government Agencies
- 9.2.7. Other End-Users
- 9.1. Market Analysis, Insights and Forecast - by Application
- 10. Latin America Digital OOH Industry Analysis, Insights and Forecast, 2020-2032
- 10.1. Market Analysis, Insights and Forecast - by Application
- 10.1.1. Billboard
- 10.1.2. Transit
- 10.1.3. Street Furniture
- 10.1.4. Other Applications
- 10.2. Market Analysis, Insights and Forecast - by End-User
- 10.2.1. Retail
- 10.2.2. Healthcare/Pharmaceuticals
- 10.2.3. Financial Services
- 10.2.4. Automotive
- 10.2.5. Telecom/Utilities
- 10.2.6. Government Agencies
- 10.2.7. Other End-Users
- 10.1. Market Analysis, Insights and Forecast - by Application
- 11. Middle East and Africa Digital OOH Industry Analysis, Insights and Forecast, 2020-2032
- 11.1. Market Analysis, Insights and Forecast - by Application
- 11.1.1. Billboard
- 11.1.2. Transit
- 11.1.3. Street Furniture
- 11.1.4. Other Applications
- 11.2. Market Analysis, Insights and Forecast - by End-User
- 11.2.1. Retail
- 11.2.2. Healthcare/Pharmaceuticals
- 11.2.3. Financial Services
- 11.2.4. Automotive
- 11.2.5. Telecom/Utilities
- 11.2.6. Government Agencies
- 11.2.7. Other End-Users
- 11.1. Market Analysis, Insights and Forecast - by Application
- 12. Competitive Analysis
- 12.1. Company Profiles
- 12.1.1 JCDecaux Group
- 12.1.1.1. Company Overview
- 12.1.1.2. Products
- 12.1.1.3. Company Financials
- 12.1.1.4. SWOT Analysis
- 12.1.2 Exterion Media Group
- 12.1.2.1. Company Overview
- 12.1.2.2. Products
- 12.1.2.3. Company Financials
- 12.1.2.4. SWOT Analysis
- 12.1.3 EyeMedia LLC*List Not Exhaustive
- 12.1.3.1. Company Overview
- 12.1.3.2. Products
- 12.1.3.3. Company Financials
- 12.1.3.4. SWOT Analysis
- 12.1.4 Stroer SE & Co KGaA
- 12.1.4.1. Company Overview
- 12.1.4.2. Products
- 12.1.4.3. Company Financials
- 12.1.4.4. SWOT Analysis
- 12.1.5 Daktronics Inc
- 12.1.5.1. Company Overview
- 12.1.5.2. Products
- 12.1.5.3. Company Financials
- 12.1.5.4. SWOT Analysis
- 12.1.6 The Times Group
- 12.1.6.1. Company Overview
- 12.1.6.2. Products
- 12.1.6.3. Company Financials
- 12.1.6.4. SWOT Analysis
- 12.1.7 BroadSign International LLC
- 12.1.7.1. Company Overview
- 12.1.7.2. Products
- 12.1.7.3. Company Financials
- 12.1.7.4. SWOT Analysis
- 12.1.8 OUTFRONT Media
- 12.1.8.1. Company Overview
- 12.1.8.2. Products
- 12.1.8.3. Company Financials
- 12.1.8.4. SWOT Analysis
- 12.1.9 oOh!media Limited
- 12.1.9.1. Company Overview
- 12.1.9.2. Products
- 12.1.9.3. Company Financials
- 12.1.9.4. SWOT Analysis
- 12.1.10 SevenOne Media GmbH
- 12.1.10.1. Company Overview
- 12.1.10.2. Products
- 12.1.10.3. Company Financials
- 12.1.10.4. SWOT Analysis
- 12.1.11 Talon Outdoor Ltd
- 12.1.11.1. Company Overview
- 12.1.11.2. Products
- 12.1.11.3. Company Financials
- 12.1.11.4. SWOT Analysis
- 12.1.12 QMS Media Limited
- 12.1.12.1. Company Overview
- 12.1.12.2. Products
- 12.1.12.3. Company Financials
- 12.1.12.4. SWOT Analysis
- 12.1.13 Clear Channel Outdoor Holdings Inc
- 12.1.13.1. Company Overview
- 12.1.13.2. Products
- 12.1.13.3. Company Financials
- 12.1.13.4. SWOT Analysis
- 12.1.1 JCDecaux Group
- 12.2. Market Entropy
- 12.2.1 Company's Key Areas Served
- 12.2.2 Recent Developments
- 12.3. Company Market Share Analysis 2025
- 12.3.1 Top 5 Companies Market Share Analysis
- 12.3.2 Top 3 Companies Market Share Analysis
- 12.4. List of Potential Customers
- 13. Research Methodology
List of Figures
- Figure 1: Global Digital OOH Industry Revenue Breakdown (Million, %) by Region 2025 & 2033
- Figure 2: North America Digital OOH Industry Revenue (Million), by Application 2025 & 2033
- Figure 3: North America Digital OOH Industry Revenue Share (%), by Application 2025 & 2033
- Figure 4: North America Digital OOH Industry Revenue (Million), by End-User 2025 & 2033
- Figure 5: North America Digital OOH Industry Revenue Share (%), by End-User 2025 & 2033
- Figure 6: North America Digital OOH Industry Revenue (Million), by Country 2025 & 2033
- Figure 7: North America Digital OOH Industry Revenue Share (%), by Country 2025 & 2033
- Figure 8: Europe Digital OOH Industry Revenue (Million), by Application 2025 & 2033
- Figure 9: Europe Digital OOH Industry Revenue Share (%), by Application 2025 & 2033
- Figure 10: Europe Digital OOH Industry Revenue (Million), by End-User 2025 & 2033
- Figure 11: Europe Digital OOH Industry Revenue Share (%), by End-User 2025 & 2033
- Figure 12: Europe Digital OOH Industry Revenue (Million), by Country 2025 & 2033
- Figure 13: Europe Digital OOH Industry Revenue Share (%), by Country 2025 & 2033
- Figure 14: Asia Pacific Digital OOH Industry Revenue (Million), by Application 2025 & 2033
- Figure 15: Asia Pacific Digital OOH Industry Revenue Share (%), by Application 2025 & 2033
- Figure 16: Asia Pacific Digital OOH Industry Revenue (Million), by End-User 2025 & 2033
- Figure 17: Asia Pacific Digital OOH Industry Revenue Share (%), by End-User 2025 & 2033
- Figure 18: Asia Pacific Digital OOH Industry Revenue (Million), by Country 2025 & 2033
- Figure 19: Asia Pacific Digital OOH Industry Revenue Share (%), by Country 2025 & 2033
- Figure 20: Latin America Digital OOH Industry Revenue (Million), by Application 2025 & 2033
- Figure 21: Latin America Digital OOH Industry Revenue Share (%), by Application 2025 & 2033
- Figure 22: Latin America Digital OOH Industry Revenue (Million), by End-User 2025 & 2033
- Figure 23: Latin America Digital OOH Industry Revenue Share (%), by End-User 2025 & 2033
- Figure 24: Latin America Digital OOH Industry Revenue (Million), by Country 2025 & 2033
- Figure 25: Latin America Digital OOH Industry Revenue Share (%), by Country 2025 & 2033
- Figure 26: Middle East and Africa Digital OOH Industry Revenue (Million), by Application 2025 & 2033
- Figure 27: Middle East and Africa Digital OOH Industry Revenue Share (%), by Application 2025 & 2033
- Figure 28: Middle East and Africa Digital OOH Industry Revenue (Million), by End-User 2025 & 2033
- Figure 29: Middle East and Africa Digital OOH Industry Revenue Share (%), by End-User 2025 & 2033
- Figure 30: Middle East and Africa Digital OOH Industry Revenue (Million), by Country 2025 & 2033
- Figure 31: Middle East and Africa Digital OOH Industry Revenue Share (%), by Country 2025 & 2033
List of Tables
- Table 1: Global Digital OOH Industry Revenue Million Forecast, by Application 2020 & 2033
- Table 2: Global Digital OOH Industry Revenue Million Forecast, by End-User 2020 & 2033
- Table 3: Global Digital OOH Industry Revenue Million Forecast, by Region 2020 & 2033
- Table 4: Global Digital OOH Industry Revenue Million Forecast, by Application 2020 & 2033
- Table 5: Global Digital OOH Industry Revenue Million Forecast, by End-User 2020 & 2033
- Table 6: Global Digital OOH Industry Revenue Million Forecast, by Country 2020 & 2033
- Table 7: United States Digital OOH Industry Revenue (Million) Forecast, by Application 2020 & 2033
- Table 8: Canada Digital OOH Industry Revenue (Million) Forecast, by Application 2020 & 2033
- Table 9: Global Digital OOH Industry Revenue Million Forecast, by Application 2020 & 2033
- Table 10: Global Digital OOH Industry Revenue Million Forecast, by End-User 2020 & 2033
- Table 11: Global Digital OOH Industry Revenue Million Forecast, by Country 2020 & 2033
- Table 12: Germany Digital OOH Industry Revenue (Million) Forecast, by Application 2020 & 2033
- Table 13: United Kingdom Digital OOH Industry Revenue (Million) Forecast, by Application 2020 & 2033
- Table 14: Spain Digital OOH Industry Revenue (Million) Forecast, by Application 2020 & 2033
- Table 15: France Digital OOH Industry Revenue (Million) Forecast, by Application 2020 & 2033
- Table 16: Rest of Europe Digital OOH Industry Revenue (Million) Forecast, by Application 2020 & 2033
- Table 17: Global Digital OOH Industry Revenue Million Forecast, by Application 2020 & 2033
- Table 18: Global Digital OOH Industry Revenue Million Forecast, by End-User 2020 & 2033
- Table 19: Global Digital OOH Industry Revenue Million Forecast, by Country 2020 & 2033
- Table 20: China Digital OOH Industry Revenue (Million) Forecast, by Application 2020 & 2033
- Table 21: India Digital OOH Industry Revenue (Million) Forecast, by Application 2020 & 2033
- Table 22: Japan Digital OOH Industry Revenue (Million) Forecast, by Application 2020 & 2033
- Table 23: Singapore Digital OOH Industry Revenue (Million) Forecast, by Application 2020 & 2033
- Table 24: South Korea Digital OOH Industry Revenue (Million) Forecast, by Application 2020 & 2033
- Table 25: Rest of Asia Pacific Digital OOH Industry Revenue (Million) Forecast, by Application 2020 & 2033
- Table 26: Global Digital OOH Industry Revenue Million Forecast, by Application 2020 & 2033
- Table 27: Global Digital OOH Industry Revenue Million Forecast, by End-User 2020 & 2033
- Table 28: Global Digital OOH Industry Revenue Million Forecast, by Country 2020 & 2033
- Table 29: Brazil Digital OOH Industry Revenue (Million) Forecast, by Application 2020 & 2033
- Table 30: Mexico Digital OOH Industry Revenue (Million) Forecast, by Application 2020 & 2033
- Table 31: Chile Digital OOH Industry Revenue (Million) Forecast, by Application 2020 & 2033
- Table 32: Rest of Latin America Digital OOH Industry Revenue (Million) Forecast, by Application 2020 & 2033
- Table 33: Global Digital OOH Industry Revenue Million Forecast, by Application 2020 & 2033
- Table 34: Global Digital OOH Industry Revenue Million Forecast, by End-User 2020 & 2033
- Table 35: Global Digital OOH Industry Revenue Million Forecast, by Country 2020 & 2033
- Table 36: GCC Digital OOH Industry Revenue (Million) Forecast, by Application 2020 & 2033
- Table 37: South Africa Digital OOH Industry Revenue (Million) Forecast, by Application 2020 & 2033
- Table 38: Rest of Middle East and Africa Digital OOH Industry Revenue (Million) Forecast, by Application 2020 & 2033
Frequently Asked Questions
1. What is the projected Compound Annual Growth Rate (CAGR) of the Digital OOH Industry?
The projected CAGR is approximately 15.20%.
2. Which companies are prominent players in the Digital OOH Industry?
Key companies in the market include JCDecaux Group, Exterion Media Group, EyeMedia LLC*List Not Exhaustive, Stroer SE & Co KGaA, Daktronics Inc, The Times Group, BroadSign International LLC, OUTFRONT Media, oOh!media Limited, SevenOne Media GmbH, Talon Outdoor Ltd, QMS Media Limited, Clear Channel Outdoor Holdings Inc.
3. What are the main segments of the Digital OOH Industry?
The market segments include Application, End-User.
4. Can you provide details about the market size?
The market size is estimated to be USD 23.06 Million as of 2022.
5. What are some drivers contributing to market growth?
Increase in Public Transit Infrastructure; Increasing Adoption of Digital Screens; High Advertising Flexibility with Connected Screens.
6. What are the notable trends driving market growth?
Transit Accounts for a Significant Share of Digital OOH Market.
7. Are there any restraints impacting market growth?
High Installation and Maintenance Costs.
8. Can you provide examples of recent developments in the market?
June 2022 - JCDecaux has announced the launch of its programmatic DOOH product for the Brazilian market in collaboration with VIOOH. JCDecaux will be able to offer its customers efficient programmatic digital out-of-home campaigns on its premium screens across Brazil using the VIOOH platform, assisting brands in making meaningful connections with people and ensuring they get the most out of their media expenditures.
9. What pricing options are available for accessing the report?
Pricing options include single-user, multi-user, and enterprise licenses priced at USD 4750, USD 5250, and USD 8750 respectively.
10. Is the market size provided in terms of value or volume?
The market size is provided in terms of value, measured in Million.
11. Are there any specific market keywords associated with the report?
Yes, the market keyword associated with the report is "Digital OOH Industry," which aids in identifying and referencing the specific market segment covered.
12. How do I determine which pricing option suits my needs best?
The pricing options vary based on user requirements and access needs. Individual users may opt for single-user licenses, while businesses requiring broader access may choose multi-user or enterprise licenses for cost-effective access to the report.
13. Are there any additional resources or data provided in the Digital OOH Industry report?
While the report offers comprehensive insights, it's advisable to review the specific contents or supplementary materials provided to ascertain if additional resources or data are available.
14. How can I stay updated on further developments or reports in the Digital OOH Industry?
To stay informed about further developments, trends, and reports in the Digital OOH Industry, consider subscribing to industry newsletters, following relevant companies and organizations, or regularly checking reputable industry news sources and publications.
Methodology
Step 1 - Identification of Relevant Samples Size from Population Database


Step 2 - Approaches for Defining Global Market Size (Value, Volume* & Price*)

Note*: In applicable scenarios
Step 3 - Data Sources
Primary Research
- Web Analytics
- Survey Reports
- Research Institute
- Latest Research Reports
- Opinion Leaders
Secondary Research
- Annual Reports
- White Paper
- Latest Press Release
- Industry Association
- Paid Database
- Investor Presentations

Step 4 - Data Triangulation
Involves using different sources of information in order to increase the validity of a study
These sources are likely to be stakeholders in a program - participants, other researchers, program staff, other community members, and so on.
Then we put all data in single framework & apply various statistical tools to find out the dynamic on the market.
During the analysis stage, feedback from the stakeholder groups would be compared to determine areas of agreement as well as areas of divergence