

Key Insights
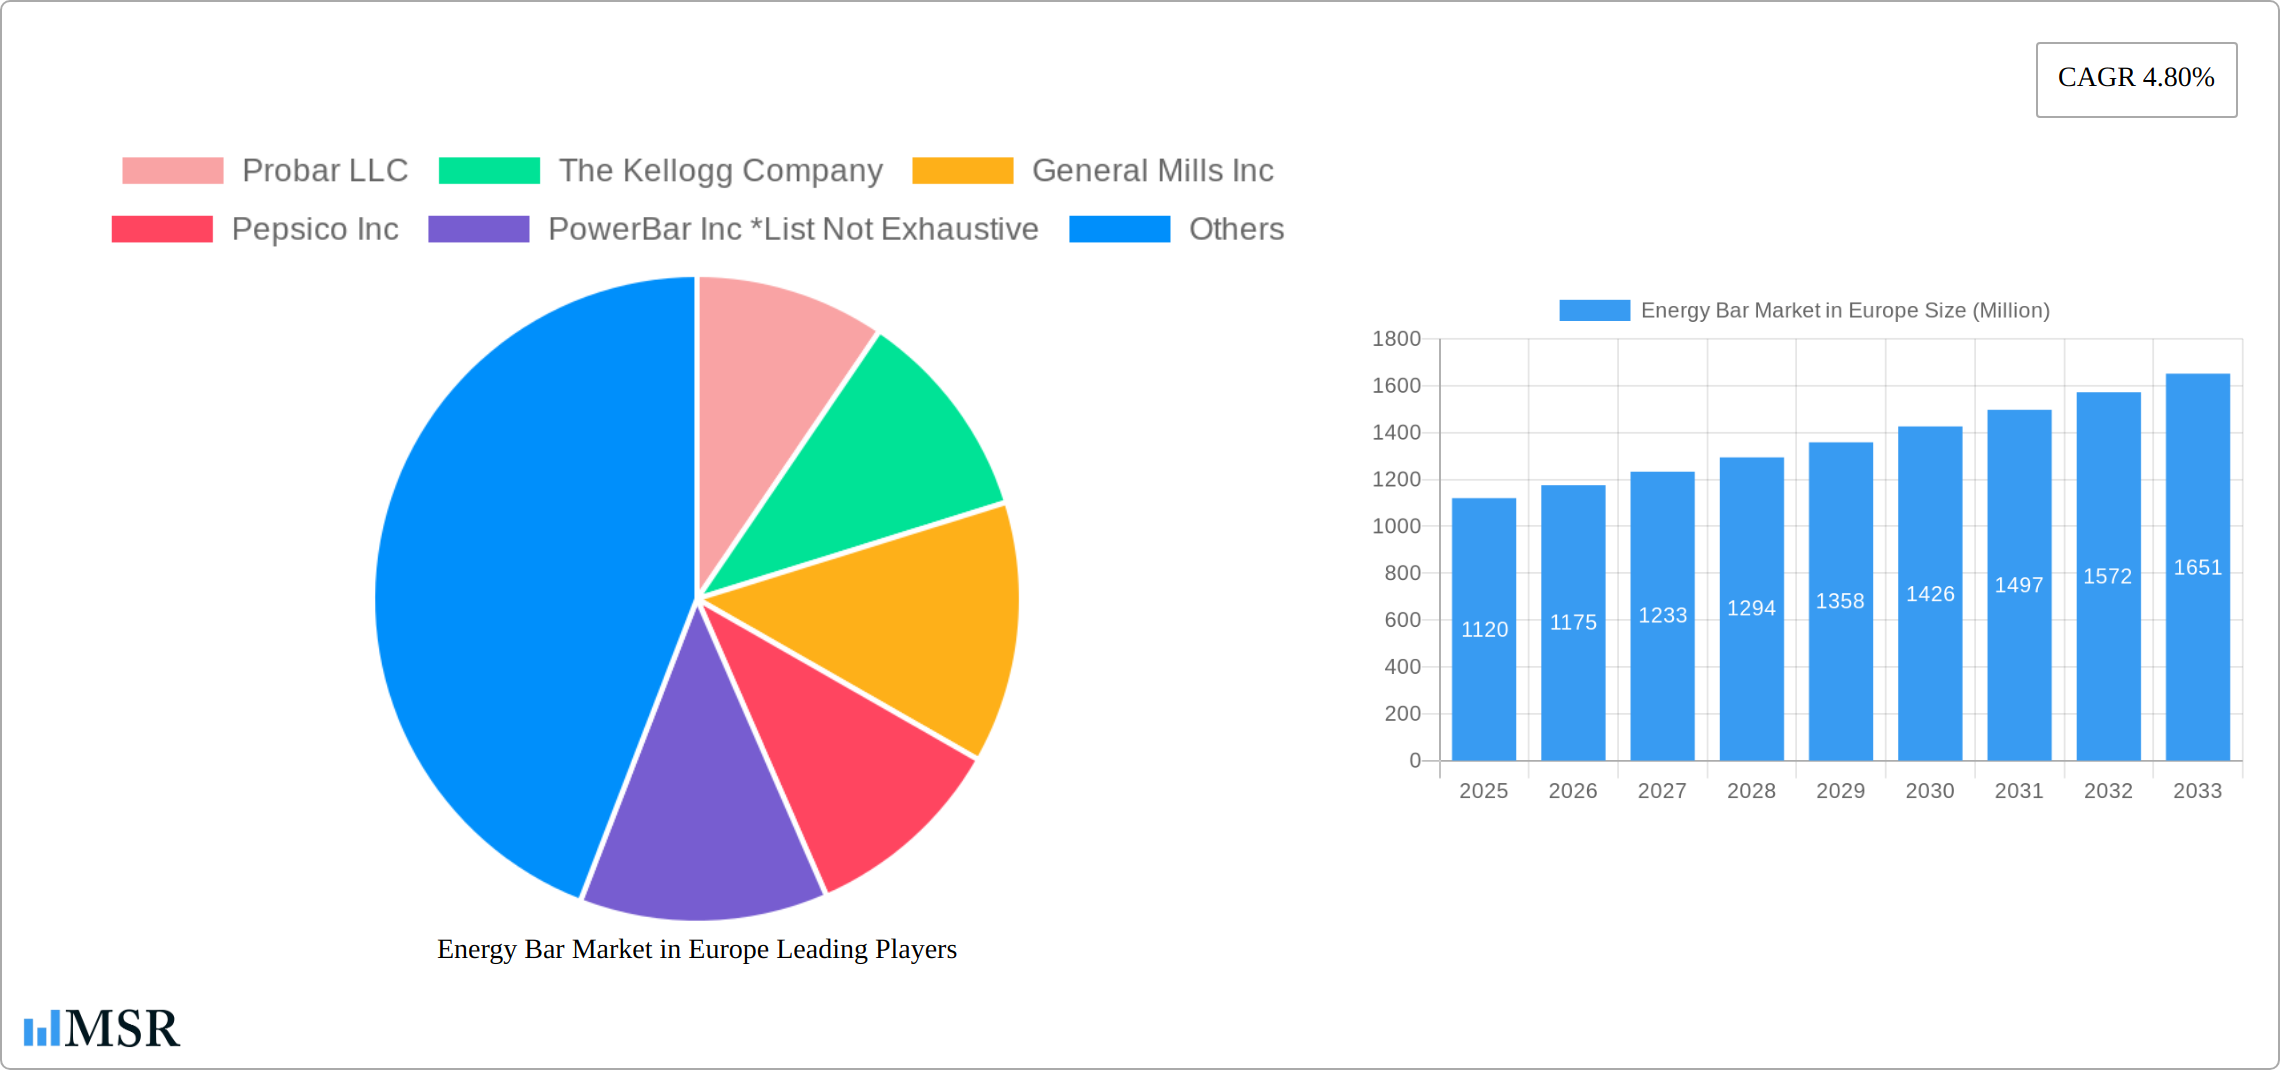
The European energy bar market, currently valued at approximately €1120 million in 2025, is projected to experience steady growth, driven by increasing health consciousness among consumers, the rising popularity of convenient and nutritious snack options, and the expanding fitness and sports nutrition sectors. The market's Compound Annual Growth Rate (CAGR) of 4.80% from 2025 to 2033 indicates a substantial increase in market size over the forecast period. Key distribution channels include supermarkets/hypermarkets, convenience stores, and online retail stores, reflecting the diverse consumer preferences and purchasing habits across Europe. Growth is further fueled by innovative product development, with manufacturers focusing on organic, gluten-free, and protein-rich options to cater to specific dietary needs and preferences. While the market faces some constraints like increased competition and fluctuating raw material prices, the overall trend points towards a positive outlook, particularly in regions with established health and fitness cultures like Germany, the UK, and France. Leading brands like Probar, Kellogg's, and General Mills are likely to remain key players, however, the market is expected to see increased competition from smaller, specialized brands focusing on niche segments and sustainable practices.
The consistent growth projection reflects the increasing integration of energy bars into daily routines, driven by their perceived convenience and health benefits. The market segmentation by distribution channel highlights the importance of a robust multi-channel strategy for brands to successfully penetrate the market. The regional focus on major European economies underscores the strategic importance of these markets as key contributors to overall market growth. Continued investment in research and development, coupled with effective marketing campaigns highlighting the benefits of energy bars within a healthy lifestyle, will likely be crucial factors driving future market expansion within the European context. The diverse range of existing brands suggests a dynamic competitive landscape, requiring both established players and emerging brands to adapt to evolving consumer demands and remain innovative in order to maintain a significant market share.
Energy Bar Market in Europe: A Comprehensive Report (2019-2033)
This in-depth report provides a comprehensive analysis of the Energy Bar Market in Europe, covering market dynamics, industry trends, key players, and future growth prospects. The study period spans from 2019 to 2033, with 2025 as the base and estimated year. This report is invaluable for industry stakeholders, investors, and strategic decision-makers seeking actionable insights into this dynamic market.
Energy Bar Market in Europe Market Concentration & Dynamics
This section analyzes the competitive landscape of the European energy bar market, assessing market concentration, innovation, regulatory frameworks, substitute products, end-user trends, and merger & acquisition (M&A) activities. The European energy bar market exhibits moderate concentration, with a few major players holding significant market share. However, a considerable number of smaller players and niche brands also contribute to the market's dynamism.
Market Concentration: The market share of the top five players is estimated at xx%, indicating a moderately consolidated market.
Innovation Ecosystem: The market demonstrates a robust innovation ecosystem, driven by the continuous introduction of new flavors, ingredients, and functional benefits. This includes the incorporation of organic, plant-based, and protein-rich ingredients.
Regulatory Framework: EU food safety regulations significantly impact the market, necessitating stringent compliance regarding labeling, ingredients, and manufacturing processes.
Substitute Products: The market faces competition from alternative snack options, such as protein shakes, fruit snacks, and nuts, thereby influencing consumer choices.
End-User Trends: Health-conscious consumers increasingly drive demand for energy bars with specific health benefits, such as high protein, low sugar, or specific vitamin contents.
M&A Activities: The number of M&A deals in the energy bar market in Europe averaged xx per year between 2019 and 2024. These activities often aim to enhance product portfolios, expand market reach, or increase brand visibility.
Energy Bar Market in Europe Industry Insights & Trends
This section delves into the key factors driving the growth of the European energy bar market. The market size is estimated at €xx Million in 2025 and is projected to reach €xx Million by 2033, exhibiting a Compound Annual Growth Rate (CAGR) of xx% during the forecast period (2025-2033). Several factors fuel this growth:
- Health and Wellness: The increasing focus on health and wellness among European consumers directly impacts the market's expansion.
- Convenience: The easy portability and convenience of energy bars cater to the busy lifestyles of consumers.
- Product Diversification: A wide variety of products catering to diverse dietary needs and preferences drives market expansion.
- Technological Advancements: Innovations in ingredients, packaging, and manufacturing processes further enhance the market's growth.
- Evolving Consumer Preferences: Growing demand for healthier, functional foods fuels sustained market growth.

Key Markets & Segments Leading Energy Bar Market in Europe
This section identifies the key geographic regions and distribution channels driving the energy bar market in Europe.
Dominant Segment: Supermarkets/Hypermarkets constitute the largest distribution channel, commanding a xx% market share in 2025. This dominance is attributed to widespread accessibility and extensive product offerings.
Drivers for Supermarkets/Hypermarkets Dominance:
- Extensive Reach: Widespread presence across Europe provides unparalleled reach to consumers.
- Strong Brand Presence: Established energy bar brands have strong shelf space in major supermarkets, supporting sales.
- Promotional Activities: Supermarkets engage in frequent promotional activities, boosting sales volume.
Other Distribution Channels: Convenience stores, specialist stores, and online retail stores also contribute significantly to the overall market, albeit with smaller market shares compared to supermarkets/hypermarkets. The online channel is witnessing robust growth, fueled by increased internet penetration and e-commerce adoption.
Energy Bar Market in Europe Product Developments
Recent years have witnessed significant innovation in the European energy bar market. Manufacturers continually introduce new products featuring organic ingredients, unique flavor combinations, and functional benefits catering to specific dietary needs, such as vegan, keto, or high-protein options. These developments enhance product appeal and competitiveness. Technological advancements in processing and packaging techniques have also improved product shelf life and quality.
Challenges in the Energy Bar Market in Europe Market
The energy bar market in Europe faces several challenges, including intense competition, fluctuating raw material prices, and stringent regulatory compliance requirements. These challenges exert pressure on profit margins and hinder market expansion. Supply chain disruptions, as witnessed in recent years, have impacted production and distribution, resulting in decreased availability and increased prices.
Forces Driving Energy Bar Market in Europe Growth
The European energy bar market is expected to experience continuous growth driven by increasing consumer awareness of health and wellness, coupled with the convenience and portability of energy bars. Government initiatives promoting healthy lifestyles also support market growth. Furthermore, the rise of e-commerce platforms and the increasing adoption of online grocery shopping present significant opportunities for market expansion.
Challenges in the Energy Bar Market in Europe Market
Long-term growth in the energy bar market relies on adapting to evolving consumer preferences and technological advancements. Strategic partnerships and collaborations among manufacturers and retailers are crucial for enhancing distribution and expanding market reach. Furthermore, investing in research and development to create innovative, healthy, and sustainable products is essential for long-term growth.
Emerging Opportunities in Energy Bar Market in Europe
The growing popularity of plant-based diets, coupled with the demand for high-protein and functional foods, creates significant opportunities for new product development. Furthermore, tapping into niche markets catering to specific dietary restrictions or preferences (such as gluten-free or keto-friendly bars) provides additional growth avenues. The development of sustainable and environmentally friendly packaging solutions will increasingly become a key differentiator.
Leading Players in the Energy Bar Market in Europe Sector
- Probar LLC
- The Kellogg Company
- General Mills Inc
- Pepsico Inc
- PowerBar Inc
- QuestNutrition LLC
- Oatein
- Clif Bar & Company
- Nestlé S.A.
- Mars, Incorporated
Key Milestones in Energy Bar Market in Europe Industry
- 2022: Clif Bar & Company acquires a majority stake in Bioenergy, expanding its European presence.
- 2021: Launch of several new energy bars with organic and plant-based ingredients by leading manufacturers.
- 2020: Increased focus on sustainability and environmentally friendly packaging by several key players.
- 2019: Several mergers and acquisitions among smaller energy bar manufacturers.
Strategic Outlook for Energy Bar Market in Europe Market
The European energy bar market is poised for substantial growth in the coming years, driven by favorable consumer trends and technological advancements. Focusing on product innovation, sustainable practices, and strategic partnerships will be vital for companies to thrive in this competitive market. Expanding into new geographic areas and exploring emerging distribution channels will also contribute to future market success. The market's future growth will largely depend on the ability of companies to adapt to changing consumer demands and maintain a strong competitive edge.
Energy Bar Market in Europe Segmentation
-
1. Distribution Channel
- 1.1. Supermarkets/Hypermarkets
- 1.2. Convenience Stores
- 1.3. Specialist stores
- 1.4. Online Retail Stores
- 1.5. Other Distribution Channels
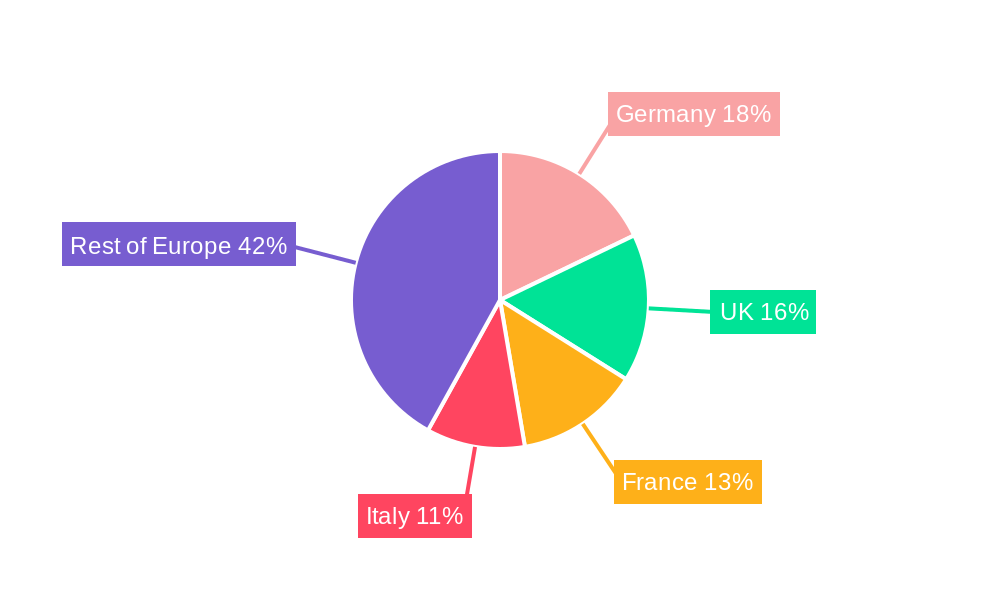
Energy Bar Market in Europe Segmentation By Geography
-
1. Europe
- 1.1. Spain
- 1.2. United Kingdom
- 1.3. Germany
- 1.4. France
- 1.5. Italy
- 1.6. Russia
- 1.7. Rest of Europe
Energy Bar Market in Europe REPORT HIGHLIGHTS
| Aspects | Details |
|---|---|
| Study Period | 2019-2033 |
| Base Year | 2024 |
| Estimated Year | 2025 |
| Forecast Period | 2025-2033 |
| Historical Period | 2019-2024 |
| Growth Rate | CAGR of 4.80% from 2019-2033 |
| Segmentation |
|
Table of Contents
- 1. Introduction
- 1.1. Research Scope
- 1.2. Market Segmentation
- 1.3. Research Methodology
- 1.4. Definitions and Assumptions
- 2. Executive Summary
- 2.1. Introduction
- 3. Market Dynamics
- 3.1. Introduction
- 3.2. Market Drivers
- 3.2.1. Increasing Demand for Clean Label Ingredients; Growing Health Consciousness of Consumers
- 3.3. Market Restrains
- 3.3.1. Higher Manufacturing Cost
- 3.4. Market Trends
- 3.4.1. United Kingdom Dominating the Market
- 4. Market Factor Analysis
- 4.1. Porters Five Forces
- 4.2. Supply/Value Chain
- 4.3. PESTEL analysis
- 4.4. Market Entropy
- 4.5. Patent/Trademark Analysis
- 5. Energy Bar Market in Europe Analysis, Insights and Forecast, 2019-2031
- 5.1. Market Analysis, Insights and Forecast - by Distribution Channel
- 5.1.1. Supermarkets/Hypermarkets
- 5.1.2. Convenience Stores
- 5.1.3. Specialist stores
- 5.1.4. Online Retail Stores
- 5.1.5. Other Distribution Channels
- 5.2. Market Analysis, Insights and Forecast - by Region
- 5.2.1. Europe
- 5.1. Market Analysis, Insights and Forecast - by Distribution Channel
- 6. Germany Energy Bar Market in Europe Analysis, Insights and Forecast, 2019-2031
- 7. France Energy Bar Market in Europe Analysis, Insights and Forecast, 2019-2031
- 8. Italy Energy Bar Market in Europe Analysis, Insights and Forecast, 2019-2031
- 9. United Kingdom Energy Bar Market in Europe Analysis, Insights and Forecast, 2019-2031
- 10. Netherlands Energy Bar Market in Europe Analysis, Insights and Forecast, 2019-2031
- 11. Sweden Energy Bar Market in Europe Analysis, Insights and Forecast, 2019-2031
- 12. Rest of Europe Energy Bar Market in Europe Analysis, Insights and Forecast, 2019-2031
- 13. Competitive Analysis
- 13.1. Market Share Analysis 2024
- 13.2. Company Profiles
- 13.2.1 Probar LLC
- 13.2.1.1. Overview
- 13.2.1.2. Products
- 13.2.1.3. SWOT Analysis
- 13.2.1.4. Recent Developments
- 13.2.1.5. Financials (Based on Availability)
- 13.2.2 The Kellogg Company
- 13.2.2.1. Overview
- 13.2.2.2. Products
- 13.2.2.3. SWOT Analysis
- 13.2.2.4. Recent Developments
- 13.2.2.5. Financials (Based on Availability)
- 13.2.3 General Mills Inc
- 13.2.3.1. Overview
- 13.2.3.2. Products
- 13.2.3.3. SWOT Analysis
- 13.2.3.4. Recent Developments
- 13.2.3.5. Financials (Based on Availability)
- 13.2.4 Pepsico Inc
- 13.2.4.1. Overview
- 13.2.4.2. Products
- 13.2.4.3. SWOT Analysis
- 13.2.4.4. Recent Developments
- 13.2.4.5. Financials (Based on Availability)
- 13.2.5 PowerBar Inc *List Not Exhaustive
- 13.2.5.1. Overview
- 13.2.5.2. Products
- 13.2.5.3. SWOT Analysis
- 13.2.5.4. Recent Developments
- 13.2.5.5. Financials (Based on Availability)
- 13.2.6 QuestNutrition LLC
- 13.2.6.1. Overview
- 13.2.6.2. Products
- 13.2.6.3. SWOT Analysis
- 13.2.6.4. Recent Developments
- 13.2.6.5. Financials (Based on Availability)
- 13.2.7 Oatein
- 13.2.7.1. Overview
- 13.2.7.2. Products
- 13.2.7.3. SWOT Analysis
- 13.2.7.4. Recent Developments
- 13.2.7.5. Financials (Based on Availability)
- 13.2.8 Clif Bar & Company
- 13.2.8.1. Overview
- 13.2.8.2. Products
- 13.2.8.3. SWOT Analysis
- 13.2.8.4. Recent Developments
- 13.2.8.5. Financials (Based on Availability)
- 13.2.9 Nestlé S.A.
- 13.2.9.1. Overview
- 13.2.9.2. Products
- 13.2.9.3. SWOT Analysis
- 13.2.9.4. Recent Developments
- 13.2.9.5. Financials (Based on Availability)
- 13.2.10 Mars Incorporated
- 13.2.10.1. Overview
- 13.2.10.2. Products
- 13.2.10.3. SWOT Analysis
- 13.2.10.4. Recent Developments
- 13.2.10.5. Financials (Based on Availability)
- 13.2.1 Probar LLC
List of Figures
- Figure 1: Energy Bar Market in Europe Revenue Breakdown (Million, %) by Product 2024 & 2032
- Figure 2: Energy Bar Market in Europe Share (%) by Company 2024
List of Tables
- Table 1: Energy Bar Market in Europe Revenue Million Forecast, by Region 2019 & 2032
- Table 2: Energy Bar Market in Europe Volume K Tons Forecast, by Region 2019 & 2032
- Table 3: Energy Bar Market in Europe Revenue Million Forecast, by Distribution Channel 2019 & 2032
- Table 4: Energy Bar Market in Europe Volume K Tons Forecast, by Distribution Channel 2019 & 2032
- Table 5: Energy Bar Market in Europe Revenue Million Forecast, by Region 2019 & 2032
- Table 6: Energy Bar Market in Europe Volume K Tons Forecast, by Region 2019 & 2032
- Table 7: Energy Bar Market in Europe Revenue Million Forecast, by Country 2019 & 2032
- Table 8: Energy Bar Market in Europe Volume K Tons Forecast, by Country 2019 & 2032
- Table 9: Germany Energy Bar Market in Europe Revenue (Million) Forecast, by Application 2019 & 2032
- Table 10: Germany Energy Bar Market in Europe Volume (K Tons) Forecast, by Application 2019 & 2032
- Table 11: France Energy Bar Market in Europe Revenue (Million) Forecast, by Application 2019 & 2032
- Table 12: France Energy Bar Market in Europe Volume (K Tons) Forecast, by Application 2019 & 2032
- Table 13: Italy Energy Bar Market in Europe Revenue (Million) Forecast, by Application 2019 & 2032
- Table 14: Italy Energy Bar Market in Europe Volume (K Tons) Forecast, by Application 2019 & 2032
- Table 15: United Kingdom Energy Bar Market in Europe Revenue (Million) Forecast, by Application 2019 & 2032
- Table 16: United Kingdom Energy Bar Market in Europe Volume (K Tons) Forecast, by Application 2019 & 2032
- Table 17: Netherlands Energy Bar Market in Europe Revenue (Million) Forecast, by Application 2019 & 2032
- Table 18: Netherlands Energy Bar Market in Europe Volume (K Tons) Forecast, by Application 2019 & 2032
- Table 19: Sweden Energy Bar Market in Europe Revenue (Million) Forecast, by Application 2019 & 2032
- Table 20: Sweden Energy Bar Market in Europe Volume (K Tons) Forecast, by Application 2019 & 2032
- Table 21: Rest of Europe Energy Bar Market in Europe Revenue (Million) Forecast, by Application 2019 & 2032
- Table 22: Rest of Europe Energy Bar Market in Europe Volume (K Tons) Forecast, by Application 2019 & 2032
- Table 23: Energy Bar Market in Europe Revenue Million Forecast, by Distribution Channel 2019 & 2032
- Table 24: Energy Bar Market in Europe Volume K Tons Forecast, by Distribution Channel 2019 & 2032
- Table 25: Energy Bar Market in Europe Revenue Million Forecast, by Country 2019 & 2032
- Table 26: Energy Bar Market in Europe Volume K Tons Forecast, by Country 2019 & 2032
- Table 27: Spain Energy Bar Market in Europe Revenue (Million) Forecast, by Application 2019 & 2032
- Table 28: Spain Energy Bar Market in Europe Volume (K Tons) Forecast, by Application 2019 & 2032
- Table 29: United Kingdom Energy Bar Market in Europe Revenue (Million) Forecast, by Application 2019 & 2032
- Table 30: United Kingdom Energy Bar Market in Europe Volume (K Tons) Forecast, by Application 2019 & 2032
- Table 31: Germany Energy Bar Market in Europe Revenue (Million) Forecast, by Application 2019 & 2032
- Table 32: Germany Energy Bar Market in Europe Volume (K Tons) Forecast, by Application 2019 & 2032
- Table 33: France Energy Bar Market in Europe Revenue (Million) Forecast, by Application 2019 & 2032
- Table 34: France Energy Bar Market in Europe Volume (K Tons) Forecast, by Application 2019 & 2032
- Table 35: Italy Energy Bar Market in Europe Revenue (Million) Forecast, by Application 2019 & 2032
- Table 36: Italy Energy Bar Market in Europe Volume (K Tons) Forecast, by Application 2019 & 2032
- Table 37: Russia Energy Bar Market in Europe Revenue (Million) Forecast, by Application 2019 & 2032
- Table 38: Russia Energy Bar Market in Europe Volume (K Tons) Forecast, by Application 2019 & 2032
- Table 39: Rest of Europe Energy Bar Market in Europe Revenue (Million) Forecast, by Application 2019 & 2032
- Table 40: Rest of Europe Energy Bar Market in Europe Volume (K Tons) Forecast, by Application 2019 & 2032
Frequently Asked Questions
1. What is the projected Compound Annual Growth Rate (CAGR) of the Energy Bar Market in Europe?
The projected CAGR is approximately 4.80%.
2. Which companies are prominent players in the Energy Bar Market in Europe?
Key companies in the market include Probar LLC, The Kellogg Company, General Mills Inc, Pepsico Inc, PowerBar Inc *List Not Exhaustive, QuestNutrition LLC, Oatein, Clif Bar & Company, Nestlé S.A. , Mars, Incorporated.
3. What are the main segments of the Energy Bar Market in Europe?
The market segments include Distribution Channel.
4. Can you provide details about the market size?
The market size is estimated to be USD 1120 Million as of 2022.
5. What are some drivers contributing to market growth?
Increasing Demand for Clean Label Ingredients; Growing Health Consciousness of Consumers.
6. What are the notable trends driving market growth?
United Kingdom Dominating the Market.
7. Are there any restraints impacting market growth?
Higher Manufacturing Cost.
8. Can you provide examples of recent developments in the market?
Recent developments in the Energy Bar Market in Europe include product launches, mergers and acquisitions, and strategic partnerships. For instance, in 2022, Clif Bar & Company acquired a majority stake in UK-based energy bar manufacturer, Bioenergy. This acquisition expanded Clif Bar's presence in the European market and strengthened its product portfolio.
9. What pricing options are available for accessing the report?
Pricing options include single-user, multi-user, and enterprise licenses priced at USD 4750, USD 5250, and USD 8750 respectively.
10. Is the market size provided in terms of value or volume?
The market size is provided in terms of value, measured in Million and volume, measured in K Tons.
11. Are there any specific market keywords associated with the report?
Yes, the market keyword associated with the report is "Energy Bar Market in Europe," which aids in identifying and referencing the specific market segment covered.
12. How do I determine which pricing option suits my needs best?
The pricing options vary based on user requirements and access needs. Individual users may opt for single-user licenses, while businesses requiring broader access may choose multi-user or enterprise licenses for cost-effective access to the report.
13. Are there any additional resources or data provided in the Energy Bar Market in Europe report?
While the report offers comprehensive insights, it's advisable to review the specific contents or supplementary materials provided to ascertain if additional resources or data are available.
14. How can I stay updated on further developments or reports in the Energy Bar Market in Europe?
To stay informed about further developments, trends, and reports in the Energy Bar Market in Europe, consider subscribing to industry newsletters, following relevant companies and organizations, or regularly checking reputable industry news sources and publications.
Methodology
Step 1 - Identification of Relevant Samples Size from Population Database


Step 2 - Approaches for Defining Global Market Size (Value, Volume* & Price*)

Note*: In applicable scenarios
Step 3 - Data Sources
Primary Research
- Web Analytics
- Survey Reports
- Research Institute
- Latest Research Reports
- Opinion Leaders
Secondary Research
- Annual Reports
- White Paper
- Latest Press Release
- Industry Association
- Paid Database
- Investor Presentations

Step 4 - Data Triangulation
Involves using different sources of information in order to increase the validity of a study
These sources are likely to be stakeholders in a program - participants, other researchers, program staff, other community members, and so on.
Then we put all data in single framework & apply various statistical tools to find out the dynamic on the market.
During the analysis stage, feedback from the stakeholder groups would be compared to determine areas of agreement as well as areas of divergence
