

Key Insights
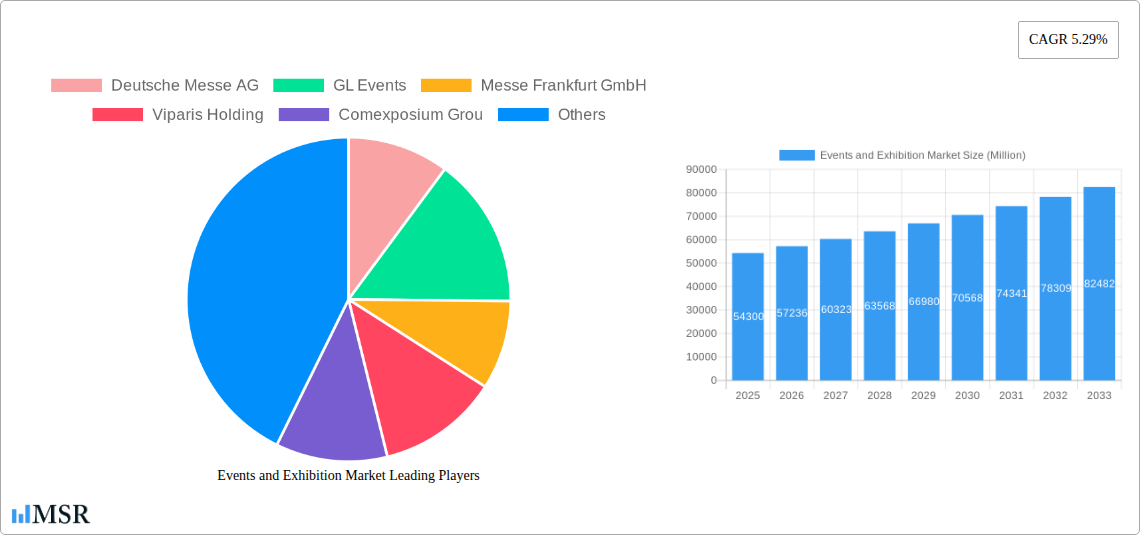
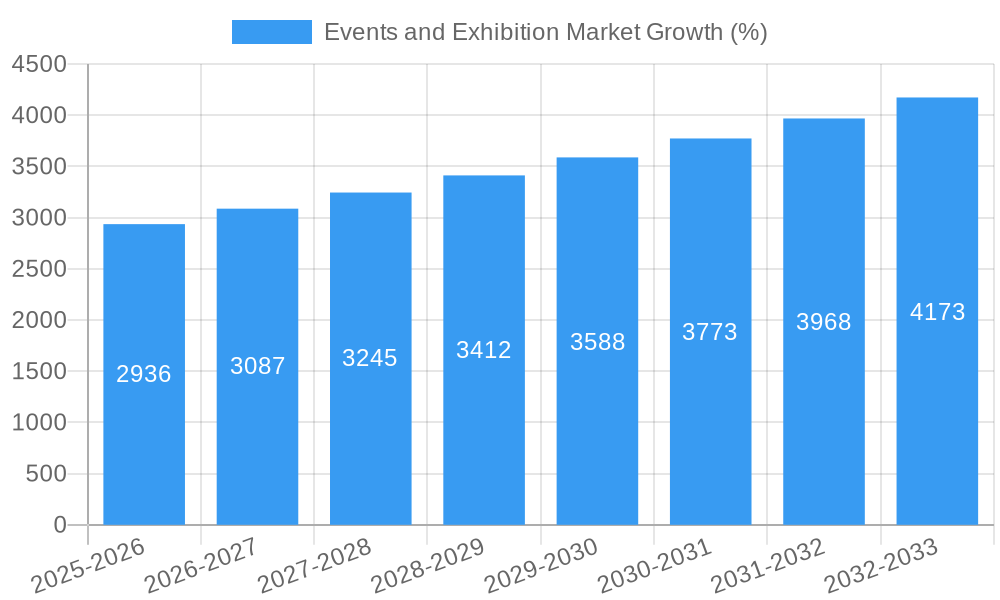
The global events and exhibition market, valued at $54.30 billion in 2025, is projected to experience robust growth, driven by a Compound Annual Growth Rate (CAGR) of 5.29% from 2025 to 2033. This expansion is fueled by several key factors. Firstly, the increasing adoption of hybrid and virtual event formats caters to broader audiences and offers cost-effective solutions for both organizers and attendees. Secondly, the resurgence of in-person events post-pandemic, coupled with a growing preference for experiential marketing, is significantly boosting market demand across various sectors. The B2B segment currently holds a dominant market share, largely driven by the need for professional networking and product launches. However, the B2C segment is witnessing accelerated growth, fueled by increasing consumer spending and the popularity of trade shows and consumer exhibitions. Furthermore, diversification of revenue streams, including sponsorship fees and service offerings beyond basic exhibitor spaces, is contributing to overall market expansion. Geographically, North America and Europe currently represent the largest market segments, but the Asia-Pacific region is poised for significant growth due to rapid economic development and increasing urbanization. The robust growth in emerging economies also contributes to the overall market expansion.
The competitive landscape is characterized by both large multinational players like Deutsche Messe AG, Messe Frankfurt GmbH, and GL Events, and regional players catering to specific market niches. These companies are constantly innovating to enhance their offerings, including advanced technologies for virtual and hybrid events and improved logistics and infrastructure for in-person events. However, economic uncertainties, fluctuating geopolitical situations, and potential future pandemic-related disruptions pose challenges to sustained market growth. The market segmentation by end-user sector reveals strong demand from consumer goods, automotive, industrial, and real estate sectors, highlighting the diverse applications of events and exhibitions across various industries. Strategic partnerships and acquisitions are expected to play a vital role in shaping the market's future landscape. Sustained growth hinges on ongoing adaptation to evolving technological trends and the capacity to provide value-added services that enhance the overall event experience.
Events and Exhibition Market Report: 2019-2033 Forecast
This comprehensive report provides an in-depth analysis of the global Events and Exhibition Market, projecting a market size of $XX Million by 2033. The study period spans 2019-2033, with 2025 serving as the base year and the forecast period covering 2025-2033. Discover key insights into market dynamics, leading players like Deutsche Messe AG, GL Events, and Messe Frankfurt GmbH, and emerging trends shaping this dynamic sector.
Events and Exhibition Market Market Concentration & Dynamics
The global events and exhibition market is moderately concentrated, with a handful of major players holding significant market share. Deutsche Messe AG, Messe Frankfurt GmbH, and GL Events are among the leading players, commanding a combined market share of approximately xx%. However, the market also features numerous smaller players and regional specialists, fostering a competitive landscape.
Market Concentration Metrics:
- Top 3 players market share: xx% (estimated)
- Top 5 players market share: xx% (estimated)
- Number of M&A deals (2019-2024): xx
The market is characterized by continuous innovation, driven by technological advancements in event management software, virtual and hybrid event platforms, and data analytics. Regulatory frameworks vary across regions, influencing operational costs and event formats. Substitute products, such as webinars and online conferences, pose a challenge, but the inherent value of in-person networking and experiential marketing continues to drive demand for physical events. Significant end-user trends include increased focus on sustainability and the growing adoption of data-driven strategies for event optimization. The recent merger between EventWorks and Quest Events exemplifies the ongoing M&A activity, aiming to consolidate market share and expand service offerings.
Events and Exhibition Market Industry Insights & Trends
The global events and exhibition market is experiencing robust growth, driven by several key factors. The market size was valued at $XX Million in 2024 and is projected to reach $XX Million by 2033, exhibiting a CAGR of xx% during the forecast period. Strong economic growth in several regions fuels increased corporate spending on events and exhibitions. Technological advancements, including virtual and hybrid event platforms, are expanding market reach and accessibility. Evolving consumer behaviors, characterized by a demand for engaging and interactive experiences, drive innovation within the industry. Furthermore, the increasing focus on sustainability and responsible event management further shapes the market trajectory. The market's growth is also influenced by the increasing adoption of event management technologies, data-driven decision making, and the creation of tailored events to meet specific industry needs.
Key Markets & Segments Leading Events and Exhibition Market
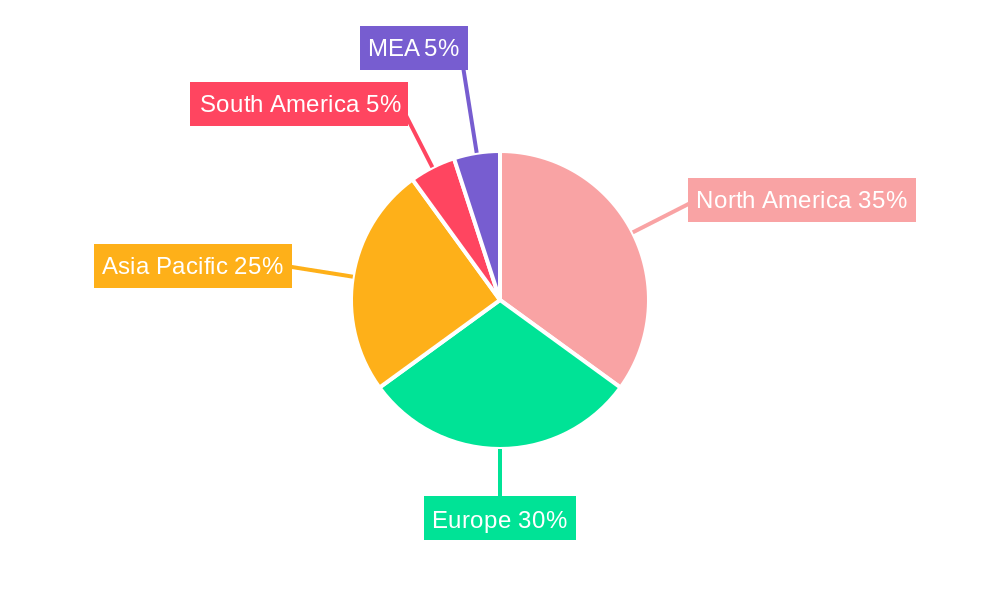
The North American and European markets currently dominate the global events and exhibition sector, followed by the Asia-Pacific region. Within market segments, B2B events hold the largest share, owing to the importance of professional networking and business development. However, B2C events are also experiencing significant growth, driven by consumer demand for entertainment and lifestyle experiences. Mixed/Hybrid events are gaining traction, offering flexibility and reaching broader audiences.
Dominant Segments and Drivers:
- By Type: B2B events hold the largest market share. Drivers include: robust economic growth, increasing business collaborations, and professional networking needs.
- By Revenue Stream: Exhibitor fees remain the primary revenue source, followed by sponsorship fees and entrance fees. The services segment is showing steady growth.
- By End User: Consumer Goods and Retail, Automotive, and Industrial sectors are major contributors, driven by product launches, marketing campaigns, and trade shows. The Entertainment sector is also showing substantial growth.
Dominance Analysis:
North America's dominance stems from a mature market with a high concentration of major players and a strong business event culture. Europe follows a similar pattern. The Asia-Pacific region exhibits significant growth potential due to rapid economic development and increasing corporate investment in events.
Events and Exhibition Market Product Developments
Significant innovations are reshaping the events and exhibition landscape. The rise of virtual and hybrid events, leveraging advanced technologies for immersive experiences and enhanced audience engagement, is a major development. Data analytics platforms are being integrated to optimize event planning, attendee targeting, and post-event analysis. Furthermore, sustainable practices are increasingly incorporated into event design and execution, addressing environmental concerns. These advancements are enhancing efficiency, reach, and the overall value proposition of events and exhibitions.
Challenges in the Events and Exhibition Market Market
The industry faces challenges, including fluctuating economic conditions, which can directly impact event budgets and attendance. Supply chain disruptions can affect event logistics and costs. Increasing competition, coupled with the rise of substitute products, requires continuous innovation and adaptation. Regulatory compliance and securing necessary permits and licenses in various regions can also present obstacles. These challenges necessitate strategic planning and adaptability to ensure continued success in the market.
Forces Driving Events and Exhibition Market Growth
Technological advancements, such as virtual and hybrid event platforms, are expanding market reach and accessibility. Strong economic growth fuels increased corporate and consumer spending on events and exhibitions. Supportive regulatory frameworks in some regions are encouraging market expansion. The increasing focus on data-driven decision making in event planning further enhances efficiency and return on investment. Examples include the growing adoption of event management software and the utilization of data analytics to refine marketing strategies.
Challenges in the Events and Exhibition Market Market
Long-term growth will be fueled by continued innovation in event formats and technologies, strategic partnerships among players to create comprehensive service offerings, and expansion into new geographic markets. Leveraging data analytics for improved event ROI will also play a crucial role. The focus on sustainability and responsible event management is further enhancing the long-term viability of the market.
Emerging Opportunities in Events and Exhibition Market
Emerging opportunities lie in the expansion of virtual and hybrid event formats, the integration of immersive technologies such as augmented and virtual reality, and the development of niche events targeting specific industries or demographics. The growing demand for personalized and experiential events offers significant growth potential. Furthermore, the incorporation of data-driven insights for better event planning and optimization presents a promising avenue for market expansion.
Leading Players in the Events and Exhibition Market Sector
- Deutsche Messe AG
- GL Events
- Messe Frankfurt GmbH
- Viparis Holding
- Comexposium Group
- Koelnmesse GmbH
- Messe Düsseldorf GmbH
- Percept Limited
- Fiera Milano SpA
- MCH Group AG
Key Milestones in Events and Exhibition Market Industry
- November 2023: Art Design Chicago showcases the power of citywide collaborations in driving artistic events and exhibitions. This highlights the growing importance of community engagement and local partnerships in the events sector.
- November 2023: The merger of EventWorks and Quest Events signifies consolidation within the event services market, expanding service offerings and reach for clients. This points towards a trend of mergers and acquisitions to improve market share and offer comprehensive event solutions.
Strategic Outlook for Events and Exhibition Market Market
The future of the events and exhibition market is bright, driven by continuous innovation, technological advancements, and a strong focus on delivering engaging experiences. Strategic partnerships, expansion into new markets, and the adoption of sustainable practices are critical for long-term success. The market's potential for growth is significant, driven by an increasing demand for both physical and virtual event experiences, and the ability to adapt and meet the changing preferences of attendees and exhibitors.
Events and Exhibition Market Segmentation
-
1. Type
- 1.1. B2B
- 1.2. B2C
- 1.3. Mixed/Hybrid
-
2. Revenue Stream
- 2.1. Exhibitor Fee
- 2.2. Sponsorship Fee
- 2.3. Entrance Fee
- 2.4. Services
-
3. End User
- 3.1. Consumer Goods and Retail Sector
- 3.2. Automotive and Transportation Sector
- 3.3. Industrial
- 3.4. Entertainment
- 3.5. Real Estate and Property
- 3.6. Hospitality Sector
- 3.7. Other End Users
Events and Exhibition Market Segmentation By Geography
-
1. North America
- 1.1. United States
- 1.2. Canada
-
2. Europe
- 2.1. Germany
- 2.2. United Kingdom
- 2.3. France
-
3. Asia Pacific
- 3.1. China
- 3.2. Japan
- 3.3. India
- 3.4. South Korea
- 3.5. Australia and New Zealand
- 4. Latin America
- 5. Middle East and Africa
Events and Exhibition Market REPORT HIGHLIGHTS
| Aspects | Details |
|---|---|
| Study Period | 2019-2033 |
| Base Year | 2024 |
| Estimated Year | 2025 |
| Forecast Period | 2025-2033 |
| Historical Period | 2019-2024 |
| Growth Rate | CAGR of 5.29% from 2019-2033 |
| Segmentation |
|
Table of Contents
- 1. Introduction
- 1.1. Research Scope
- 1.2. Market Segmentation
- 1.3. Research Methodology
- 1.4. Definitions and Assumptions
- 2. Executive Summary
- 2.1. Introduction
- 3. Market Dynamics
- 3.1. Introduction
- 3.2. Market Drivers
- 3.2.1. Growing Adoption of Geo-Cloning for Exhibition Organizers; Increasing Growth of Consumer Goods Penetrates the Growth of B2C Exhibition
- 3.3. Market Restrains
- 3.3.1. Loss Due to Restrictions of Smaller Players to Participate Owing to Potential Low Turnouts
- 3.4. Market Trends
- 3.4.1. Entertainment Sector to Witness Fastest Growth
- 4. Market Factor Analysis
- 4.1. Porters Five Forces
- 4.2. Supply/Value Chain
- 4.3. PESTEL analysis
- 4.4. Market Entropy
- 4.5. Patent/Trademark Analysis
- 5. Global Events and Exhibition Market Analysis, Insights and Forecast, 2019-2031
- 5.1. Market Analysis, Insights and Forecast - by Type
- 5.1.1. B2B
- 5.1.2. B2C
- 5.1.3. Mixed/Hybrid
- 5.2. Market Analysis, Insights and Forecast - by Revenue Stream
- 5.2.1. Exhibitor Fee
- 5.2.2. Sponsorship Fee
- 5.2.3. Entrance Fee
- 5.2.4. Services
- 5.3. Market Analysis, Insights and Forecast - by End User
- 5.3.1. Consumer Goods and Retail Sector
- 5.3.2. Automotive and Transportation Sector
- 5.3.3. Industrial
- 5.3.4. Entertainment
- 5.3.5. Real Estate and Property
- 5.3.6. Hospitality Sector
- 5.3.7. Other End Users
- 5.4. Market Analysis, Insights and Forecast - by Region
- 5.4.1. North America
- 5.4.2. Europe
- 5.4.3. Asia Pacific
- 5.4.4. Latin America
- 5.4.5. Middle East and Africa
- 5.1. Market Analysis, Insights and Forecast - by Type
- 6. North America Events and Exhibition Market Analysis, Insights and Forecast, 2019-2031
- 6.1. Market Analysis, Insights and Forecast - by Type
- 6.1.1. B2B
- 6.1.2. B2C
- 6.1.3. Mixed/Hybrid
- 6.2. Market Analysis, Insights and Forecast - by Revenue Stream
- 6.2.1. Exhibitor Fee
- 6.2.2. Sponsorship Fee
- 6.2.3. Entrance Fee
- 6.2.4. Services
- 6.3. Market Analysis, Insights and Forecast - by End User
- 6.3.1. Consumer Goods and Retail Sector
- 6.3.2. Automotive and Transportation Sector
- 6.3.3. Industrial
- 6.3.4. Entertainment
- 6.3.5. Real Estate and Property
- 6.3.6. Hospitality Sector
- 6.3.7. Other End Users
- 6.1. Market Analysis, Insights and Forecast - by Type
- 7. Europe Events and Exhibition Market Analysis, Insights and Forecast, 2019-2031
- 7.1. Market Analysis, Insights and Forecast - by Type
- 7.1.1. B2B
- 7.1.2. B2C
- 7.1.3. Mixed/Hybrid
- 7.2. Market Analysis, Insights and Forecast - by Revenue Stream
- 7.2.1. Exhibitor Fee
- 7.2.2. Sponsorship Fee
- 7.2.3. Entrance Fee
- 7.2.4. Services
- 7.3. Market Analysis, Insights and Forecast - by End User
- 7.3.1. Consumer Goods and Retail Sector
- 7.3.2. Automotive and Transportation Sector
- 7.3.3. Industrial
- 7.3.4. Entertainment
- 7.3.5. Real Estate and Property
- 7.3.6. Hospitality Sector
- 7.3.7. Other End Users
- 7.1. Market Analysis, Insights and Forecast - by Type
- 8. Asia Pacific Events and Exhibition Market Analysis, Insights and Forecast, 2019-2031
- 8.1. Market Analysis, Insights and Forecast - by Type
- 8.1.1. B2B
- 8.1.2. B2C
- 8.1.3. Mixed/Hybrid
- 8.2. Market Analysis, Insights and Forecast - by Revenue Stream
- 8.2.1. Exhibitor Fee
- 8.2.2. Sponsorship Fee
- 8.2.3. Entrance Fee
- 8.2.4. Services
- 8.3. Market Analysis, Insights and Forecast - by End User
- 8.3.1. Consumer Goods and Retail Sector
- 8.3.2. Automotive and Transportation Sector
- 8.3.3. Industrial
- 8.3.4. Entertainment
- 8.3.5. Real Estate and Property
- 8.3.6. Hospitality Sector
- 8.3.7. Other End Users
- 8.1. Market Analysis, Insights and Forecast - by Type
- 9. Latin America Events and Exhibition Market Analysis, Insights and Forecast, 2019-2031
- 9.1. Market Analysis, Insights and Forecast - by Type
- 9.1.1. B2B
- 9.1.2. B2C
- 9.1.3. Mixed/Hybrid
- 9.2. Market Analysis, Insights and Forecast - by Revenue Stream
- 9.2.1. Exhibitor Fee
- 9.2.2. Sponsorship Fee
- 9.2.3. Entrance Fee
- 9.2.4. Services
- 9.3. Market Analysis, Insights and Forecast - by End User
- 9.3.1. Consumer Goods and Retail Sector
- 9.3.2. Automotive and Transportation Sector
- 9.3.3. Industrial
- 9.3.4. Entertainment
- 9.3.5. Real Estate and Property
- 9.3.6. Hospitality Sector
- 9.3.7. Other End Users
- 9.1. Market Analysis, Insights and Forecast - by Type
- 10. Middle East and Africa Events and Exhibition Market Analysis, Insights and Forecast, 2019-2031
- 10.1. Market Analysis, Insights and Forecast - by Type
- 10.1.1. B2B
- 10.1.2. B2C
- 10.1.3. Mixed/Hybrid
- 10.2. Market Analysis, Insights and Forecast - by Revenue Stream
- 10.2.1. Exhibitor Fee
- 10.2.2. Sponsorship Fee
- 10.2.3. Entrance Fee
- 10.2.4. Services
- 10.3. Market Analysis, Insights and Forecast - by End User
- 10.3.1. Consumer Goods and Retail Sector
- 10.3.2. Automotive and Transportation Sector
- 10.3.3. Industrial
- 10.3.4. Entertainment
- 10.3.5. Real Estate and Property
- 10.3.6. Hospitality Sector
- 10.3.7. Other End Users
- 10.1. Market Analysis, Insights and Forecast - by Type
- 11. North America Events and Exhibition Market Analysis, Insights and Forecast, 2019-2031
- 11.1. Market Analysis, Insights and Forecast - By Country/Sub-region
- 11.1.1 United States
- 11.1.2 Canada
- 11.1.3 Mexico
- 12. Europe Events and Exhibition Market Analysis, Insights and Forecast, 2019-2031
- 12.1. Market Analysis, Insights and Forecast - By Country/Sub-region
- 12.1.1 Germany
- 12.1.2 United Kingdom
- 12.1.3 France
- 12.1.4 Spain
- 12.1.5 Italy
- 12.1.6 Spain
- 12.1.7 Belgium
- 12.1.8 Netherland
- 12.1.9 Nordics
- 12.1.10 Rest of Europe
- 13. Asia Pacific Events and Exhibition Market Analysis, Insights and Forecast, 2019-2031
- 13.1. Market Analysis, Insights and Forecast - By Country/Sub-region
- 13.1.1 China
- 13.1.2 Japan
- 13.1.3 India
- 13.1.4 South Korea
- 13.1.5 Southeast Asia
- 13.1.6 Australia
- 13.1.7 Indonesia
- 13.1.8 Phillipes
- 13.1.9 Singapore
- 13.1.10 Thailandc
- 13.1.11 Rest of Asia Pacific
- 14. South America Events and Exhibition Market Analysis, Insights and Forecast, 2019-2031
- 14.1. Market Analysis, Insights and Forecast - By Country/Sub-region
- 14.1.1 Brazil
- 14.1.2 Argentina
- 14.1.3 Peru
- 14.1.4 Chile
- 14.1.5 Colombia
- 14.1.6 Ecuador
- 14.1.7 Venezuela
- 14.1.8 Rest of South America
- 15. North America Events and Exhibition Market Analysis, Insights and Forecast, 2019-2031
- 15.1. Market Analysis, Insights and Forecast - By Country/Sub-region
- 15.1.1 United States
- 15.1.2 Canada
- 15.1.3 Mexico
- 16. MEA Events and Exhibition Market Analysis, Insights and Forecast, 2019-2031
- 16.1. Market Analysis, Insights and Forecast - By Country/Sub-region
- 16.1.1 United Arab Emirates
- 16.1.2 Saudi Arabia
- 16.1.3 South Africa
- 16.1.4 Rest of Middle East and Africa
- 17. Competitive Analysis
- 17.1. Global Market Share Analysis 2024
- 17.2. Company Profiles
- 17.2.1 Deutsche Messe AG
- 17.2.1.1. Overview
- 17.2.1.2. Products
- 17.2.1.3. SWOT Analysis
- 17.2.1.4. Recent Developments
- 17.2.1.5. Financials (Based on Availability)
- 17.2.2 GL Events
- 17.2.2.1. Overview
- 17.2.2.2. Products
- 17.2.2.3. SWOT Analysis
- 17.2.2.4. Recent Developments
- 17.2.2.5. Financials (Based on Availability)
- 17.2.3 Messe Frankfurt GmbH
- 17.2.3.1. Overview
- 17.2.3.2. Products
- 17.2.3.3. SWOT Analysis
- 17.2.3.4. Recent Developments
- 17.2.3.5. Financials (Based on Availability)
- 17.2.4 Viparis Holding
- 17.2.4.1. Overview
- 17.2.4.2. Products
- 17.2.4.3. SWOT Analysis
- 17.2.4.4. Recent Developments
- 17.2.4.5. Financials (Based on Availability)
- 17.2.5 Comexposium Grou
- 17.2.5.1. Overview
- 17.2.5.2. Products
- 17.2.5.3. SWOT Analysis
- 17.2.5.4. Recent Developments
- 17.2.5.5. Financials (Based on Availability)
- 17.2.6 Koelnmesse GmbH
- 17.2.6.1. Overview
- 17.2.6.2. Products
- 17.2.6.3. SWOT Analysis
- 17.2.6.4. Recent Developments
- 17.2.6.5. Financials (Based on Availability)
- 17.2.7 Messe Dsseldorf GmbH
- 17.2.7.1. Overview
- 17.2.7.2. Products
- 17.2.7.3. SWOT Analysis
- 17.2.7.4. Recent Developments
- 17.2.7.5. Financials (Based on Availability)
- 17.2.8 Percept Limited
- 17.2.8.1. Overview
- 17.2.8.2. Products
- 17.2.8.3. SWOT Analysis
- 17.2.8.4. Recent Developments
- 17.2.8.5. Financials (Based on Availability)
- 17.2.9 Fiera Milano SpA
- 17.2.9.1. Overview
- 17.2.9.2. Products
- 17.2.9.3. SWOT Analysis
- 17.2.9.4. Recent Developments
- 17.2.9.5. Financials (Based on Availability)
- 17.2.10 MCH Group AG
- 17.2.10.1. Overview
- 17.2.10.2. Products
- 17.2.10.3. SWOT Analysis
- 17.2.10.4. Recent Developments
- 17.2.10.5. Financials (Based on Availability)
- 17.2.1 Deutsche Messe AG
List of Figures
- Figure 1: Global Events and Exhibition Market Revenue Breakdown (Million, %) by Region 2024 & 2032
- Figure 2: North America Events and Exhibition Market Revenue (Million), by Country 2024 & 2032
- Figure 3: North America Events and Exhibition Market Revenue Share (%), by Country 2024 & 2032
- Figure 4: Europe Events and Exhibition Market Revenue (Million), by Country 2024 & 2032
- Figure 5: Europe Events and Exhibition Market Revenue Share (%), by Country 2024 & 2032
- Figure 6: Asia Pacific Events and Exhibition Market Revenue (Million), by Country 2024 & 2032
- Figure 7: Asia Pacific Events and Exhibition Market Revenue Share (%), by Country 2024 & 2032
- Figure 8: South America Events and Exhibition Market Revenue (Million), by Country 2024 & 2032
- Figure 9: South America Events and Exhibition Market Revenue Share (%), by Country 2024 & 2032
- Figure 10: North America Events and Exhibition Market Revenue (Million), by Country 2024 & 2032
- Figure 11: North America Events and Exhibition Market Revenue Share (%), by Country 2024 & 2032
- Figure 12: MEA Events and Exhibition Market Revenue (Million), by Country 2024 & 2032
- Figure 13: MEA Events and Exhibition Market Revenue Share (%), by Country 2024 & 2032
- Figure 14: North America Events and Exhibition Market Revenue (Million), by Type 2024 & 2032
- Figure 15: North America Events and Exhibition Market Revenue Share (%), by Type 2024 & 2032
- Figure 16: North America Events and Exhibition Market Revenue (Million), by Revenue Stream 2024 & 2032
- Figure 17: North America Events and Exhibition Market Revenue Share (%), by Revenue Stream 2024 & 2032
- Figure 18: North America Events and Exhibition Market Revenue (Million), by End User 2024 & 2032
- Figure 19: North America Events and Exhibition Market Revenue Share (%), by End User 2024 & 2032
- Figure 20: North America Events and Exhibition Market Revenue (Million), by Country 2024 & 2032
- Figure 21: North America Events and Exhibition Market Revenue Share (%), by Country 2024 & 2032
- Figure 22: Europe Events and Exhibition Market Revenue (Million), by Type 2024 & 2032
- Figure 23: Europe Events and Exhibition Market Revenue Share (%), by Type 2024 & 2032
- Figure 24: Europe Events and Exhibition Market Revenue (Million), by Revenue Stream 2024 & 2032
- Figure 25: Europe Events and Exhibition Market Revenue Share (%), by Revenue Stream 2024 & 2032
- Figure 26: Europe Events and Exhibition Market Revenue (Million), by End User 2024 & 2032
- Figure 27: Europe Events and Exhibition Market Revenue Share (%), by End User 2024 & 2032
- Figure 28: Europe Events and Exhibition Market Revenue (Million), by Country 2024 & 2032
- Figure 29: Europe Events and Exhibition Market Revenue Share (%), by Country 2024 & 2032
- Figure 30: Asia Pacific Events and Exhibition Market Revenue (Million), by Type 2024 & 2032
- Figure 31: Asia Pacific Events and Exhibition Market Revenue Share (%), by Type 2024 & 2032
- Figure 32: Asia Pacific Events and Exhibition Market Revenue (Million), by Revenue Stream 2024 & 2032
- Figure 33: Asia Pacific Events and Exhibition Market Revenue Share (%), by Revenue Stream 2024 & 2032
- Figure 34: Asia Pacific Events and Exhibition Market Revenue (Million), by End User 2024 & 2032
- Figure 35: Asia Pacific Events and Exhibition Market Revenue Share (%), by End User 2024 & 2032
- Figure 36: Asia Pacific Events and Exhibition Market Revenue (Million), by Country 2024 & 2032
- Figure 37: Asia Pacific Events and Exhibition Market Revenue Share (%), by Country 2024 & 2032
- Figure 38: Latin America Events and Exhibition Market Revenue (Million), by Type 2024 & 2032
- Figure 39: Latin America Events and Exhibition Market Revenue Share (%), by Type 2024 & 2032
- Figure 40: Latin America Events and Exhibition Market Revenue (Million), by Revenue Stream 2024 & 2032
- Figure 41: Latin America Events and Exhibition Market Revenue Share (%), by Revenue Stream 2024 & 2032
- Figure 42: Latin America Events and Exhibition Market Revenue (Million), by End User 2024 & 2032
- Figure 43: Latin America Events and Exhibition Market Revenue Share (%), by End User 2024 & 2032
- Figure 44: Latin America Events and Exhibition Market Revenue (Million), by Country 2024 & 2032
- Figure 45: Latin America Events and Exhibition Market Revenue Share (%), by Country 2024 & 2032
- Figure 46: Middle East and Africa Events and Exhibition Market Revenue (Million), by Type 2024 & 2032
- Figure 47: Middle East and Africa Events and Exhibition Market Revenue Share (%), by Type 2024 & 2032
- Figure 48: Middle East and Africa Events and Exhibition Market Revenue (Million), by Revenue Stream 2024 & 2032
- Figure 49: Middle East and Africa Events and Exhibition Market Revenue Share (%), by Revenue Stream 2024 & 2032
- Figure 50: Middle East and Africa Events and Exhibition Market Revenue (Million), by End User 2024 & 2032
- Figure 51: Middle East and Africa Events and Exhibition Market Revenue Share (%), by End User 2024 & 2032
- Figure 52: Middle East and Africa Events and Exhibition Market Revenue (Million), by Country 2024 & 2032
- Figure 53: Middle East and Africa Events and Exhibition Market Revenue Share (%), by Country 2024 & 2032
List of Tables
- Table 1: Global Events and Exhibition Market Revenue Million Forecast, by Region 2019 & 2032
- Table 2: Global Events and Exhibition Market Revenue Million Forecast, by Type 2019 & 2032
- Table 3: Global Events and Exhibition Market Revenue Million Forecast, by Revenue Stream 2019 & 2032
- Table 4: Global Events and Exhibition Market Revenue Million Forecast, by End User 2019 & 2032
- Table 5: Global Events and Exhibition Market Revenue Million Forecast, by Region 2019 & 2032
- Table 6: Global Events and Exhibition Market Revenue Million Forecast, by Country 2019 & 2032
- Table 7: United States Events and Exhibition Market Revenue (Million) Forecast, by Application 2019 & 2032
- Table 8: Canada Events and Exhibition Market Revenue (Million) Forecast, by Application 2019 & 2032
- Table 9: Mexico Events and Exhibition Market Revenue (Million) Forecast, by Application 2019 & 2032
- Table 10: Global Events and Exhibition Market Revenue Million Forecast, by Country 2019 & 2032
- Table 11: Germany Events and Exhibition Market Revenue (Million) Forecast, by Application 2019 & 2032
- Table 12: United Kingdom Events and Exhibition Market Revenue (Million) Forecast, by Application 2019 & 2032
- Table 13: France Events and Exhibition Market Revenue (Million) Forecast, by Application 2019 & 2032
- Table 14: Spain Events and Exhibition Market Revenue (Million) Forecast, by Application 2019 & 2032
- Table 15: Italy Events and Exhibition Market Revenue (Million) Forecast, by Application 2019 & 2032
- Table 16: Spain Events and Exhibition Market Revenue (Million) Forecast, by Application 2019 & 2032
- Table 17: Belgium Events and Exhibition Market Revenue (Million) Forecast, by Application 2019 & 2032
- Table 18: Netherland Events and Exhibition Market Revenue (Million) Forecast, by Application 2019 & 2032
- Table 19: Nordics Events and Exhibition Market Revenue (Million) Forecast, by Application 2019 & 2032
- Table 20: Rest of Europe Events and Exhibition Market Revenue (Million) Forecast, by Application 2019 & 2032
- Table 21: Global Events and Exhibition Market Revenue Million Forecast, by Country 2019 & 2032
- Table 22: China Events and Exhibition Market Revenue (Million) Forecast, by Application 2019 & 2032
- Table 23: Japan Events and Exhibition Market Revenue (Million) Forecast, by Application 2019 & 2032
- Table 24: India Events and Exhibition Market Revenue (Million) Forecast, by Application 2019 & 2032
- Table 25: South Korea Events and Exhibition Market Revenue (Million) Forecast, by Application 2019 & 2032
- Table 26: Southeast Asia Events and Exhibition Market Revenue (Million) Forecast, by Application 2019 & 2032
- Table 27: Australia Events and Exhibition Market Revenue (Million) Forecast, by Application 2019 & 2032
- Table 28: Indonesia Events and Exhibition Market Revenue (Million) Forecast, by Application 2019 & 2032
- Table 29: Phillipes Events and Exhibition Market Revenue (Million) Forecast, by Application 2019 & 2032
- Table 30: Singapore Events and Exhibition Market Revenue (Million) Forecast, by Application 2019 & 2032
- Table 31: Thailandc Events and Exhibition Market Revenue (Million) Forecast, by Application 2019 & 2032
- Table 32: Rest of Asia Pacific Events and Exhibition Market Revenue (Million) Forecast, by Application 2019 & 2032
- Table 33: Global Events and Exhibition Market Revenue Million Forecast, by Country 2019 & 2032
- Table 34: Brazil Events and Exhibition Market Revenue (Million) Forecast, by Application 2019 & 2032
- Table 35: Argentina Events and Exhibition Market Revenue (Million) Forecast, by Application 2019 & 2032
- Table 36: Peru Events and Exhibition Market Revenue (Million) Forecast, by Application 2019 & 2032
- Table 37: Chile Events and Exhibition Market Revenue (Million) Forecast, by Application 2019 & 2032
- Table 38: Colombia Events and Exhibition Market Revenue (Million) Forecast, by Application 2019 & 2032
- Table 39: Ecuador Events and Exhibition Market Revenue (Million) Forecast, by Application 2019 & 2032
- Table 40: Venezuela Events and Exhibition Market Revenue (Million) Forecast, by Application 2019 & 2032
- Table 41: Rest of South America Events and Exhibition Market Revenue (Million) Forecast, by Application 2019 & 2032
- Table 42: Global Events and Exhibition Market Revenue Million Forecast, by Country 2019 & 2032
- Table 43: United States Events and Exhibition Market Revenue (Million) Forecast, by Application 2019 & 2032
- Table 44: Canada Events and Exhibition Market Revenue (Million) Forecast, by Application 2019 & 2032
- Table 45: Mexico Events and Exhibition Market Revenue (Million) Forecast, by Application 2019 & 2032
- Table 46: Global Events and Exhibition Market Revenue Million Forecast, by Country 2019 & 2032
- Table 47: United Arab Emirates Events and Exhibition Market Revenue (Million) Forecast, by Application 2019 & 2032
- Table 48: Saudi Arabia Events and Exhibition Market Revenue (Million) Forecast, by Application 2019 & 2032
- Table 49: South Africa Events and Exhibition Market Revenue (Million) Forecast, by Application 2019 & 2032
- Table 50: Rest of Middle East and Africa Events and Exhibition Market Revenue (Million) Forecast, by Application 2019 & 2032
- Table 51: Global Events and Exhibition Market Revenue Million Forecast, by Type 2019 & 2032
- Table 52: Global Events and Exhibition Market Revenue Million Forecast, by Revenue Stream 2019 & 2032
- Table 53: Global Events and Exhibition Market Revenue Million Forecast, by End User 2019 & 2032
- Table 54: Global Events and Exhibition Market Revenue Million Forecast, by Country 2019 & 2032
- Table 55: United States Events and Exhibition Market Revenue (Million) Forecast, by Application 2019 & 2032
- Table 56: Canada Events and Exhibition Market Revenue (Million) Forecast, by Application 2019 & 2032
- Table 57: Global Events and Exhibition Market Revenue Million Forecast, by Type 2019 & 2032
- Table 58: Global Events and Exhibition Market Revenue Million Forecast, by Revenue Stream 2019 & 2032
- Table 59: Global Events and Exhibition Market Revenue Million Forecast, by End User 2019 & 2032
- Table 60: Global Events and Exhibition Market Revenue Million Forecast, by Country 2019 & 2032
- Table 61: Germany Events and Exhibition Market Revenue (Million) Forecast, by Application 2019 & 2032
- Table 62: United Kingdom Events and Exhibition Market Revenue (Million) Forecast, by Application 2019 & 2032
- Table 63: France Events and Exhibition Market Revenue (Million) Forecast, by Application 2019 & 2032
- Table 64: Global Events and Exhibition Market Revenue Million Forecast, by Type 2019 & 2032
- Table 65: Global Events and Exhibition Market Revenue Million Forecast, by Revenue Stream 2019 & 2032
- Table 66: Global Events and Exhibition Market Revenue Million Forecast, by End User 2019 & 2032
- Table 67: Global Events and Exhibition Market Revenue Million Forecast, by Country 2019 & 2032
- Table 68: China Events and Exhibition Market Revenue (Million) Forecast, by Application 2019 & 2032
- Table 69: Japan Events and Exhibition Market Revenue (Million) Forecast, by Application 2019 & 2032
- Table 70: India Events and Exhibition Market Revenue (Million) Forecast, by Application 2019 & 2032
- Table 71: South Korea Events and Exhibition Market Revenue (Million) Forecast, by Application 2019 & 2032
- Table 72: Australia and New Zealand Events and Exhibition Market Revenue (Million) Forecast, by Application 2019 & 2032
- Table 73: Global Events and Exhibition Market Revenue Million Forecast, by Type 2019 & 2032
- Table 74: Global Events and Exhibition Market Revenue Million Forecast, by Revenue Stream 2019 & 2032
- Table 75: Global Events and Exhibition Market Revenue Million Forecast, by End User 2019 & 2032
- Table 76: Global Events and Exhibition Market Revenue Million Forecast, by Country 2019 & 2032
- Table 77: Global Events and Exhibition Market Revenue Million Forecast, by Type 2019 & 2032
- Table 78: Global Events and Exhibition Market Revenue Million Forecast, by Revenue Stream 2019 & 2032
- Table 79: Global Events and Exhibition Market Revenue Million Forecast, by End User 2019 & 2032
- Table 80: Global Events and Exhibition Market Revenue Million Forecast, by Country 2019 & 2032
Frequently Asked Questions
1. What is the projected Compound Annual Growth Rate (CAGR) of the Events and Exhibition Market?
The projected CAGR is approximately 5.29%.
2. Which companies are prominent players in the Events and Exhibition Market?
Key companies in the market include Deutsche Messe AG, GL Events, Messe Frankfurt GmbH, Viparis Holding, Comexposium Grou, Koelnmesse GmbH, Messe Dsseldorf GmbH, Percept Limited, Fiera Milano SpA, MCH Group AG.
3. What are the main segments of the Events and Exhibition Market?
The market segments include Type, Revenue Stream, End User.
4. Can you provide details about the market size?
The market size is estimated to be USD 54.30 Million as of 2022.
5. What are some drivers contributing to market growth?
Growing Adoption of Geo-Cloning for Exhibition Organizers; Increasing Growth of Consumer Goods Penetrates the Growth of B2C Exhibition.
6. What are the notable trends driving market growth?
Entertainment Sector to Witness Fastest Growth.
7. Are there any restraints impacting market growth?
Loss Due to Restrictions of Smaller Players to Participate Owing to Potential Low Turnouts.
8. Can you provide examples of recent developments in the market?
November 2023 - Art Design Chicago, an initiative of the Terra Foundation for American Art in partnership with local artists and arts organizations, is a citywide collaboration and series of events and exhibitions that highlight the voices and stories that are part of the city's unique artistic heritage and creative communities. Continuing into 2025, more than 50 Chicago-area arts organizations across 30 Chicago neighborhoods and several suburban communities showcase the work of hundreds of artists.
9. What pricing options are available for accessing the report?
Pricing options include single-user, multi-user, and enterprise licenses priced at USD 4750, USD 5250, and USD 8750 respectively.
10. Is the market size provided in terms of value or volume?
The market size is provided in terms of value, measured in Million.
11. Are there any specific market keywords associated with the report?
Yes, the market keyword associated with the report is "Events and Exhibition Market," which aids in identifying and referencing the specific market segment covered.
12. How do I determine which pricing option suits my needs best?
The pricing options vary based on user requirements and access needs. Individual users may opt for single-user licenses, while businesses requiring broader access may choose multi-user or enterprise licenses for cost-effective access to the report.
13. Are there any additional resources or data provided in the Events and Exhibition Market report?
While the report offers comprehensive insights, it's advisable to review the specific contents or supplementary materials provided to ascertain if additional resources or data are available.
14. How can I stay updated on further developments or reports in the Events and Exhibition Market?
To stay informed about further developments, trends, and reports in the Events and Exhibition Market, consider subscribing to industry newsletters, following relevant companies and organizations, or regularly checking reputable industry news sources and publications.
Methodology
Step 1 - Identification of Relevant Samples Size from Population Database


Step 2 - Approaches for Defining Global Market Size (Value, Volume* & Price*)

Note*: In applicable scenarios
Step 3 - Data Sources
Primary Research
- Web Analytics
- Survey Reports
- Research Institute
- Latest Research Reports
- Opinion Leaders
Secondary Research
- Annual Reports
- White Paper
- Latest Press Release
- Industry Association
- Paid Database
- Investor Presentations

Step 4 - Data Triangulation
Involves using different sources of information in order to increase the validity of a study
These sources are likely to be stakeholders in a program - participants, other researchers, program staff, other community members, and so on.
Then we put all data in single framework & apply various statistical tools to find out the dynamic on the market.
During the analysis stage, feedback from the stakeholder groups would be compared to determine areas of agreement as well as areas of divergence
