

Key Insights
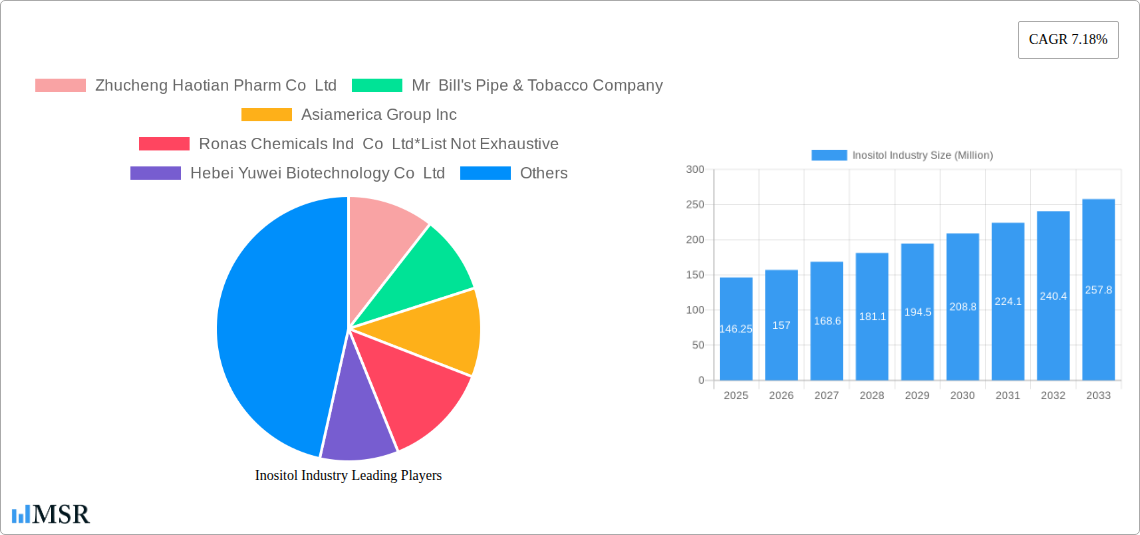
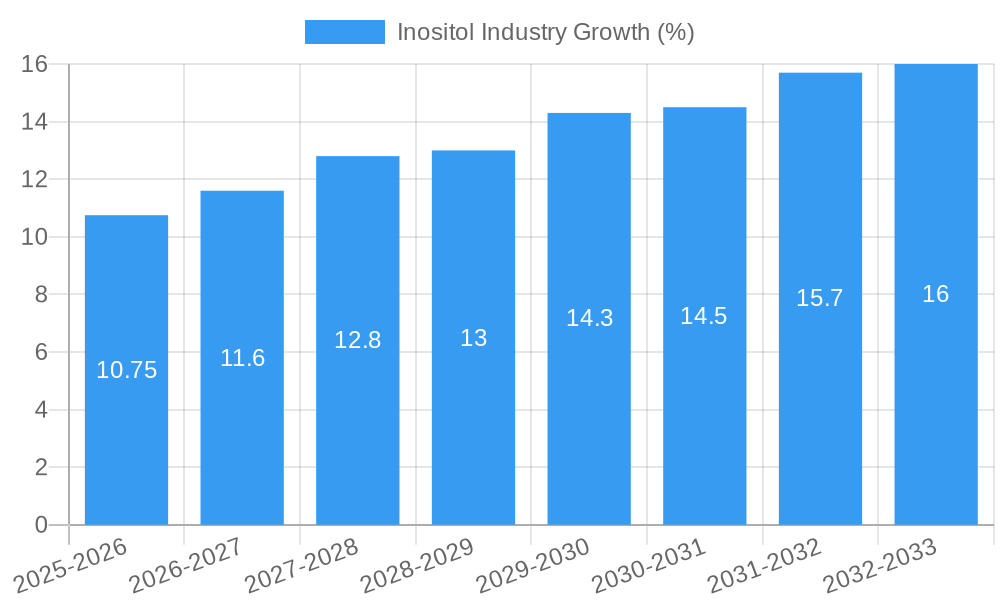
The inositol market, valued at $146.25 million in 2025, is projected to experience robust growth, driven by increasing demand across diverse applications. The 7.18% CAGR from 2025 to 2033 signifies a significant expansion fueled by several key factors. The dietary supplement sector, leveraging inositol's purported cognitive and metabolic benefits, is a major growth driver. Furthermore, the burgeoning beverage industry's incorporation of inositol for enhanced functional properties contributes significantly to market expansion. The feed industry's utilization of inositol as a crucial nutrient for livestock also contributes to this upward trajectory. Plant-based inositol sources are gaining traction, aligning with the rising consumer preference for natural and sustainable products. However, challenges such as price fluctuations in raw materials and the need for robust regulatory frameworks in certain regions pose potential restraints on market growth. Competitive landscape analysis reveals a mix of established players and emerging companies, indicating opportunities for both market consolidation and innovation. Geographic expansion is also anticipated, with Asia Pacific and North America expected to lead in market share due to growing health consciousness and increasing disposable incomes.
The pharmaceutical industry's integration of inositol into various formulations further fuels market expansion. Specific applications include its use in addressing insulin resistance and improving mental health. The "Other Applications" segment encompasses diverse uses, such as in cosmetics and personal care products, adding to the market's overall breadth. While synthetic inositol offers cost advantages, plant-based sources are capturing increasing market share due to consumer preference for natural ingredients. The forecast period of 2025-2033 promises continued growth, driven by ongoing research into inositol's benefits and expanding applications across numerous sectors. Strategic partnerships, product diversification, and technological advancements will likely shape the competitive landscape in the coming years.
Inositol Industry Market Report: 2019-2033
This comprehensive report provides a detailed analysis of the Inositol industry, encompassing market dynamics, key segments, leading players, and future growth prospects. With a study period spanning 2019-2033, a base year of 2025, and a forecast period of 2025-2033, this report offers invaluable insights for industry stakeholders, investors, and businesses seeking to navigate this dynamic market. The global Inositol market is projected to reach xx Million by 2033, exhibiting a robust CAGR of xx% during the forecast period.
Inositol Industry Market Concentration & Dynamics
The Inositol market exhibits a moderately concentrated landscape, with a few major players holding significant market share. However, the presence of numerous smaller companies fosters competition and innovation. Market share data for 2024 suggests that the top five players account for approximately xx% of the global market. The industry is characterized by a dynamic innovation ecosystem, with continuous research and development efforts focused on enhancing product efficacy and exploring novel applications. Regulatory frameworks vary across different regions, influencing market access and product approvals. Substitute products, while limited, pose some competitive pressure. End-user trends towards healthier lifestyles and functional foods are driving market growth, while M&A activities are expected to increase market consolidation.
- Market Concentration: Top 5 players hold approximately xx% market share (2024).
- Innovation: Ongoing R&D in enhanced formulations and new applications.
- Regulatory: Regional variations influence market access and product approvals.
- Substitute Products: Limited but present competitive pressure.
- End-User Trends: Growing demand for healthier lifestyles and functional foods.
- M&A Activity: Expected increase in mergers and acquisitions for market consolidation.
Inositol Industry Insights & Trends
The Inositol market is experiencing significant growth, driven primarily by the increasing demand for dietary supplements, particularly Myo-inositol, known for its potential benefits in managing PCOS and improving mood and cognition. Technological advancements are enabling the development of more efficient and cost-effective production methods, while evolving consumer preferences toward natural and functional ingredients are further boosting market demand. The global market size was valued at xx Million in 2024 and is projected to reach xx Million by 2033, demonstrating substantial market expansion.
- Market Growth Drivers: Increasing demand for dietary supplements, functional foods, and growing awareness of Inositol's health benefits.
- Technological Disruptions: Efficient production methods and advancements in formulation technologies.
- Evolving Consumer Behaviors: Preference for natural and functional ingredients fuels market expansion.
Key Markets & Segments Leading Inositol Industry
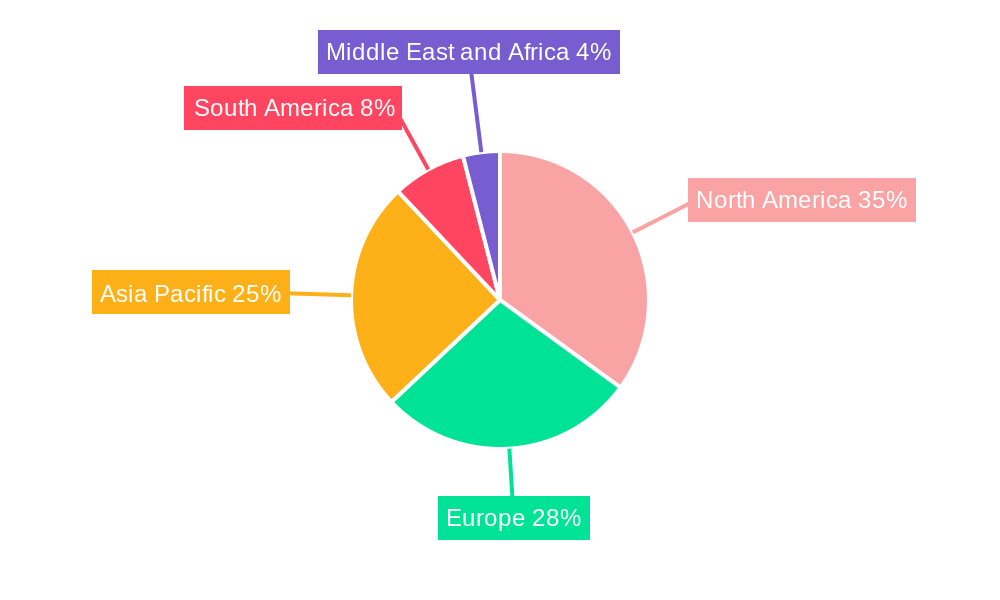
The Dietary Supplement segment represents the largest application area for Inositol, driven by its increasing popularity as a health and wellness ingredient. The Plant-based Inositol source holds a significant market share, owing to its natural origin and growing consumer preference for natural products. North America and Europe currently dominate the Inositol market due to high consumer awareness and established healthcare infrastructure. However, Asia Pacific is projected to show significant growth in the coming years due to rising disposable incomes and increased demand for health-enhancing products.
- Dominant Region: North America and Europe (currently), Asia Pacific (projected high growth).
- Dominant Application: Dietary Supplement
- Dominant Source: Plant-based Inositol
- Drivers (North America & Europe): Established healthcare infrastructure, high consumer awareness, strong regulatory frameworks.
- Drivers (Asia Pacific): Rising disposable incomes, growing middle class, increased demand for functional foods and dietary supplements.
Inositol Industry Product Developments
Recent product innovations include formulations targeting specific health conditions like PCOS, incorporating Inositol into functional beverages, and developing novel delivery systems for enhanced bioavailability. These advancements cater to evolving consumer preferences and broaden the range of Inositol applications within the food, beverage, and pharmaceutical industries, creating a competitive edge for manufacturers.
Challenges in the Inositol Industry Market
Key challenges include fluctuating raw material prices, stringent regulatory approvals in certain regions, and intense competition from both established players and new entrants. Supply chain disruptions and maintaining consistent product quality also pose significant operational hurdles, potentially impacting market growth trajectories. These challenges necessitate strategic planning and robust supply chain management to ensure sustainable growth.
Forces Driving Inositol Industry Growth
The Inositol industry is propelled by rising health consciousness, increasing demand for nutraceuticals, and technological advancements that improve production efficiency and product quality. Favorable regulatory landscapes in key markets further stimulate growth. For example, the growing acceptance of Inositol as a therapeutic agent in managing metabolic disorders is a major catalyst.
Long-Term Growth Catalysts in the Inositol Industry
Long-term growth will be fueled by continued research into Inositol's therapeutic potential, strategic partnerships to expand market reach, and exploration of new application areas. Developing innovative formulations, tapping into emerging markets like South America and Africa, and leveraging digital marketing to increase brand awareness are crucial long-term strategies.
Emerging Opportunities in Inositol Industry
Emerging opportunities include the development of Inositol-based functional foods, beverages, and cosmeceutical products. Expanding into untapped geographic markets and exploring novel applications in animal feed offer significant potential for industry growth. Furthermore, personalized nutrition trends are opening doors to customized Inositol formulations targeting specific demographic and health needs.
Leading Players in the Inositol Industry Sector
- Zhucheng Haotian Pharm Co Ltd
- Mr Bill's Pipe & Tobacco Company
- Asiamerica Group Inc
- Ronas Chemicals Ind Co Ltd
- Hebei Yuwei Biotechnology Co Ltd
- Charles Bowman & Company
- Koninklijke DSM NV
- Shandong Runde Biotechnology Co
- T J Clark & Company
- Jingkai Biotechnology
Key Milestones in Inositol Industry Industry
- March 2023: MD Logic Health launches "Inositol by Cynthia Thurlow," highlighting Myo-inositol's benefits for mood and cognition. This collaboration significantly increases brand recognition and market visibility.
- March 2023: Veera Wellness launches VeeVital PCOS support, leveraging the clinically proven benefits of Myo-inositol for PCOS management. This directly targets a significant and underserved market segment.
- February 2023: Pro360 launches FemCare+, incorporating Myo-inositol into a range of women's health products. This broadens the product's application to a wider consumer base, driving increased market penetration.
Strategic Outlook for Inositol Industry Market
The Inositol market presents substantial growth potential driven by burgeoning demand for natural health solutions and technological innovations enabling efficient and sustainable production. Strategic partnerships, targeted marketing campaigns, and expansion into emerging markets will be key to maximizing market share and achieving long-term success within this dynamic industry.
Inositol Industry Segmentation
-
1. Source
- 1.1. Plant-based Inositol
- 1.2. Synthetic Inositol
-
2. Application
- 2.1. Dietary Supplement
- 2.2. Beverage
- 2.3. Feed Industry
- 2.4. Pharmaceutical Industry
- 2.5. Other Applications
Inositol Industry Segmentation By Geography
-
1. North America
- 1.1. United States
- 1.2. Canada
- 1.3. Mexico
- 1.4. Rest of North America
-
2. Europe
- 2.1. United Kingdom
- 2.2. Germany
- 2.3. France
- 2.4. Russia
- 2.5. Italy
- 2.6. Spain
- 2.7. Rest of Europe
-
3. Asia Pacific
- 3.1. India
- 3.2. China
- 3.3. Japan
- 3.4. Australia
- 3.5. Rest of Asia Pacific
-
4. South America
- 4.1. Brazil
- 4.2. Argentina
- 4.3. Rest of South America
-
5. Middle East and Africa
- 5.1. South Africa
- 5.2. Saudi Arabia
- 5.3. Rest of Middle East and Africa
Inositol Industry REPORT HIGHLIGHTS
| Aspects | Details |
|---|---|
| Study Period | 2019-2033 |
| Base Year | 2024 |
| Estimated Year | 2025 |
| Forecast Period | 2025-2033 |
| Historical Period | 2019-2024 |
| Growth Rate | CAGR of 7.18% from 2019-2033 |
| Segmentation |
|
Table of Contents
- 1. Introduction
- 1.1. Research Scope
- 1.2. Market Segmentation
- 1.3. Research Methodology
- 1.4. Definitions and Assumptions
- 2. Executive Summary
- 2.1. Introduction
- 3. Market Dynamics
- 3.1. Introduction
- 3.2. Market Drivers
- 3.2.1. Increasing Demand for Clean Label Bakery Products; Increasing Popularity of Specialty Ingredients
- 3.3. Market Restrains
- 3.3.1. Risk of Allergies
- 3.4. Market Trends
- 3.4.1. Increasing Demand for Inositol in Pharmaceutical Industry
- 4. Market Factor Analysis
- 4.1. Porters Five Forces
- 4.2. Supply/Value Chain
- 4.3. PESTEL analysis
- 4.4. Market Entropy
- 4.5. Patent/Trademark Analysis
- 5. Global Inositol Industry Analysis, Insights and Forecast, 2019-2031
- 5.1. Market Analysis, Insights and Forecast - by Source
- 5.1.1. Plant-based Inositol
- 5.1.2. Synthetic Inositol
- 5.2. Market Analysis, Insights and Forecast - by Application
- 5.2.1. Dietary Supplement
- 5.2.2. Beverage
- 5.2.3. Feed Industry
- 5.2.4. Pharmaceutical Industry
- 5.2.5. Other Applications
- 5.3. Market Analysis, Insights and Forecast - by Region
- 5.3.1. North America
- 5.3.2. Europe
- 5.3.3. Asia Pacific
- 5.3.4. South America
- 5.3.5. Middle East and Africa
- 5.1. Market Analysis, Insights and Forecast - by Source
- 6. North America Inositol Industry Analysis, Insights and Forecast, 2019-2031
- 6.1. Market Analysis, Insights and Forecast - by Source
- 6.1.1. Plant-based Inositol
- 6.1.2. Synthetic Inositol
- 6.2. Market Analysis, Insights and Forecast - by Application
- 6.2.1. Dietary Supplement
- 6.2.2. Beverage
- 6.2.3. Feed Industry
- 6.2.4. Pharmaceutical Industry
- 6.2.5. Other Applications
- 6.1. Market Analysis, Insights and Forecast - by Source
- 7. Europe Inositol Industry Analysis, Insights and Forecast, 2019-2031
- 7.1. Market Analysis, Insights and Forecast - by Source
- 7.1.1. Plant-based Inositol
- 7.1.2. Synthetic Inositol
- 7.2. Market Analysis, Insights and Forecast - by Application
- 7.2.1. Dietary Supplement
- 7.2.2. Beverage
- 7.2.3. Feed Industry
- 7.2.4. Pharmaceutical Industry
- 7.2.5. Other Applications
- 7.1. Market Analysis, Insights and Forecast - by Source
- 8. Asia Pacific Inositol Industry Analysis, Insights and Forecast, 2019-2031
- 8.1. Market Analysis, Insights and Forecast - by Source
- 8.1.1. Plant-based Inositol
- 8.1.2. Synthetic Inositol
- 8.2. Market Analysis, Insights and Forecast - by Application
- 8.2.1. Dietary Supplement
- 8.2.2. Beverage
- 8.2.3. Feed Industry
- 8.2.4. Pharmaceutical Industry
- 8.2.5. Other Applications
- 8.1. Market Analysis, Insights and Forecast - by Source
- 9. South America Inositol Industry Analysis, Insights and Forecast, 2019-2031
- 9.1. Market Analysis, Insights and Forecast - by Source
- 9.1.1. Plant-based Inositol
- 9.1.2. Synthetic Inositol
- 9.2. Market Analysis, Insights and Forecast - by Application
- 9.2.1. Dietary Supplement
- 9.2.2. Beverage
- 9.2.3. Feed Industry
- 9.2.4. Pharmaceutical Industry
- 9.2.5. Other Applications
- 9.1. Market Analysis, Insights and Forecast - by Source
- 10. Middle East and Africa Inositol Industry Analysis, Insights and Forecast, 2019-2031
- 10.1. Market Analysis, Insights and Forecast - by Source
- 10.1.1. Plant-based Inositol
- 10.1.2. Synthetic Inositol
- 10.2. Market Analysis, Insights and Forecast - by Application
- 10.2.1. Dietary Supplement
- 10.2.2. Beverage
- 10.2.3. Feed Industry
- 10.2.4. Pharmaceutical Industry
- 10.2.5. Other Applications
- 10.1. Market Analysis, Insights and Forecast - by Source
- 11. North America Inositol Industry Analysis, Insights and Forecast, 2019-2031
- 11.1. Market Analysis, Insights and Forecast - By Country/Sub-region
- 11.1.1 United States
- 11.1.2 Canada
- 11.1.3 Mexico
- 11.1.4 Rest of North America
- 12. Europe Inositol Industry Analysis, Insights and Forecast, 2019-2031
- 12.1. Market Analysis, Insights and Forecast - By Country/Sub-region
- 12.1.1 United Kingdom
- 12.1.2 Germany
- 12.1.3 France
- 12.1.4 Russia
- 12.1.5 Italy
- 12.1.6 Spain
- 12.1.7 Rest of Europe
- 13. Asia Pacific Inositol Industry Analysis, Insights and Forecast, 2019-2031
- 13.1. Market Analysis, Insights and Forecast - By Country/Sub-region
- 13.1.1 India
- 13.1.2 China
- 13.1.3 Japan
- 13.1.4 Australia
- 13.1.5 Rest of Asia Pacific
- 14. South America Inositol Industry Analysis, Insights and Forecast, 2019-2031
- 14.1. Market Analysis, Insights and Forecast - By Country/Sub-region
- 14.1.1 Brazil
- 14.1.2 Argentina
- 14.1.3 Rest of South America
- 15. Middle East and Africa Inositol Industry Analysis, Insights and Forecast, 2019-2031
- 15.1. Market Analysis, Insights and Forecast - By Country/Sub-region
- 15.1.1 South Africa
- 15.1.2 Saudi Arabia
- 15.1.3 Rest of Middle East and Africa
- 16. Competitive Analysis
- 16.1. Global Market Share Analysis 2024
- 16.2. Company Profiles
- 16.2.1 Zhucheng Haotian Pharm Co Ltd
- 16.2.1.1. Overview
- 16.2.1.2. Products
- 16.2.1.3. SWOT Analysis
- 16.2.1.4. Recent Developments
- 16.2.1.5. Financials (Based on Availability)
- 16.2.2 Mr Bill's Pipe & Tobacco Company
- 16.2.2.1. Overview
- 16.2.2.2. Products
- 16.2.2.3. SWOT Analysis
- 16.2.2.4. Recent Developments
- 16.2.2.5. Financials (Based on Availability)
- 16.2.3 Asiamerica Group Inc
- 16.2.3.1. Overview
- 16.2.3.2. Products
- 16.2.3.3. SWOT Analysis
- 16.2.3.4. Recent Developments
- 16.2.3.5. Financials (Based on Availability)
- 16.2.4 Ronas Chemicals Ind Co Ltd*List Not Exhaustive
- 16.2.4.1. Overview
- 16.2.4.2. Products
- 16.2.4.3. SWOT Analysis
- 16.2.4.4. Recent Developments
- 16.2.4.5. Financials (Based on Availability)
- 16.2.5 Hebei Yuwei Biotechnology Co Ltd
- 16.2.5.1. Overview
- 16.2.5.2. Products
- 16.2.5.3. SWOT Analysis
- 16.2.5.4. Recent Developments
- 16.2.5.5. Financials (Based on Availability)
- 16.2.6 Charles Bowman & Company
- 16.2.6.1. Overview
- 16.2.6.2. Products
- 16.2.6.3. SWOT Analysis
- 16.2.6.4. Recent Developments
- 16.2.6.5. Financials (Based on Availability)
- 16.2.7 Koninklijke DSM NV
- 16.2.7.1. Overview
- 16.2.7.2. Products
- 16.2.7.3. SWOT Analysis
- 16.2.7.4. Recent Developments
- 16.2.7.5. Financials (Based on Availability)
- 16.2.8 Shandong Runde Biotechnology Co
- 16.2.8.1. Overview
- 16.2.8.2. Products
- 16.2.8.3. SWOT Analysis
- 16.2.8.4. Recent Developments
- 16.2.8.5. Financials (Based on Availability)
- 16.2.9 T J Clark & Company
- 16.2.9.1. Overview
- 16.2.9.2. Products
- 16.2.9.3. SWOT Analysis
- 16.2.9.4. Recent Developments
- 16.2.9.5. Financials (Based on Availability)
- 16.2.10 Jingkai Biotechnology
- 16.2.10.1. Overview
- 16.2.10.2. Products
- 16.2.10.3. SWOT Analysis
- 16.2.10.4. Recent Developments
- 16.2.10.5. Financials (Based on Availability)
- 16.2.1 Zhucheng Haotian Pharm Co Ltd
List of Figures
- Figure 1: Global Inositol Industry Revenue Breakdown (Million, %) by Region 2024 & 2032
- Figure 2: North America Inositol Industry Revenue (Million), by Country 2024 & 2032
- Figure 3: North America Inositol Industry Revenue Share (%), by Country 2024 & 2032
- Figure 4: Europe Inositol Industry Revenue (Million), by Country 2024 & 2032
- Figure 5: Europe Inositol Industry Revenue Share (%), by Country 2024 & 2032
- Figure 6: Asia Pacific Inositol Industry Revenue (Million), by Country 2024 & 2032
- Figure 7: Asia Pacific Inositol Industry Revenue Share (%), by Country 2024 & 2032
- Figure 8: South America Inositol Industry Revenue (Million), by Country 2024 & 2032
- Figure 9: South America Inositol Industry Revenue Share (%), by Country 2024 & 2032
- Figure 10: Middle East and Africa Inositol Industry Revenue (Million), by Country 2024 & 2032
- Figure 11: Middle East and Africa Inositol Industry Revenue Share (%), by Country 2024 & 2032
- Figure 12: North America Inositol Industry Revenue (Million), by Source 2024 & 2032
- Figure 13: North America Inositol Industry Revenue Share (%), by Source 2024 & 2032
- Figure 14: North America Inositol Industry Revenue (Million), by Application 2024 & 2032
- Figure 15: North America Inositol Industry Revenue Share (%), by Application 2024 & 2032
- Figure 16: North America Inositol Industry Revenue (Million), by Country 2024 & 2032
- Figure 17: North America Inositol Industry Revenue Share (%), by Country 2024 & 2032
- Figure 18: Europe Inositol Industry Revenue (Million), by Source 2024 & 2032
- Figure 19: Europe Inositol Industry Revenue Share (%), by Source 2024 & 2032
- Figure 20: Europe Inositol Industry Revenue (Million), by Application 2024 & 2032
- Figure 21: Europe Inositol Industry Revenue Share (%), by Application 2024 & 2032
- Figure 22: Europe Inositol Industry Revenue (Million), by Country 2024 & 2032
- Figure 23: Europe Inositol Industry Revenue Share (%), by Country 2024 & 2032
- Figure 24: Asia Pacific Inositol Industry Revenue (Million), by Source 2024 & 2032
- Figure 25: Asia Pacific Inositol Industry Revenue Share (%), by Source 2024 & 2032
- Figure 26: Asia Pacific Inositol Industry Revenue (Million), by Application 2024 & 2032
- Figure 27: Asia Pacific Inositol Industry Revenue Share (%), by Application 2024 & 2032
- Figure 28: Asia Pacific Inositol Industry Revenue (Million), by Country 2024 & 2032
- Figure 29: Asia Pacific Inositol Industry Revenue Share (%), by Country 2024 & 2032
- Figure 30: South America Inositol Industry Revenue (Million), by Source 2024 & 2032
- Figure 31: South America Inositol Industry Revenue Share (%), by Source 2024 & 2032
- Figure 32: South America Inositol Industry Revenue (Million), by Application 2024 & 2032
- Figure 33: South America Inositol Industry Revenue Share (%), by Application 2024 & 2032
- Figure 34: South America Inositol Industry Revenue (Million), by Country 2024 & 2032
- Figure 35: South America Inositol Industry Revenue Share (%), by Country 2024 & 2032
- Figure 36: Middle East and Africa Inositol Industry Revenue (Million), by Source 2024 & 2032
- Figure 37: Middle East and Africa Inositol Industry Revenue Share (%), by Source 2024 & 2032
- Figure 38: Middle East and Africa Inositol Industry Revenue (Million), by Application 2024 & 2032
- Figure 39: Middle East and Africa Inositol Industry Revenue Share (%), by Application 2024 & 2032
- Figure 40: Middle East and Africa Inositol Industry Revenue (Million), by Country 2024 & 2032
- Figure 41: Middle East and Africa Inositol Industry Revenue Share (%), by Country 2024 & 2032
List of Tables
- Table 1: Global Inositol Industry Revenue Million Forecast, by Region 2019 & 2032
- Table 2: Global Inositol Industry Revenue Million Forecast, by Source 2019 & 2032
- Table 3: Global Inositol Industry Revenue Million Forecast, by Application 2019 & 2032
- Table 4: Global Inositol Industry Revenue Million Forecast, by Region 2019 & 2032
- Table 5: Global Inositol Industry Revenue Million Forecast, by Country 2019 & 2032
- Table 6: United States Inositol Industry Revenue (Million) Forecast, by Application 2019 & 2032
- Table 7: Canada Inositol Industry Revenue (Million) Forecast, by Application 2019 & 2032
- Table 8: Mexico Inositol Industry Revenue (Million) Forecast, by Application 2019 & 2032
- Table 9: Rest of North America Inositol Industry Revenue (Million) Forecast, by Application 2019 & 2032
- Table 10: Global Inositol Industry Revenue Million Forecast, by Country 2019 & 2032
- Table 11: United Kingdom Inositol Industry Revenue (Million) Forecast, by Application 2019 & 2032
- Table 12: Germany Inositol Industry Revenue (Million) Forecast, by Application 2019 & 2032
- Table 13: France Inositol Industry Revenue (Million) Forecast, by Application 2019 & 2032
- Table 14: Russia Inositol Industry Revenue (Million) Forecast, by Application 2019 & 2032
- Table 15: Italy Inositol Industry Revenue (Million) Forecast, by Application 2019 & 2032
- Table 16: Spain Inositol Industry Revenue (Million) Forecast, by Application 2019 & 2032
- Table 17: Rest of Europe Inositol Industry Revenue (Million) Forecast, by Application 2019 & 2032
- Table 18: Global Inositol Industry Revenue Million Forecast, by Country 2019 & 2032
- Table 19: India Inositol Industry Revenue (Million) Forecast, by Application 2019 & 2032
- Table 20: China Inositol Industry Revenue (Million) Forecast, by Application 2019 & 2032
- Table 21: Japan Inositol Industry Revenue (Million) Forecast, by Application 2019 & 2032
- Table 22: Australia Inositol Industry Revenue (Million) Forecast, by Application 2019 & 2032
- Table 23: Rest of Asia Pacific Inositol Industry Revenue (Million) Forecast, by Application 2019 & 2032
- Table 24: Global Inositol Industry Revenue Million Forecast, by Country 2019 & 2032
- Table 25: Brazil Inositol Industry Revenue (Million) Forecast, by Application 2019 & 2032
- Table 26: Argentina Inositol Industry Revenue (Million) Forecast, by Application 2019 & 2032
- Table 27: Rest of South America Inositol Industry Revenue (Million) Forecast, by Application 2019 & 2032
- Table 28: Global Inositol Industry Revenue Million Forecast, by Country 2019 & 2032
- Table 29: South Africa Inositol Industry Revenue (Million) Forecast, by Application 2019 & 2032
- Table 30: Saudi Arabia Inositol Industry Revenue (Million) Forecast, by Application 2019 & 2032
- Table 31: Rest of Middle East and Africa Inositol Industry Revenue (Million) Forecast, by Application 2019 & 2032
- Table 32: Global Inositol Industry Revenue Million Forecast, by Source 2019 & 2032
- Table 33: Global Inositol Industry Revenue Million Forecast, by Application 2019 & 2032
- Table 34: Global Inositol Industry Revenue Million Forecast, by Country 2019 & 2032
- Table 35: United States Inositol Industry Revenue (Million) Forecast, by Application 2019 & 2032
- Table 36: Canada Inositol Industry Revenue (Million) Forecast, by Application 2019 & 2032
- Table 37: Mexico Inositol Industry Revenue (Million) Forecast, by Application 2019 & 2032
- Table 38: Rest of North America Inositol Industry Revenue (Million) Forecast, by Application 2019 & 2032
- Table 39: Global Inositol Industry Revenue Million Forecast, by Source 2019 & 2032
- Table 40: Global Inositol Industry Revenue Million Forecast, by Application 2019 & 2032
- Table 41: Global Inositol Industry Revenue Million Forecast, by Country 2019 & 2032
- Table 42: United Kingdom Inositol Industry Revenue (Million) Forecast, by Application 2019 & 2032
- Table 43: Germany Inositol Industry Revenue (Million) Forecast, by Application 2019 & 2032
- Table 44: France Inositol Industry Revenue (Million) Forecast, by Application 2019 & 2032
- Table 45: Russia Inositol Industry Revenue (Million) Forecast, by Application 2019 & 2032
- Table 46: Italy Inositol Industry Revenue (Million) Forecast, by Application 2019 & 2032
- Table 47: Spain Inositol Industry Revenue (Million) Forecast, by Application 2019 & 2032
- Table 48: Rest of Europe Inositol Industry Revenue (Million) Forecast, by Application 2019 & 2032
- Table 49: Global Inositol Industry Revenue Million Forecast, by Source 2019 & 2032
- Table 50: Global Inositol Industry Revenue Million Forecast, by Application 2019 & 2032
- Table 51: Global Inositol Industry Revenue Million Forecast, by Country 2019 & 2032
- Table 52: India Inositol Industry Revenue (Million) Forecast, by Application 2019 & 2032
- Table 53: China Inositol Industry Revenue (Million) Forecast, by Application 2019 & 2032
- Table 54: Japan Inositol Industry Revenue (Million) Forecast, by Application 2019 & 2032
- Table 55: Australia Inositol Industry Revenue (Million) Forecast, by Application 2019 & 2032
- Table 56: Rest of Asia Pacific Inositol Industry Revenue (Million) Forecast, by Application 2019 & 2032
- Table 57: Global Inositol Industry Revenue Million Forecast, by Source 2019 & 2032
- Table 58: Global Inositol Industry Revenue Million Forecast, by Application 2019 & 2032
- Table 59: Global Inositol Industry Revenue Million Forecast, by Country 2019 & 2032
- Table 60: Brazil Inositol Industry Revenue (Million) Forecast, by Application 2019 & 2032
- Table 61: Argentina Inositol Industry Revenue (Million) Forecast, by Application 2019 & 2032
- Table 62: Rest of South America Inositol Industry Revenue (Million) Forecast, by Application 2019 & 2032
- Table 63: Global Inositol Industry Revenue Million Forecast, by Source 2019 & 2032
- Table 64: Global Inositol Industry Revenue Million Forecast, by Application 2019 & 2032
- Table 65: Global Inositol Industry Revenue Million Forecast, by Country 2019 & 2032
- Table 66: South Africa Inositol Industry Revenue (Million) Forecast, by Application 2019 & 2032
- Table 67: Saudi Arabia Inositol Industry Revenue (Million) Forecast, by Application 2019 & 2032
- Table 68: Rest of Middle East and Africa Inositol Industry Revenue (Million) Forecast, by Application 2019 & 2032
Frequently Asked Questions
1. What is the projected Compound Annual Growth Rate (CAGR) of the Inositol Industry?
The projected CAGR is approximately 7.18%.
2. Which companies are prominent players in the Inositol Industry?
Key companies in the market include Zhucheng Haotian Pharm Co Ltd, Mr Bill's Pipe & Tobacco Company, Asiamerica Group Inc, Ronas Chemicals Ind Co Ltd*List Not Exhaustive, Hebei Yuwei Biotechnology Co Ltd, Charles Bowman & Company, Koninklijke DSM NV, Shandong Runde Biotechnology Co, T J Clark & Company, Jingkai Biotechnology.
3. What are the main segments of the Inositol Industry?
The market segments include Source, Application.
4. Can you provide details about the market size?
The market size is estimated to be USD 146.25 Million as of 2022.
5. What are some drivers contributing to market growth?
Increasing Demand for Clean Label Bakery Products; Increasing Popularity of Specialty Ingredients.
6. What are the notable trends driving market growth?
Increasing Demand for Inositol in Pharmaceutical Industry.
7. Are there any restraints impacting market growth?
Risk of Allergies.
8. Can you provide examples of recent developments in the market?
In March 2023, MD Logic Health, a leading provider of USA-made professional-grade nutraceuticals and physician-recommended dietary supplements, announced its second collaboration with Cynthia Thurlow, NP. The latest product developed under this collaboration is Inositol by Cynthia Thurlow, powered by MD Logic Health. Myo-inositol, a naturally occurring organic compound produced by the liver and kidney, is crucial in regulating the body's response and hormones associated with mood and cognition.
9. What pricing options are available for accessing the report?
Pricing options include single-user, multi-user, and enterprise licenses priced at USD 4750, USD 5250, and USD 8750 respectively.
10. Is the market size provided in terms of value or volume?
The market size is provided in terms of value, measured in Million.
11. Are there any specific market keywords associated with the report?
Yes, the market keyword associated with the report is "Inositol Industry," which aids in identifying and referencing the specific market segment covered.
12. How do I determine which pricing option suits my needs best?
The pricing options vary based on user requirements and access needs. Individual users may opt for single-user licenses, while businesses requiring broader access may choose multi-user or enterprise licenses for cost-effective access to the report.
13. Are there any additional resources or data provided in the Inositol Industry report?
While the report offers comprehensive insights, it's advisable to review the specific contents or supplementary materials provided to ascertain if additional resources or data are available.
14. How can I stay updated on further developments or reports in the Inositol Industry?
To stay informed about further developments, trends, and reports in the Inositol Industry, consider subscribing to industry newsletters, following relevant companies and organizations, or regularly checking reputable industry news sources and publications.
Methodology
Step 1 - Identification of Relevant Samples Size from Population Database


Step 2 - Approaches for Defining Global Market Size (Value, Volume* & Price*)

Note*: In applicable scenarios
Step 3 - Data Sources
Primary Research
- Web Analytics
- Survey Reports
- Research Institute
- Latest Research Reports
- Opinion Leaders
Secondary Research
- Annual Reports
- White Paper
- Latest Press Release
- Industry Association
- Paid Database
- Investor Presentations

Step 4 - Data Triangulation
Involves using different sources of information in order to increase the validity of a study
These sources are likely to be stakeholders in a program - participants, other researchers, program staff, other community members, and so on.
Then we put all data in single framework & apply various statistical tools to find out the dynamic on the market.
During the analysis stage, feedback from the stakeholder groups would be compared to determine areas of agreement as well as areas of divergence
