

Key Insights
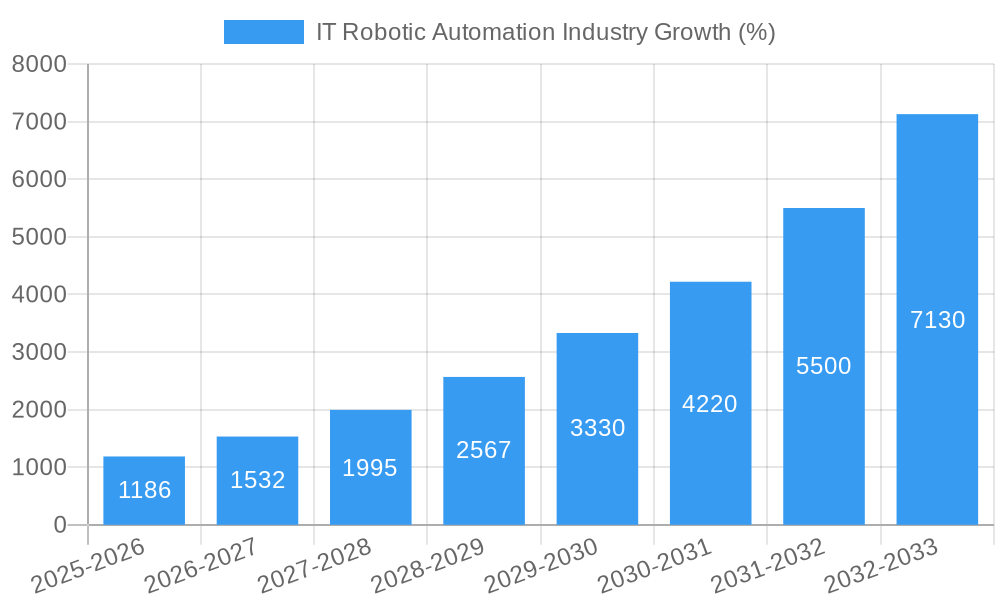
The IT Robotic Process Automation (RPA) market is experiencing explosive growth, projected to reach $4.02 billion in 2025 and maintain a robust Compound Annual Growth Rate (CAGR) of 29.70% from 2025 to 2033. This surge is driven by several key factors. Firstly, the increasing need for enhanced operational efficiency and cost reduction across various industries, including BFSI (Banking, Financial Services, and Insurance), healthcare, and manufacturing, is fueling adoption. Secondly, advancements in artificial intelligence (AI) and machine learning (ML) are enabling RPA solutions to handle more complex tasks, further boosting market appeal. The shift towards cloud-based deployments is also a significant driver, offering scalability, flexibility, and reduced infrastructure costs. Finally, the growing awareness of RPA's potential to improve employee productivity and customer satisfaction contributes to its widespread adoption.
The market segmentation reveals key trends. While large enterprises are currently the major consumers of RPA solutions, small and medium-sized enterprises (SMEs) are rapidly adopting RPA due to its accessibility and cost-effectiveness. Software solutions currently hold a larger market share compared to service offerings, reflecting the industry's maturity. However, the service segment is poised for significant growth as businesses increasingly seek support for implementation, integration, and ongoing maintenance. Geographically, North America currently dominates the market, followed by Europe and Asia-Pacific. However, emerging economies in Asia-Pacific are showing significant growth potential, presenting lucrative opportunities for RPA vendors. Despite the rapid growth, challenges remain, including integration complexities, security concerns, and the need for skilled professionals to manage and maintain RPA systems. Overcoming these obstacles will be crucial for sustained market expansion.

IT Robotic Automation Industry: A Comprehensive Market Report (2019-2033)
This comprehensive report provides a detailed analysis of the IT Robotic Automation industry, projecting a market valuation of $XX Million by 2033. It covers market dynamics, key segments, leading players, and future opportunities, offering actionable insights for stakeholders across the industry. The study period spans 2019-2033, with 2025 serving as both the base and estimated year.
IT Robotic Automation Industry Market Concentration & Dynamics
The IT Robotic Automation industry exhibits a moderately concentrated market structure, with several major players commanding significant shares. Market share dynamics are influenced by factors including M&A activity, technological innovation, and regulatory changes. The historical period (2019-2024) witnessed an increase in M&A deals, with approximately XX deals recorded, driving consolidation and shaping the competitive landscape. Key players such as UiPath Inc, Automation Anywhere Inc, and Blue Prism Group PLC hold substantial market share, while smaller players compete through niche solutions and strategic partnerships. The emergence of open-source RPA tools is introducing competition and driving innovation. Regulatory frameworks, especially those related to data privacy and security, significantly impact adoption rates and vendor strategies. Substitute products, such as traditional business process outsourcing (BPO), remain competitive, particularly for simpler automation tasks. End-user trends favor cloud-based solutions and a preference for integrated platforms, driving vendor strategy.
- Market Concentration: Moderately concentrated, with top players holding XX% market share in 2024.
- M&A Activity: XX deals recorded from 2019 to 2024.
- Key Players: UiPath Inc, Automation Anywhere Inc, Blue Prism Group PLC.
- Emerging Trends: Cloud adoption, integrated platforms, open-source RPA.
IT Robotic Automation Industry Industry Insights & Trends
The IT Robotic Automation industry is experiencing robust growth, driven by the increasing need for process efficiency, cost reduction, and improved customer experience. The market size reached $XX Million in 2024 and is projected to reach $XX Million by 2033, exhibiting a Compound Annual Growth Rate (CAGR) of XX%. This growth is fueled by several factors: the rising adoption of cloud-based solutions, increased digital transformation initiatives across various industries, and the growing availability of skilled workforce. Technological advancements, such as AI-powered RPA and hyperautomation, are disrupting the industry, leading to enhanced capabilities and improved ROI. Changing consumer behavior, demanding faster and more personalized service, is further driving the demand for intelligent automation solutions. The BFSI and IT and Telecom sectors are currently leading the adoption curve.
Key Markets & Segments Leading IT Robotic Automation Industry
The global IT Robotic Automation market is dominated by the Large Enterprises segment, driven by their higher budgets and greater need for large-scale automation. The Cloud deployment model is experiencing rapid growth, propelled by its scalability, accessibility, and cost-effectiveness. Geographically, North America holds a significant market share, followed by Europe and Asia Pacific.
Dominant Segments:
- Size of Enterprise: Large Enterprises (XX% market share in 2024)
- Deployment: Cloud (XX% market share in 2024)
- Region: North America (XX% market share in 2024)
Drivers:
- Large Enterprises: High investment capacity, extensive automation needs.
- Cloud Deployment: Scalability, accessibility, cost-effectiveness.
- North America: High digital maturity, strong adoption rates.
- BFSI: Stringent regulatory compliance drives automation.
- IT & Telecom: Operational efficiency and customer service improvement.
IT Robotic Automation Industry Product Developments
Recent product innovations focus on AI-powered capabilities, such as intelligent document processing and natural language processing, enabling robots to handle more complex tasks and improve accuracy. Integration with other enterprise software solutions is crucial, allowing seamless workflow automation. The focus on user-friendly interfaces and low-code/no-code platforms is making RPA accessible to a broader range of users. These advancements give companies a competitive edge by increasing efficiency, reducing errors, and accelerating time-to-value.
Challenges in the IT Robotic Automation Industry Market
The IT Robotic Automation market faces challenges including the high initial investment costs, the need for skilled labor to implement and maintain systems, and the complexity of integrating RPA with existing IT infrastructure. Supply chain disruptions, particularly in the semiconductor industry, have impacted the availability of hardware components. Moreover, intense competition amongst established players and new entrants exerts pressure on pricing and margins. Regulatory hurdles regarding data privacy and security also pose challenges for businesses. These factors collectively constrain market growth, leading to a projected XX% reduction in growth rate from 2028 to 2033.
Forces Driving IT Robotic Automation Industry Growth
Technological advancements in AI and machine learning continue to drive market expansion, enabling more sophisticated automation capabilities. Growing demand for enhanced operational efficiency and cost reduction across various industries fuels market growth. Favorable government regulations and initiatives promoting digital transformation are further boosting adoption. Examples include tax incentives for automation investments and initiatives to train the workforce in RPA skills.
Challenges in the IT Robotic Automation Industry Market
Long-term growth hinges on continued innovation in areas such as AI, machine learning, and hyperautomation. Strategic partnerships between RPA vendors and technology providers in areas such as cloud computing, data analytics, and cybersecurity are critical. Market expansion into new industries and geographies, particularly developing economies, will be crucial for sustained growth.
Emerging Opportunities in IT Robotic Automation Industry
Emerging opportunities exist in niche applications, such as intelligent process automation in healthcare, finance, and manufacturing. The integration of RPA with blockchain technology to enhance security and transparency presents a significant opportunity. Growing demand for hyperautomation solutions, which integrate various automation technologies, will drive market expansion. New technologies such as Generative AI and Large Language Models will fuel the next phase of growth for the industry.
Leading Players in the IT Robotic Automation Industry Sector
- Jacada Inc
- Nice Robotic Automation Ltd
- Kofax Inc (Thoma Bravo LLC)
- HelpSystems LLC (HGGC)
- Jidoka
- UIPath Inc
- Datamatics Global Services Limited
- Automation Anywhere Inc
- Be Informed BV (Hoogenberg Beheer BV)
- Pegasystems Inc
- AutomationEdge Technologies Inc
- Blue Prism Group PLC
- CGI Inc
Key Milestones in IT Robotic Automation Industry Industry
- September 2022: UiPath and Snowflake launch a bi-directional integration, extending automation capabilities across enterprises. This partnership significantly expands UiPath's reach and capabilities, enhancing its market position.
- August 2022: Digital Workforce Services partners with Keva, showcasing the growing adoption of RPA solutions in the public sector and the increasing demand for cloud-based services. This highlights the shift towards cloud deployment and the expansion into new market segments.
Strategic Outlook for IT Robotic Automation Industry Market
The IT Robotic Automation market holds significant future potential, driven by continuous technological advancements and increasing adoption across diverse industries. Strategic opportunities include focusing on niche applications, expanding into emerging markets, and fostering strategic partnerships to enhance product offerings and market reach. Companies that effectively leverage AI, machine learning, and cloud technologies will be best positioned for success in this dynamic market.
IT Robotic Automation Industry Segmentation
-
1. Deployment
- 1.1. On-premise
- 1.2. Cloud
-
2. Solution
- 2.1. Software
- 2.2. Service
-
3. Size of Enterprise
- 3.1. Small and Medium Enterprises
- 3.2. Large Enterprises
-
4. End User Industry
- 4.1. IT and Telecom
- 4.2. BFSI
- 4.3. Healthcare
- 4.4. Retail
- 4.5. Manufacturing
- 4.6. Other End User Industries
IT Robotic Automation Industry Segmentation By Geography
- 1. North America
- 2. Europe
- 3. Asia Pacific
- 4. Latin America
- 5. Middle East and Africa

IT Robotic Automation Industry REPORT HIGHLIGHTS
| Aspects | Details |
|---|---|
| Study Period | 2019-2033 |
| Base Year | 2024 |
| Estimated Year | 2025 |
| Forecast Period | 2025-2033 |
| Historical Period | 2019-2024 |
| Growth Rate | CAGR of 29.70% from 2019-2033 |
| Segmentation |
|
Table of Contents
- 1. Introduction
- 1.1. Research Scope
- 1.2. Market Segmentation
- 1.3. Research Methodology
- 1.4. Definitions and Assumptions
- 2. Executive Summary
- 2.1. Introduction
- 3. Market Dynamics
- 3.1. Introduction
- 3.2. Market Drivers
- 3.2.1. Retail Sector to hold major share in RPA Market; Adoption of AI- and Cloud-based Solutions for Internal Efficiency among SMEs
- 3.3. Market Restrains
- 3.3.1. Data Security Concerns
- 3.4. Market Trends
- 3.4.1. Retail Sector to hold major share in RPA Market
- 4. Market Factor Analysis
- 4.1. Porters Five Forces
- 4.2. Supply/Value Chain
- 4.3. PESTEL analysis
- 4.4. Market Entropy
- 4.5. Patent/Trademark Analysis
- 5. Global IT Robotic Automation Industry Analysis, Insights and Forecast, 2019-2031
- 5.1. Market Analysis, Insights and Forecast - by Deployment
- 5.1.1. On-premise
- 5.1.2. Cloud
- 5.2. Market Analysis, Insights and Forecast - by Solution
- 5.2.1. Software
- 5.2.2. Service
- 5.3. Market Analysis, Insights and Forecast - by Size of Enterprise
- 5.3.1. Small and Medium Enterprises
- 5.3.2. Large Enterprises
- 5.4. Market Analysis, Insights and Forecast - by End User Industry
- 5.4.1. IT and Telecom
- 5.4.2. BFSI
- 5.4.3. Healthcare
- 5.4.4. Retail
- 5.4.5. Manufacturing
- 5.4.6. Other End User Industries
- 5.5. Market Analysis, Insights and Forecast - by Region
- 5.5.1. North America
- 5.5.2. Europe
- 5.5.3. Asia Pacific
- 5.5.4. Latin America
- 5.5.5. Middle East and Africa
- 5.1. Market Analysis, Insights and Forecast - by Deployment
- 6. North America IT Robotic Automation Industry Analysis, Insights and Forecast, 2019-2031
- 6.1. Market Analysis, Insights and Forecast - by Deployment
- 6.1.1. On-premise
- 6.1.2. Cloud
- 6.2. Market Analysis, Insights and Forecast - by Solution
- 6.2.1. Software
- 6.2.2. Service
- 6.3. Market Analysis, Insights and Forecast - by Size of Enterprise
- 6.3.1. Small and Medium Enterprises
- 6.3.2. Large Enterprises
- 6.4. Market Analysis, Insights and Forecast - by End User Industry
- 6.4.1. IT and Telecom
- 6.4.2. BFSI
- 6.4.3. Healthcare
- 6.4.4. Retail
- 6.4.5. Manufacturing
- 6.4.6. Other End User Industries
- 6.1. Market Analysis, Insights and Forecast - by Deployment
- 7. Europe IT Robotic Automation Industry Analysis, Insights and Forecast, 2019-2031
- 7.1. Market Analysis, Insights and Forecast - by Deployment
- 7.1.1. On-premise
- 7.1.2. Cloud
- 7.2. Market Analysis, Insights and Forecast - by Solution
- 7.2.1. Software
- 7.2.2. Service
- 7.3. Market Analysis, Insights and Forecast - by Size of Enterprise
- 7.3.1. Small and Medium Enterprises
- 7.3.2. Large Enterprises
- 7.4. Market Analysis, Insights and Forecast - by End User Industry
- 7.4.1. IT and Telecom
- 7.4.2. BFSI
- 7.4.3. Healthcare
- 7.4.4. Retail
- 7.4.5. Manufacturing
- 7.4.6. Other End User Industries
- 7.1. Market Analysis, Insights and Forecast - by Deployment
- 8. Asia Pacific IT Robotic Automation Industry Analysis, Insights and Forecast, 2019-2031
- 8.1. Market Analysis, Insights and Forecast - by Deployment
- 8.1.1. On-premise
- 8.1.2. Cloud
- 8.2. Market Analysis, Insights and Forecast - by Solution
- 8.2.1. Software
- 8.2.2. Service
- 8.3. Market Analysis, Insights and Forecast - by Size of Enterprise
- 8.3.1. Small and Medium Enterprises
- 8.3.2. Large Enterprises
- 8.4. Market Analysis, Insights and Forecast - by End User Industry
- 8.4.1. IT and Telecom
- 8.4.2. BFSI
- 8.4.3. Healthcare
- 8.4.4. Retail
- 8.4.5. Manufacturing
- 8.4.6. Other End User Industries
- 8.1. Market Analysis, Insights and Forecast - by Deployment
- 9. Latin America IT Robotic Automation Industry Analysis, Insights and Forecast, 2019-2031
- 9.1. Market Analysis, Insights and Forecast - by Deployment
- 9.1.1. On-premise
- 9.1.2. Cloud
- 9.2. Market Analysis, Insights and Forecast - by Solution
- 9.2.1. Software
- 9.2.2. Service
- 9.3. Market Analysis, Insights and Forecast - by Size of Enterprise
- 9.3.1. Small and Medium Enterprises
- 9.3.2. Large Enterprises
- 9.4. Market Analysis, Insights and Forecast - by End User Industry
- 9.4.1. IT and Telecom
- 9.4.2. BFSI
- 9.4.3. Healthcare
- 9.4.4. Retail
- 9.4.5. Manufacturing
- 9.4.6. Other End User Industries
- 9.1. Market Analysis, Insights and Forecast - by Deployment
- 10. Middle East and Africa IT Robotic Automation Industry Analysis, Insights and Forecast, 2019-2031
- 10.1. Market Analysis, Insights and Forecast - by Deployment
- 10.1.1. On-premise
- 10.1.2. Cloud
- 10.2. Market Analysis, Insights and Forecast - by Solution
- 10.2.1. Software
- 10.2.2. Service
- 10.3. Market Analysis, Insights and Forecast - by Size of Enterprise
- 10.3.1. Small and Medium Enterprises
- 10.3.2. Large Enterprises
- 10.4. Market Analysis, Insights and Forecast - by End User Industry
- 10.4.1. IT and Telecom
- 10.4.2. BFSI
- 10.4.3. Healthcare
- 10.4.4. Retail
- 10.4.5. Manufacturing
- 10.4.6. Other End User Industries
- 10.1. Market Analysis, Insights and Forecast - by Deployment
- 11. North America IT Robotic Automation Industry Analysis, Insights and Forecast, 2019-2031
- 11.1. Market Analysis, Insights and Forecast - By Country/Sub-region
- 11.1.1 United States
- 11.1.2 Canada
- 11.1.3 Mexico
- 12. Europe IT Robotic Automation Industry Analysis, Insights and Forecast, 2019-2031
- 12.1. Market Analysis, Insights and Forecast - By Country/Sub-region
- 12.1.1 Germany
- 12.1.2 United Kingdom
- 12.1.3 France
- 12.1.4 Spain
- 12.1.5 Italy
- 12.1.6 Spain
- 12.1.7 Belgium
- 12.1.8 Netherland
- 12.1.9 Nordics
- 12.1.10 Rest of Europe
- 13. Asia Pacific IT Robotic Automation Industry Analysis, Insights and Forecast, 2019-2031
- 13.1. Market Analysis, Insights and Forecast - By Country/Sub-region
- 13.1.1 China
- 13.1.2 Japan
- 13.1.3 India
- 13.1.4 South Korea
- 13.1.5 Southeast Asia
- 13.1.6 Australia
- 13.1.7 Indonesia
- 13.1.8 Phillipes
- 13.1.9 Singapore
- 13.1.10 Thailandc
- 13.1.11 Rest of Asia Pacific
- 14. South America IT Robotic Automation Industry Analysis, Insights and Forecast, 2019-2031
- 14.1. Market Analysis, Insights and Forecast - By Country/Sub-region
- 14.1.1 Brazil
- 14.1.2 Argentina
- 14.1.3 Peru
- 14.1.4 Chile
- 14.1.5 Colombia
- 14.1.6 Ecuador
- 14.1.7 Venezuela
- 14.1.8 Rest of South America
- 15. North America IT Robotic Automation Industry Analysis, Insights and Forecast, 2019-2031
- 15.1. Market Analysis, Insights and Forecast - By Country/Sub-region
- 15.1.1 United States
- 15.1.2 Canada
- 15.1.3 Mexico
- 16. MEA IT Robotic Automation Industry Analysis, Insights and Forecast, 2019-2031
- 16.1. Market Analysis, Insights and Forecast - By Country/Sub-region
- 16.1.1 United Arab Emirates
- 16.1.2 Saudi Arabia
- 16.1.3 South Africa
- 16.1.4 Rest of Middle East and Africa
- 17. Competitive Analysis
- 17.1. Global Market Share Analysis 2024
- 17.2. Company Profiles
- 17.2.1 Jacada Inc
- 17.2.1.1. Overview
- 17.2.1.2. Products
- 17.2.1.3. SWOT Analysis
- 17.2.1.4. Recent Developments
- 17.2.1.5. Financials (Based on Availability)
- 17.2.2 Nice Robotic Automation Ltd
- 17.2.2.1. Overview
- 17.2.2.2. Products
- 17.2.2.3. SWOT Analysis
- 17.2.2.4. Recent Developments
- 17.2.2.5. Financials (Based on Availability)
- 17.2.3 Kofax Inc (Thoma Bravo LLC)
- 17.2.3.1. Overview
- 17.2.3.2. Products
- 17.2.3.3. SWOT Analysis
- 17.2.3.4. Recent Developments
- 17.2.3.5. Financials (Based on Availability)
- 17.2.4 HelpSystems LLC (HGGC)
- 17.2.4.1. Overview
- 17.2.4.2. Products
- 17.2.4.3. SWOT Analysis
- 17.2.4.4. Recent Developments
- 17.2.4.5. Financials (Based on Availability)
- 17.2.5 Jidoka
- 17.2.5.1. Overview
- 17.2.5.2. Products
- 17.2.5.3. SWOT Analysis
- 17.2.5.4. Recent Developments
- 17.2.5.5. Financials (Based on Availability)
- 17.2.6 UIPath Inc
- 17.2.6.1. Overview
- 17.2.6.2. Products
- 17.2.6.3. SWOT Analysis
- 17.2.6.4. Recent Developments
- 17.2.6.5. Financials (Based on Availability)
- 17.2.7 Datamatics Global Services Limited
- 17.2.7.1. Overview
- 17.2.7.2. Products
- 17.2.7.3. SWOT Analysis
- 17.2.7.4. Recent Developments
- 17.2.7.5. Financials (Based on Availability)
- 17.2.8 Automation Anywhere Inc
- 17.2.8.1. Overview
- 17.2.8.2. Products
- 17.2.8.3. SWOT Analysis
- 17.2.8.4. Recent Developments
- 17.2.8.5. Financials (Based on Availability)
- 17.2.9 Be Informed BV (Hoogenberg Beheer BV)
- 17.2.9.1. Overview
- 17.2.9.2. Products
- 17.2.9.3. SWOT Analysis
- 17.2.9.4. Recent Developments
- 17.2.9.5. Financials (Based on Availability)
- 17.2.10 Pegasystems Inc
- 17.2.10.1. Overview
- 17.2.10.2. Products
- 17.2.10.3. SWOT Analysis
- 17.2.10.4. Recent Developments
- 17.2.10.5. Financials (Based on Availability)
- 17.2.11 AutomationEdge Technologies Inc
- 17.2.11.1. Overview
- 17.2.11.2. Products
- 17.2.11.3. SWOT Analysis
- 17.2.11.4. Recent Developments
- 17.2.11.5. Financials (Based on Availability)
- 17.2.12 Blue Prism Group PLC
- 17.2.12.1. Overview
- 17.2.12.2. Products
- 17.2.12.3. SWOT Analysis
- 17.2.12.4. Recent Developments
- 17.2.12.5. Financials (Based on Availability)
- 17.2.13 CGI Inc
- 17.2.13.1. Overview
- 17.2.13.2. Products
- 17.2.13.3. SWOT Analysis
- 17.2.13.4. Recent Developments
- 17.2.13.5. Financials (Based on Availability)
- 17.2.1 Jacada Inc
List of Figures
- Figure 1: Global IT Robotic Automation Industry Revenue Breakdown (Million, %) by Region 2024 & 2032
- Figure 2: Global IT Robotic Automation Industry Volume Breakdown (K Unit, %) by Region 2024 & 2032
- Figure 3: North America IT Robotic Automation Industry Revenue (Million), by Country 2024 & 2032
- Figure 4: North America IT Robotic Automation Industry Volume (K Unit), by Country 2024 & 2032
- Figure 5: North America IT Robotic Automation Industry Revenue Share (%), by Country 2024 & 2032
- Figure 6: North America IT Robotic Automation Industry Volume Share (%), by Country 2024 & 2032
- Figure 7: Europe IT Robotic Automation Industry Revenue (Million), by Country 2024 & 2032
- Figure 8: Europe IT Robotic Automation Industry Volume (K Unit), by Country 2024 & 2032
- Figure 9: Europe IT Robotic Automation Industry Revenue Share (%), by Country 2024 & 2032
- Figure 10: Europe IT Robotic Automation Industry Volume Share (%), by Country 2024 & 2032
- Figure 11: Asia Pacific IT Robotic Automation Industry Revenue (Million), by Country 2024 & 2032
- Figure 12: Asia Pacific IT Robotic Automation Industry Volume (K Unit), by Country 2024 & 2032
- Figure 13: Asia Pacific IT Robotic Automation Industry Revenue Share (%), by Country 2024 & 2032
- Figure 14: Asia Pacific IT Robotic Automation Industry Volume Share (%), by Country 2024 & 2032
- Figure 15: South America IT Robotic Automation Industry Revenue (Million), by Country 2024 & 2032
- Figure 16: South America IT Robotic Automation Industry Volume (K Unit), by Country 2024 & 2032
- Figure 17: South America IT Robotic Automation Industry Revenue Share (%), by Country 2024 & 2032
- Figure 18: South America IT Robotic Automation Industry Volume Share (%), by Country 2024 & 2032
- Figure 19: North America IT Robotic Automation Industry Revenue (Million), by Country 2024 & 2032
- Figure 20: North America IT Robotic Automation Industry Volume (K Unit), by Country 2024 & 2032
- Figure 21: North America IT Robotic Automation Industry Revenue Share (%), by Country 2024 & 2032
- Figure 22: North America IT Robotic Automation Industry Volume Share (%), by Country 2024 & 2032
- Figure 23: MEA IT Robotic Automation Industry Revenue (Million), by Country 2024 & 2032
- Figure 24: MEA IT Robotic Automation Industry Volume (K Unit), by Country 2024 & 2032
- Figure 25: MEA IT Robotic Automation Industry Revenue Share (%), by Country 2024 & 2032
- Figure 26: MEA IT Robotic Automation Industry Volume Share (%), by Country 2024 & 2032
- Figure 27: North America IT Robotic Automation Industry Revenue (Million), by Deployment 2024 & 2032
- Figure 28: North America IT Robotic Automation Industry Volume (K Unit), by Deployment 2024 & 2032
- Figure 29: North America IT Robotic Automation Industry Revenue Share (%), by Deployment 2024 & 2032
- Figure 30: North America IT Robotic Automation Industry Volume Share (%), by Deployment 2024 & 2032
- Figure 31: North America IT Robotic Automation Industry Revenue (Million), by Solution 2024 & 2032
- Figure 32: North America IT Robotic Automation Industry Volume (K Unit), by Solution 2024 & 2032
- Figure 33: North America IT Robotic Automation Industry Revenue Share (%), by Solution 2024 & 2032
- Figure 34: North America IT Robotic Automation Industry Volume Share (%), by Solution 2024 & 2032
- Figure 35: North America IT Robotic Automation Industry Revenue (Million), by Size of Enterprise 2024 & 2032
- Figure 36: North America IT Robotic Automation Industry Volume (K Unit), by Size of Enterprise 2024 & 2032
- Figure 37: North America IT Robotic Automation Industry Revenue Share (%), by Size of Enterprise 2024 & 2032
- Figure 38: North America IT Robotic Automation Industry Volume Share (%), by Size of Enterprise 2024 & 2032
- Figure 39: North America IT Robotic Automation Industry Revenue (Million), by End User Industry 2024 & 2032
- Figure 40: North America IT Robotic Automation Industry Volume (K Unit), by End User Industry 2024 & 2032
- Figure 41: North America IT Robotic Automation Industry Revenue Share (%), by End User Industry 2024 & 2032
- Figure 42: North America IT Robotic Automation Industry Volume Share (%), by End User Industry 2024 & 2032
- Figure 43: North America IT Robotic Automation Industry Revenue (Million), by Country 2024 & 2032
- Figure 44: North America IT Robotic Automation Industry Volume (K Unit), by Country 2024 & 2032
- Figure 45: North America IT Robotic Automation Industry Revenue Share (%), by Country 2024 & 2032
- Figure 46: North America IT Robotic Automation Industry Volume Share (%), by Country 2024 & 2032
- Figure 47: Europe IT Robotic Automation Industry Revenue (Million), by Deployment 2024 & 2032
- Figure 48: Europe IT Robotic Automation Industry Volume (K Unit), by Deployment 2024 & 2032
- Figure 49: Europe IT Robotic Automation Industry Revenue Share (%), by Deployment 2024 & 2032
- Figure 50: Europe IT Robotic Automation Industry Volume Share (%), by Deployment 2024 & 2032
- Figure 51: Europe IT Robotic Automation Industry Revenue (Million), by Solution 2024 & 2032
- Figure 52: Europe IT Robotic Automation Industry Volume (K Unit), by Solution 2024 & 2032
- Figure 53: Europe IT Robotic Automation Industry Revenue Share (%), by Solution 2024 & 2032
- Figure 54: Europe IT Robotic Automation Industry Volume Share (%), by Solution 2024 & 2032
- Figure 55: Europe IT Robotic Automation Industry Revenue (Million), by Size of Enterprise 2024 & 2032
- Figure 56: Europe IT Robotic Automation Industry Volume (K Unit), by Size of Enterprise 2024 & 2032
- Figure 57: Europe IT Robotic Automation Industry Revenue Share (%), by Size of Enterprise 2024 & 2032
- Figure 58: Europe IT Robotic Automation Industry Volume Share (%), by Size of Enterprise 2024 & 2032
- Figure 59: Europe IT Robotic Automation Industry Revenue (Million), by End User Industry 2024 & 2032
- Figure 60: Europe IT Robotic Automation Industry Volume (K Unit), by End User Industry 2024 & 2032
- Figure 61: Europe IT Robotic Automation Industry Revenue Share (%), by End User Industry 2024 & 2032
- Figure 62: Europe IT Robotic Automation Industry Volume Share (%), by End User Industry 2024 & 2032
- Figure 63: Europe IT Robotic Automation Industry Revenue (Million), by Country 2024 & 2032
- Figure 64: Europe IT Robotic Automation Industry Volume (K Unit), by Country 2024 & 2032
- Figure 65: Europe IT Robotic Automation Industry Revenue Share (%), by Country 2024 & 2032
- Figure 66: Europe IT Robotic Automation Industry Volume Share (%), by Country 2024 & 2032
- Figure 67: Asia Pacific IT Robotic Automation Industry Revenue (Million), by Deployment 2024 & 2032
- Figure 68: Asia Pacific IT Robotic Automation Industry Volume (K Unit), by Deployment 2024 & 2032
- Figure 69: Asia Pacific IT Robotic Automation Industry Revenue Share (%), by Deployment 2024 & 2032
- Figure 70: Asia Pacific IT Robotic Automation Industry Volume Share (%), by Deployment 2024 & 2032
- Figure 71: Asia Pacific IT Robotic Automation Industry Revenue (Million), by Solution 2024 & 2032
- Figure 72: Asia Pacific IT Robotic Automation Industry Volume (K Unit), by Solution 2024 & 2032
- Figure 73: Asia Pacific IT Robotic Automation Industry Revenue Share (%), by Solution 2024 & 2032
- Figure 74: Asia Pacific IT Robotic Automation Industry Volume Share (%), by Solution 2024 & 2032
- Figure 75: Asia Pacific IT Robotic Automation Industry Revenue (Million), by Size of Enterprise 2024 & 2032
- Figure 76: Asia Pacific IT Robotic Automation Industry Volume (K Unit), by Size of Enterprise 2024 & 2032
- Figure 77: Asia Pacific IT Robotic Automation Industry Revenue Share (%), by Size of Enterprise 2024 & 2032
- Figure 78: Asia Pacific IT Robotic Automation Industry Volume Share (%), by Size of Enterprise 2024 & 2032
- Figure 79: Asia Pacific IT Robotic Automation Industry Revenue (Million), by End User Industry 2024 & 2032
- Figure 80: Asia Pacific IT Robotic Automation Industry Volume (K Unit), by End User Industry 2024 & 2032
- Figure 81: Asia Pacific IT Robotic Automation Industry Revenue Share (%), by End User Industry 2024 & 2032
- Figure 82: Asia Pacific IT Robotic Automation Industry Volume Share (%), by End User Industry 2024 & 2032
- Figure 83: Asia Pacific IT Robotic Automation Industry Revenue (Million), by Country 2024 & 2032
- Figure 84: Asia Pacific IT Robotic Automation Industry Volume (K Unit), by Country 2024 & 2032
- Figure 85: Asia Pacific IT Robotic Automation Industry Revenue Share (%), by Country 2024 & 2032
- Figure 86: Asia Pacific IT Robotic Automation Industry Volume Share (%), by Country 2024 & 2032
- Figure 87: Latin America IT Robotic Automation Industry Revenue (Million), by Deployment 2024 & 2032
- Figure 88: Latin America IT Robotic Automation Industry Volume (K Unit), by Deployment 2024 & 2032
- Figure 89: Latin America IT Robotic Automation Industry Revenue Share (%), by Deployment 2024 & 2032
- Figure 90: Latin America IT Robotic Automation Industry Volume Share (%), by Deployment 2024 & 2032
- Figure 91: Latin America IT Robotic Automation Industry Revenue (Million), by Solution 2024 & 2032
- Figure 92: Latin America IT Robotic Automation Industry Volume (K Unit), by Solution 2024 & 2032
- Figure 93: Latin America IT Robotic Automation Industry Revenue Share (%), by Solution 2024 & 2032
- Figure 94: Latin America IT Robotic Automation Industry Volume Share (%), by Solution 2024 & 2032
- Figure 95: Latin America IT Robotic Automation Industry Revenue (Million), by Size of Enterprise 2024 & 2032
- Figure 96: Latin America IT Robotic Automation Industry Volume (K Unit), by Size of Enterprise 2024 & 2032
- Figure 97: Latin America IT Robotic Automation Industry Revenue Share (%), by Size of Enterprise 2024 & 2032
- Figure 98: Latin America IT Robotic Automation Industry Volume Share (%), by Size of Enterprise 2024 & 2032
- Figure 99: Latin America IT Robotic Automation Industry Revenue (Million), by End User Industry 2024 & 2032
- Figure 100: Latin America IT Robotic Automation Industry Volume (K Unit), by End User Industry 2024 & 2032
- Figure 101: Latin America IT Robotic Automation Industry Revenue Share (%), by End User Industry 2024 & 2032
- Figure 102: Latin America IT Robotic Automation Industry Volume Share (%), by End User Industry 2024 & 2032
- Figure 103: Latin America IT Robotic Automation Industry Revenue (Million), by Country 2024 & 2032
- Figure 104: Latin America IT Robotic Automation Industry Volume (K Unit), by Country 2024 & 2032
- Figure 105: Latin America IT Robotic Automation Industry Revenue Share (%), by Country 2024 & 2032
- Figure 106: Latin America IT Robotic Automation Industry Volume Share (%), by Country 2024 & 2032
- Figure 107: Middle East and Africa IT Robotic Automation Industry Revenue (Million), by Deployment 2024 & 2032
- Figure 108: Middle East and Africa IT Robotic Automation Industry Volume (K Unit), by Deployment 2024 & 2032
- Figure 109: Middle East and Africa IT Robotic Automation Industry Revenue Share (%), by Deployment 2024 & 2032
- Figure 110: Middle East and Africa IT Robotic Automation Industry Volume Share (%), by Deployment 2024 & 2032
- Figure 111: Middle East and Africa IT Robotic Automation Industry Revenue (Million), by Solution 2024 & 2032
- Figure 112: Middle East and Africa IT Robotic Automation Industry Volume (K Unit), by Solution 2024 & 2032
- Figure 113: Middle East and Africa IT Robotic Automation Industry Revenue Share (%), by Solution 2024 & 2032
- Figure 114: Middle East and Africa IT Robotic Automation Industry Volume Share (%), by Solution 2024 & 2032
- Figure 115: Middle East and Africa IT Robotic Automation Industry Revenue (Million), by Size of Enterprise 2024 & 2032
- Figure 116: Middle East and Africa IT Robotic Automation Industry Volume (K Unit), by Size of Enterprise 2024 & 2032
- Figure 117: Middle East and Africa IT Robotic Automation Industry Revenue Share (%), by Size of Enterprise 2024 & 2032
- Figure 118: Middle East and Africa IT Robotic Automation Industry Volume Share (%), by Size of Enterprise 2024 & 2032
- Figure 119: Middle East and Africa IT Robotic Automation Industry Revenue (Million), by End User Industry 2024 & 2032
- Figure 120: Middle East and Africa IT Robotic Automation Industry Volume (K Unit), by End User Industry 2024 & 2032
- Figure 121: Middle East and Africa IT Robotic Automation Industry Revenue Share (%), by End User Industry 2024 & 2032
- Figure 122: Middle East and Africa IT Robotic Automation Industry Volume Share (%), by End User Industry 2024 & 2032
- Figure 123: Middle East and Africa IT Robotic Automation Industry Revenue (Million), by Country 2024 & 2032
- Figure 124: Middle East and Africa IT Robotic Automation Industry Volume (K Unit), by Country 2024 & 2032
- Figure 125: Middle East and Africa IT Robotic Automation Industry Revenue Share (%), by Country 2024 & 2032
- Figure 126: Middle East and Africa IT Robotic Automation Industry Volume Share (%), by Country 2024 & 2032
List of Tables
- Table 1: Global IT Robotic Automation Industry Revenue Million Forecast, by Region 2019 & 2032
- Table 2: Global IT Robotic Automation Industry Volume K Unit Forecast, by Region 2019 & 2032
- Table 3: Global IT Robotic Automation Industry Revenue Million Forecast, by Deployment 2019 & 2032
- Table 4: Global IT Robotic Automation Industry Volume K Unit Forecast, by Deployment 2019 & 2032
- Table 5: Global IT Robotic Automation Industry Revenue Million Forecast, by Solution 2019 & 2032
- Table 6: Global IT Robotic Automation Industry Volume K Unit Forecast, by Solution 2019 & 2032
- Table 7: Global IT Robotic Automation Industry Revenue Million Forecast, by Size of Enterprise 2019 & 2032
- Table 8: Global IT Robotic Automation Industry Volume K Unit Forecast, by Size of Enterprise 2019 & 2032
- Table 9: Global IT Robotic Automation Industry Revenue Million Forecast, by End User Industry 2019 & 2032
- Table 10: Global IT Robotic Automation Industry Volume K Unit Forecast, by End User Industry 2019 & 2032
- Table 11: Global IT Robotic Automation Industry Revenue Million Forecast, by Region 2019 & 2032
- Table 12: Global IT Robotic Automation Industry Volume K Unit Forecast, by Region 2019 & 2032
- Table 13: Global IT Robotic Automation Industry Revenue Million Forecast, by Country 2019 & 2032
- Table 14: Global IT Robotic Automation Industry Volume K Unit Forecast, by Country 2019 & 2032
- Table 15: United States IT Robotic Automation Industry Revenue (Million) Forecast, by Application 2019 & 2032
- Table 16: United States IT Robotic Automation Industry Volume (K Unit) Forecast, by Application 2019 & 2032
- Table 17: Canada IT Robotic Automation Industry Revenue (Million) Forecast, by Application 2019 & 2032
- Table 18: Canada IT Robotic Automation Industry Volume (K Unit) Forecast, by Application 2019 & 2032
- Table 19: Mexico IT Robotic Automation Industry Revenue (Million) Forecast, by Application 2019 & 2032
- Table 20: Mexico IT Robotic Automation Industry Volume (K Unit) Forecast, by Application 2019 & 2032
- Table 21: Global IT Robotic Automation Industry Revenue Million Forecast, by Country 2019 & 2032
- Table 22: Global IT Robotic Automation Industry Volume K Unit Forecast, by Country 2019 & 2032
- Table 23: Germany IT Robotic Automation Industry Revenue (Million) Forecast, by Application 2019 & 2032
- Table 24: Germany IT Robotic Automation Industry Volume (K Unit) Forecast, by Application 2019 & 2032
- Table 25: United Kingdom IT Robotic Automation Industry Revenue (Million) Forecast, by Application 2019 & 2032
- Table 26: United Kingdom IT Robotic Automation Industry Volume (K Unit) Forecast, by Application 2019 & 2032
- Table 27: France IT Robotic Automation Industry Revenue (Million) Forecast, by Application 2019 & 2032
- Table 28: France IT Robotic Automation Industry Volume (K Unit) Forecast, by Application 2019 & 2032
- Table 29: Spain IT Robotic Automation Industry Revenue (Million) Forecast, by Application 2019 & 2032
- Table 30: Spain IT Robotic Automation Industry Volume (K Unit) Forecast, by Application 2019 & 2032
- Table 31: Italy IT Robotic Automation Industry Revenue (Million) Forecast, by Application 2019 & 2032
- Table 32: Italy IT Robotic Automation Industry Volume (K Unit) Forecast, by Application 2019 & 2032
- Table 33: Spain IT Robotic Automation Industry Revenue (Million) Forecast, by Application 2019 & 2032
- Table 34: Spain IT Robotic Automation Industry Volume (K Unit) Forecast, by Application 2019 & 2032
- Table 35: Belgium IT Robotic Automation Industry Revenue (Million) Forecast, by Application 2019 & 2032
- Table 36: Belgium IT Robotic Automation Industry Volume (K Unit) Forecast, by Application 2019 & 2032
- Table 37: Netherland IT Robotic Automation Industry Revenue (Million) Forecast, by Application 2019 & 2032
- Table 38: Netherland IT Robotic Automation Industry Volume (K Unit) Forecast, by Application 2019 & 2032
- Table 39: Nordics IT Robotic Automation Industry Revenue (Million) Forecast, by Application 2019 & 2032
- Table 40: Nordics IT Robotic Automation Industry Volume (K Unit) Forecast, by Application 2019 & 2032
- Table 41: Rest of Europe IT Robotic Automation Industry Revenue (Million) Forecast, by Application 2019 & 2032
- Table 42: Rest of Europe IT Robotic Automation Industry Volume (K Unit) Forecast, by Application 2019 & 2032
- Table 43: Global IT Robotic Automation Industry Revenue Million Forecast, by Country 2019 & 2032
- Table 44: Global IT Robotic Automation Industry Volume K Unit Forecast, by Country 2019 & 2032
- Table 45: China IT Robotic Automation Industry Revenue (Million) Forecast, by Application 2019 & 2032
- Table 46: China IT Robotic Automation Industry Volume (K Unit) Forecast, by Application 2019 & 2032
- Table 47: Japan IT Robotic Automation Industry Revenue (Million) Forecast, by Application 2019 & 2032
- Table 48: Japan IT Robotic Automation Industry Volume (K Unit) Forecast, by Application 2019 & 2032
- Table 49: India IT Robotic Automation Industry Revenue (Million) Forecast, by Application 2019 & 2032
- Table 50: India IT Robotic Automation Industry Volume (K Unit) Forecast, by Application 2019 & 2032
- Table 51: South Korea IT Robotic Automation Industry Revenue (Million) Forecast, by Application 2019 & 2032
- Table 52: South Korea IT Robotic Automation Industry Volume (K Unit) Forecast, by Application 2019 & 2032
- Table 53: Southeast Asia IT Robotic Automation Industry Revenue (Million) Forecast, by Application 2019 & 2032
- Table 54: Southeast Asia IT Robotic Automation Industry Volume (K Unit) Forecast, by Application 2019 & 2032
- Table 55: Australia IT Robotic Automation Industry Revenue (Million) Forecast, by Application 2019 & 2032
- Table 56: Australia IT Robotic Automation Industry Volume (K Unit) Forecast, by Application 2019 & 2032
- Table 57: Indonesia IT Robotic Automation Industry Revenue (Million) Forecast, by Application 2019 & 2032
- Table 58: Indonesia IT Robotic Automation Industry Volume (K Unit) Forecast, by Application 2019 & 2032
- Table 59: Phillipes IT Robotic Automation Industry Revenue (Million) Forecast, by Application 2019 & 2032
- Table 60: Phillipes IT Robotic Automation Industry Volume (K Unit) Forecast, by Application 2019 & 2032
- Table 61: Singapore IT Robotic Automation Industry Revenue (Million) Forecast, by Application 2019 & 2032
- Table 62: Singapore IT Robotic Automation Industry Volume (K Unit) Forecast, by Application 2019 & 2032
- Table 63: Thailandc IT Robotic Automation Industry Revenue (Million) Forecast, by Application 2019 & 2032
- Table 64: Thailandc IT Robotic Automation Industry Volume (K Unit) Forecast, by Application 2019 & 2032
- Table 65: Rest of Asia Pacific IT Robotic Automation Industry Revenue (Million) Forecast, by Application 2019 & 2032
- Table 66: Rest of Asia Pacific IT Robotic Automation Industry Volume (K Unit) Forecast, by Application 2019 & 2032
- Table 67: Global IT Robotic Automation Industry Revenue Million Forecast, by Country 2019 & 2032
- Table 68: Global IT Robotic Automation Industry Volume K Unit Forecast, by Country 2019 & 2032
- Table 69: Brazil IT Robotic Automation Industry Revenue (Million) Forecast, by Application 2019 & 2032
- Table 70: Brazil IT Robotic Automation Industry Volume (K Unit) Forecast, by Application 2019 & 2032
- Table 71: Argentina IT Robotic Automation Industry Revenue (Million) Forecast, by Application 2019 & 2032
- Table 72: Argentina IT Robotic Automation Industry Volume (K Unit) Forecast, by Application 2019 & 2032
- Table 73: Peru IT Robotic Automation Industry Revenue (Million) Forecast, by Application 2019 & 2032
- Table 74: Peru IT Robotic Automation Industry Volume (K Unit) Forecast, by Application 2019 & 2032
- Table 75: Chile IT Robotic Automation Industry Revenue (Million) Forecast, by Application 2019 & 2032
- Table 76: Chile IT Robotic Automation Industry Volume (K Unit) Forecast, by Application 2019 & 2032
- Table 77: Colombia IT Robotic Automation Industry Revenue (Million) Forecast, by Application 2019 & 2032
- Table 78: Colombia IT Robotic Automation Industry Volume (K Unit) Forecast, by Application 2019 & 2032
- Table 79: Ecuador IT Robotic Automation Industry Revenue (Million) Forecast, by Application 2019 & 2032
- Table 80: Ecuador IT Robotic Automation Industry Volume (K Unit) Forecast, by Application 2019 & 2032
- Table 81: Venezuela IT Robotic Automation Industry Revenue (Million) Forecast, by Application 2019 & 2032
- Table 82: Venezuela IT Robotic Automation Industry Volume (K Unit) Forecast, by Application 2019 & 2032
- Table 83: Rest of South America IT Robotic Automation Industry Revenue (Million) Forecast, by Application 2019 & 2032
- Table 84: Rest of South America IT Robotic Automation Industry Volume (K Unit) Forecast, by Application 2019 & 2032
- Table 85: Global IT Robotic Automation Industry Revenue Million Forecast, by Country 2019 & 2032
- Table 86: Global IT Robotic Automation Industry Volume K Unit Forecast, by Country 2019 & 2032
- Table 87: United States IT Robotic Automation Industry Revenue (Million) Forecast, by Application 2019 & 2032
- Table 88: United States IT Robotic Automation Industry Volume (K Unit) Forecast, by Application 2019 & 2032
- Table 89: Canada IT Robotic Automation Industry Revenue (Million) Forecast, by Application 2019 & 2032
- Table 90: Canada IT Robotic Automation Industry Volume (K Unit) Forecast, by Application 2019 & 2032
- Table 91: Mexico IT Robotic Automation Industry Revenue (Million) Forecast, by Application 2019 & 2032
- Table 92: Mexico IT Robotic Automation Industry Volume (K Unit) Forecast, by Application 2019 & 2032
- Table 93: Global IT Robotic Automation Industry Revenue Million Forecast, by Country 2019 & 2032
- Table 94: Global IT Robotic Automation Industry Volume K Unit Forecast, by Country 2019 & 2032
- Table 95: United Arab Emirates IT Robotic Automation Industry Revenue (Million) Forecast, by Application 2019 & 2032
- Table 96: United Arab Emirates IT Robotic Automation Industry Volume (K Unit) Forecast, by Application 2019 & 2032
- Table 97: Saudi Arabia IT Robotic Automation Industry Revenue (Million) Forecast, by Application 2019 & 2032
- Table 98: Saudi Arabia IT Robotic Automation Industry Volume (K Unit) Forecast, by Application 2019 & 2032
- Table 99: South Africa IT Robotic Automation Industry Revenue (Million) Forecast, by Application 2019 & 2032
- Table 100: South Africa IT Robotic Automation Industry Volume (K Unit) Forecast, by Application 2019 & 2032
- Table 101: Rest of Middle East and Africa IT Robotic Automation Industry Revenue (Million) Forecast, by Application 2019 & 2032
- Table 102: Rest of Middle East and Africa IT Robotic Automation Industry Volume (K Unit) Forecast, by Application 2019 & 2032
- Table 103: Global IT Robotic Automation Industry Revenue Million Forecast, by Deployment 2019 & 2032
- Table 104: Global IT Robotic Automation Industry Volume K Unit Forecast, by Deployment 2019 & 2032
- Table 105: Global IT Robotic Automation Industry Revenue Million Forecast, by Solution 2019 & 2032
- Table 106: Global IT Robotic Automation Industry Volume K Unit Forecast, by Solution 2019 & 2032
- Table 107: Global IT Robotic Automation Industry Revenue Million Forecast, by Size of Enterprise 2019 & 2032
- Table 108: Global IT Robotic Automation Industry Volume K Unit Forecast, by Size of Enterprise 2019 & 2032
- Table 109: Global IT Robotic Automation Industry Revenue Million Forecast, by End User Industry 2019 & 2032
- Table 110: Global IT Robotic Automation Industry Volume K Unit Forecast, by End User Industry 2019 & 2032
- Table 111: Global IT Robotic Automation Industry Revenue Million Forecast, by Country 2019 & 2032
- Table 112: Global IT Robotic Automation Industry Volume K Unit Forecast, by Country 2019 & 2032
- Table 113: Global IT Robotic Automation Industry Revenue Million Forecast, by Deployment 2019 & 2032
- Table 114: Global IT Robotic Automation Industry Volume K Unit Forecast, by Deployment 2019 & 2032
- Table 115: Global IT Robotic Automation Industry Revenue Million Forecast, by Solution 2019 & 2032
- Table 116: Global IT Robotic Automation Industry Volume K Unit Forecast, by Solution 2019 & 2032
- Table 117: Global IT Robotic Automation Industry Revenue Million Forecast, by Size of Enterprise 2019 & 2032
- Table 118: Global IT Robotic Automation Industry Volume K Unit Forecast, by Size of Enterprise 2019 & 2032
- Table 119: Global IT Robotic Automation Industry Revenue Million Forecast, by End User Industry 2019 & 2032
- Table 120: Global IT Robotic Automation Industry Volume K Unit Forecast, by End User Industry 2019 & 2032
- Table 121: Global IT Robotic Automation Industry Revenue Million Forecast, by Country 2019 & 2032
- Table 122: Global IT Robotic Automation Industry Volume K Unit Forecast, by Country 2019 & 2032
- Table 123: Global IT Robotic Automation Industry Revenue Million Forecast, by Deployment 2019 & 2032
- Table 124: Global IT Robotic Automation Industry Volume K Unit Forecast, by Deployment 2019 & 2032
- Table 125: Global IT Robotic Automation Industry Revenue Million Forecast, by Solution 2019 & 2032
- Table 126: Global IT Robotic Automation Industry Volume K Unit Forecast, by Solution 2019 & 2032
- Table 127: Global IT Robotic Automation Industry Revenue Million Forecast, by Size of Enterprise 2019 & 2032
- Table 128: Global IT Robotic Automation Industry Volume K Unit Forecast, by Size of Enterprise 2019 & 2032
- Table 129: Global IT Robotic Automation Industry Revenue Million Forecast, by End User Industry 2019 & 2032
- Table 130: Global IT Robotic Automation Industry Volume K Unit Forecast, by End User Industry 2019 & 2032
- Table 131: Global IT Robotic Automation Industry Revenue Million Forecast, by Country 2019 & 2032
- Table 132: Global IT Robotic Automation Industry Volume K Unit Forecast, by Country 2019 & 2032
- Table 133: Global IT Robotic Automation Industry Revenue Million Forecast, by Deployment 2019 & 2032
- Table 134: Global IT Robotic Automation Industry Volume K Unit Forecast, by Deployment 2019 & 2032
- Table 135: Global IT Robotic Automation Industry Revenue Million Forecast, by Solution 2019 & 2032
- Table 136: Global IT Robotic Automation Industry Volume K Unit Forecast, by Solution 2019 & 2032
- Table 137: Global IT Robotic Automation Industry Revenue Million Forecast, by Size of Enterprise 2019 & 2032
- Table 138: Global IT Robotic Automation Industry Volume K Unit Forecast, by Size of Enterprise 2019 & 2032
- Table 139: Global IT Robotic Automation Industry Revenue Million Forecast, by End User Industry 2019 & 2032
- Table 140: Global IT Robotic Automation Industry Volume K Unit Forecast, by End User Industry 2019 & 2032
- Table 141: Global IT Robotic Automation Industry Revenue Million Forecast, by Country 2019 & 2032
- Table 142: Global IT Robotic Automation Industry Volume K Unit Forecast, by Country 2019 & 2032
- Table 143: Global IT Robotic Automation Industry Revenue Million Forecast, by Deployment 2019 & 2032
- Table 144: Global IT Robotic Automation Industry Volume K Unit Forecast, by Deployment 2019 & 2032
- Table 145: Global IT Robotic Automation Industry Revenue Million Forecast, by Solution 2019 & 2032
- Table 146: Global IT Robotic Automation Industry Volume K Unit Forecast, by Solution 2019 & 2032
- Table 147: Global IT Robotic Automation Industry Revenue Million Forecast, by Size of Enterprise 2019 & 2032
- Table 148: Global IT Robotic Automation Industry Volume K Unit Forecast, by Size of Enterprise 2019 & 2032
- Table 149: Global IT Robotic Automation Industry Revenue Million Forecast, by End User Industry 2019 & 2032
- Table 150: Global IT Robotic Automation Industry Volume K Unit Forecast, by End User Industry 2019 & 2032
- Table 151: Global IT Robotic Automation Industry Revenue Million Forecast, by Country 2019 & 2032
- Table 152: Global IT Robotic Automation Industry Volume K Unit Forecast, by Country 2019 & 2032
Frequently Asked Questions
1. What is the projected Compound Annual Growth Rate (CAGR) of the IT Robotic Automation Industry?
The projected CAGR is approximately 29.70%.
2. Which companies are prominent players in the IT Robotic Automation Industry?
Key companies in the market include Jacada Inc, Nice Robotic Automation Ltd, Kofax Inc (Thoma Bravo LLC), HelpSystems LLC (HGGC), Jidoka, UIPath Inc, Datamatics Global Services Limited, Automation Anywhere Inc, Be Informed BV (Hoogenberg Beheer BV), Pegasystems Inc, AutomationEdge Technologies Inc, Blue Prism Group PLC, CGI Inc.
3. What are the main segments of the IT Robotic Automation Industry?
The market segments include Deployment, Solution, Size of Enterprise, End User Industry.
4. Can you provide details about the market size?
The market size is estimated to be USD 4.02 Million as of 2022.
5. What are some drivers contributing to market growth?
Retail Sector to hold major share in RPA Market; Adoption of AI- and Cloud-based Solutions for Internal Efficiency among SMEs.
6. What are the notable trends driving market growth?
Retail Sector to hold major share in RPA Market.
7. Are there any restraints impacting market growth?
Data Security Concerns.
8. Can you provide examples of recent developments in the market?
September 2022 - UiPath, a leading enterprise automation software company, strengthened its partnership with Snowflake, the Data Cloud company, by launching a new bi-directional integration that extends the value of automation across the enterprise. UiPath and Snowflake enable joint customers to design and build workflows based on 360-degree views of trusted and accessible data on Snowflake's platform. By leveraging the Snowflake Data Cloud, UiPath robots can quickly connect data directly to business processes in the Data Cloud without using complex code, speeding up time to value.
9. What pricing options are available for accessing the report?
Pricing options include single-user, multi-user, and enterprise licenses priced at USD 4750, USD 5250, and USD 8750 respectively.
10. Is the market size provided in terms of value or volume?
The market size is provided in terms of value, measured in Million and volume, measured in K Unit.
11. Are there any specific market keywords associated with the report?
Yes, the market keyword associated with the report is "IT Robotic Automation Industry," which aids in identifying and referencing the specific market segment covered.
12. How do I determine which pricing option suits my needs best?
The pricing options vary based on user requirements and access needs. Individual users may opt for single-user licenses, while businesses requiring broader access may choose multi-user or enterprise licenses for cost-effective access to the report.
13. Are there any additional resources or data provided in the IT Robotic Automation Industry report?
While the report offers comprehensive insights, it's advisable to review the specific contents or supplementary materials provided to ascertain if additional resources or data are available.
14. How can I stay updated on further developments or reports in the IT Robotic Automation Industry?
To stay informed about further developments, trends, and reports in the IT Robotic Automation Industry, consider subscribing to industry newsletters, following relevant companies and organizations, or regularly checking reputable industry news sources and publications.
Methodology
Step 1 - Identification of Relevant Samples Size from Population Database


Step 2 - Approaches for Defining Global Market Size (Value, Volume* & Price*)

Note*: In applicable scenarios
Step 3 - Data Sources
Primary Research
- Web Analytics
- Survey Reports
- Research Institute
- Latest Research Reports
- Opinion Leaders
Secondary Research
- Annual Reports
- White Paper
- Latest Press Release
- Industry Association
- Paid Database
- Investor Presentations

Step 4 - Data Triangulation
Involves using different sources of information in order to increase the validity of a study
These sources are likely to be stakeholders in a program - participants, other researchers, program staff, other community members, and so on.
Then we put all data in single framework & apply various statistical tools to find out the dynamic on the market.
During the analysis stage, feedback from the stakeholder groups would be compared to determine areas of agreement as well as areas of divergence
