

Key Insights
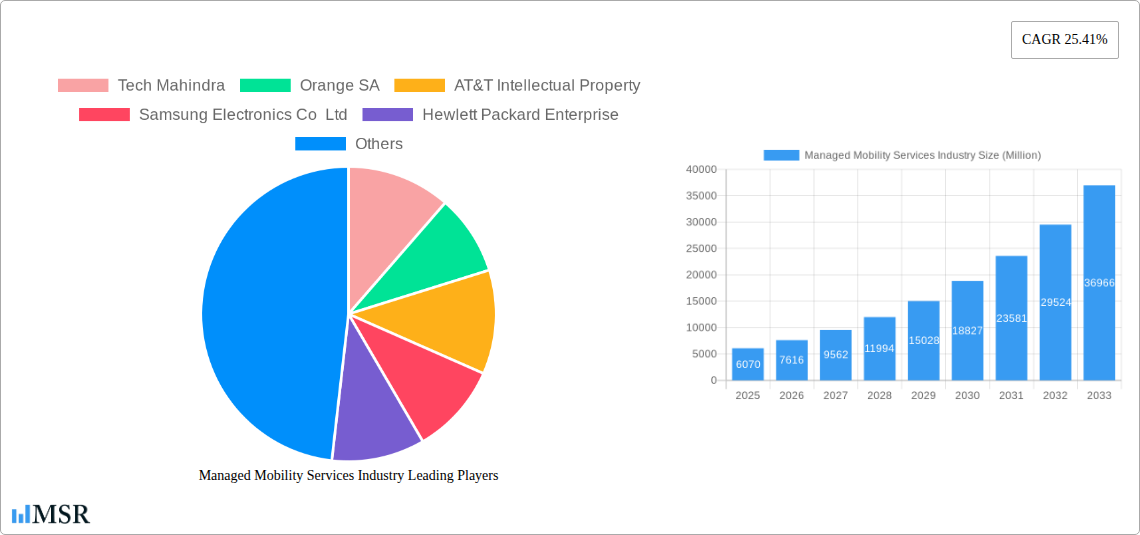
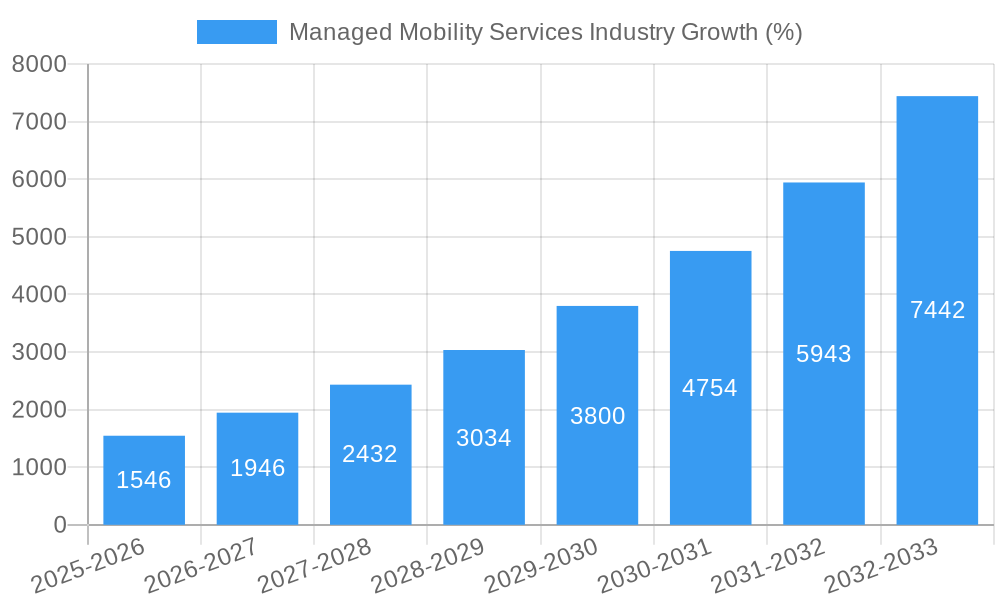
The Managed Mobility Services (MMS) market is experiencing robust growth, projected to reach \$6.07 billion in 2025 and exhibiting a Compound Annual Growth Rate (CAGR) of 25.41%. This expansion is driven by several key factors. The increasing adoption of mobile devices across various sectors, particularly IT and Telecom, BFSI (Banking, Financial Services, and Insurance), and Healthcare, fuels the demand for comprehensive MMS solutions. Businesses are increasingly recognizing the need for secure and efficient management of their mobile workforce and assets, encompassing mobile device management (MDM), mobile application management (MAM), and robust mobile security measures. The shift towards cloud-based deployments offers scalability and cost-effectiveness, further accelerating market growth. The competitive landscape is dynamic, with major players like Tech Mahindra, Orange SA, AT&T, Samsung, and Microsoft vying for market share through innovative solutions and strategic partnerships. Geographic expansion, particularly in rapidly developing economies of Asia-Pacific, is another significant contributor to the market's upward trajectory. The continuous evolution of mobile technologies and the growing need for enhanced security in the face of increasing cyber threats are expected to sustain this positive growth momentum throughout the forecast period (2025-2033).
Continued growth in the MMS market is anticipated through 2033, propelled by several converging trends. The integration of Artificial Intelligence (AI) and Machine Learning (ML) into MMS platforms is enhancing security capabilities and optimizing device management. The Internet of Things (IoT) expansion necessitates robust MMS solutions to manage the increasing number of connected devices. Furthermore, the rising adoption of 5G technology will further fuel demand for sophisticated MMS platforms capable of handling the increased bandwidth and data speeds. However, the market faces challenges such as high initial investment costs for implementation and ongoing maintenance, concerns regarding data privacy and security breaches, and the complexities of managing diverse mobile device ecosystems across various operating systems and vendors. Despite these restraints, the overall market outlook remains positive, with substantial opportunities for growth and innovation in the coming years. The ongoing evolution of mobile technology and increasing reliance on mobile devices for business operations ensure sustained demand for comprehensive and secure MMS solutions.
Managed Mobility Services (MMS) Market Report: 2019-2033
This comprehensive report provides a detailed analysis of the Managed Mobility Services (MMS) industry, offering invaluable insights for stakeholders, investors, and industry professionals. With a study period spanning 2019-2033, a base year of 2025, and a forecast period of 2025-2033, this report delivers a robust understanding of current market dynamics and future growth trajectories. The global MMS market is projected to reach xx Million by 2033, exhibiting a CAGR of xx% during the forecast period.
Managed Mobility Services Industry Market Concentration & Dynamics
The Managed Mobility Services market is characterized by a moderately concentrated landscape, with key players like Tech Mahindra, Orange SA, AT&T Intellectual Property, Samsung Electronics Co Ltd, Hewlett Packard Enterprise, Microsoft Corporation, Kyndryl Inc, Wipro, Telefónica SA, Fujitsu, and Vodafone Group PLC holding significant market share. Market share distribution is dynamic, influenced by ongoing mergers and acquisitions (M&A) activities. The historical period (2019-2024) witnessed approximately xx M&A deals, contributing to market consolidation. Innovation in areas such as AI-powered security and 5G integration is driving competition and reshaping the competitive landscape. Regulatory frameworks, varying by region, impact market access and operations. Substitute products, such as in-house IT management solutions, present challenges, though the increasing complexity of mobile device management favors managed services. End-user trends indicate a growing preference for cloud-based solutions and integrated security features.
Managed Mobility Services Industry Industry Insights & Trends
The Managed Mobility Services market is experiencing robust growth, driven by several key factors. The increasing adoption of mobile devices in various sectors, the growing need for secure and efficient mobile device management, and the rising demand for cloud-based solutions are major contributors. Technological disruptions, such as the advancements in 5G technology and the increasing adoption of Artificial Intelligence (AI) and Machine Learning (ML) in mobile security, are reshaping the industry. The market size in 2025 is estimated at xx Million, reflecting the significant growth potential. Evolving consumer behavior, characterized by a preference for seamless and secure mobile experiences, fuels the demand for advanced MMS solutions. The global market experienced xx% growth between 2024 and 2025, demonstrating the industry's dynamic nature.
Key Markets & Segments Leading Managed Mobility Services Industry
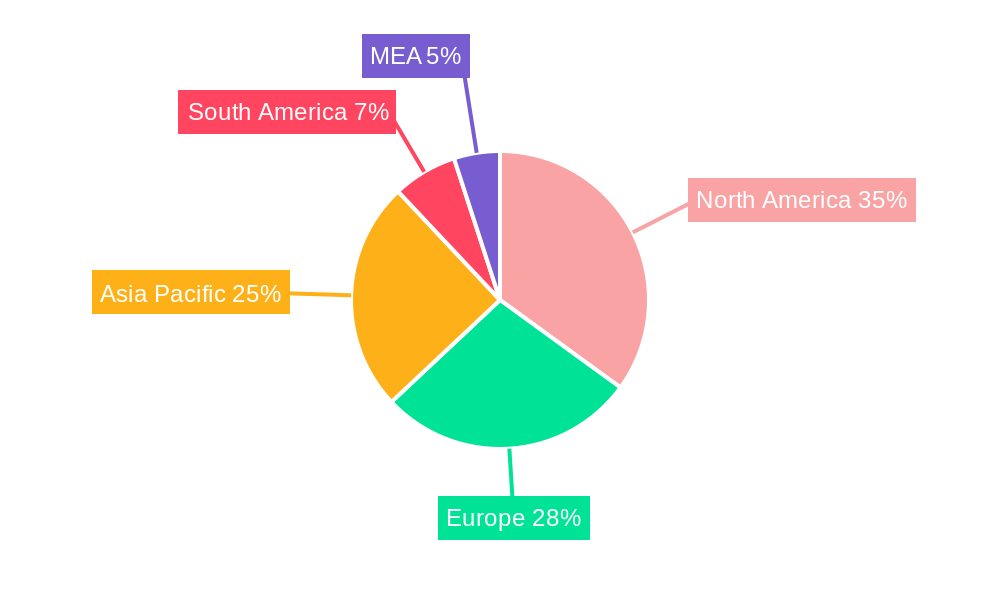
Dominant Region/Country: North America currently holds the largest market share, followed by Europe. The Asia-Pacific region is expected to experience significant growth in the coming years.
By End-user Industry: The IT and Telecom sector is a dominant segment, owing to the high reliance on mobile devices and the need for robust security. BFSI and Healthcare follow closely, driven by the increasing adoption of mobile banking and telehealth solutions. Manufacturing, Retail, and Education are also significant segments experiencing growth.
- Drivers: Strong economic growth in developed nations, coupled with the expansion of digital infrastructure, is a key growth catalyst across all segments. Government initiatives promoting digital transformation are particularly influential.
By Function: Mobile Device Management (MDM) constitutes the largest segment, followed by Mobile Application Management (MAM) and Mobile Security.
By Deployment: Cloud-based deployment is experiencing rapid growth, surpassing on-premise solutions due to cost-effectiveness, scalability, and enhanced security.
The dominance of these segments reflects the increasing reliance on mobile technologies across various industries and the growing need for sophisticated management solutions.
Managed Mobility Services Industry Product Developments
Recent product innovations focus on enhanced security features, incorporating AI and ML for threat detection and response. Integration with cloud platforms and improved user experience are also key areas of development. These advancements provide competitive edges by offering superior security, efficiency, and scalability, enhancing the value proposition for customers. The emergence of AI-driven solutions for predictive maintenance and automated troubleshooting is transforming the landscape.
Challenges in the Managed Mobility Services Industry Market
The Managed Mobility Services industry faces several challenges including: increasing competition, concerns over data privacy and security regulations (e.g., GDPR), supply chain disruptions impacting device availability, and the complexity of integrating diverse mobile devices and platforms. These challenges can significantly impact market growth and profitability. For example, regulatory compliance costs can reduce profit margins by approximately xx%.
Forces Driving Managed Mobility Services Industry Growth
Key growth drivers include technological advancements (e.g., 5G, AI/ML), increasing mobile device adoption across industries, rising demand for secure mobile solutions, government initiatives supporting digital transformation, and the expanding adoption of cloud-based solutions. These factors collectively create a positive outlook for the MMS market.
Challenges in the Managed Mobility Services Industry Market
Long-term growth will be catalyzed by strategic partnerships, fostering innovation in areas like AI-powered security, and expanding into new, high-growth markets. Investment in research and development will also play a vital role, particularly in enhancing security features. The integration of emerging technologies, such as IoT, will offer substantial long-term opportunities.
Emerging Opportunities in Managed Mobility Services Industry
Emerging opportunities lie in the expansion into untapped markets (e.g., developing economies), the integration of IoT devices into MMS platforms, the adoption of innovative security solutions leveraging AI and ML, and the growing demand for specialized MMS solutions for niche industries like healthcare and finance.
Leading Players in the Managed Mobility Services Industry Sector
- Tech Mahindra
- Orange SA
- AT&T Intellectual Property
- Samsung Electronics Co Ltd
- Hewlett Packard Enterprise
- Microsoft Corporation
- Kyndryl Inc
- Wipro
- Telefónica SA
- Fujitsu
- Vodafone Group PLC
Key Milestones in Managed Mobility Services Industry Industry
- February 2023: Kyndryl and Microsoft established a Latin American Center of Excellence, accelerating cloud migration and digital transformation across the region. This partnership significantly impacts market dynamics by boosting cloud adoption.
- February 2023: Telefónica SA partnered with SkydwellerAero Inc. to explore connectivity solutions for underserved regions. This initiative expands market reach and addresses connectivity challenges in remote areas.
Strategic Outlook for Managed Mobility Services Industry Market
The Managed Mobility Services market presents a promising outlook, fueled by sustained technological innovation, increasing demand for secure mobile solutions, and the expansion into new markets. Strategic partnerships, investment in R&D, and a focus on enhancing security features will be crucial for achieving long-term success and capturing substantial market share in the years to come.
Managed Mobility Services Industry Segmentation
-
1. Function
- 1.1. Mobile Device Management
- 1.2. Mobile Application Management
- 1.3. Mobile Security
- 1.4. Other Functions
-
2. Deployment
- 2.1. Cloud
- 2.2. On-premise
-
3. End-user Industry
- 3.1. IT and Telecom
- 3.2. BFSI
- 3.3. Healthcare
- 3.4. Manufacturing
- 3.5. Retail
- 3.6. Education
- 3.7. Other End-user Industries
Managed Mobility Services Industry Segmentation By Geography
-
1. North America
- 1.1. United States
- 1.2. Canada
-
2. Europe
- 2.1. United Kingdom
- 2.2. Germany
- 2.3. France
- 2.4. Rest of Europe
-
3. Asia Pacific
- 3.1. China
- 3.2. India
- 3.3. Japan
- 3.4. Rest of Asia Pacific
-
4. Latin America
- 4.1. Brazil
- 4.2. Argentina
- 4.3. Mexico
- 4.4. Rest of Latin America
-
5. Middle East and Africa
- 5.1. United Arab Emirates
- 5.2. Saudi Arabia
- 5.3. South Africa
- 5.4. Rest of Middle East and Africa
Managed Mobility Services Industry REPORT HIGHLIGHTS
| Aspects | Details |
|---|---|
| Study Period | 2019-2033 |
| Base Year | 2024 |
| Estimated Year | 2025 |
| Forecast Period | 2025-2033 |
| Historical Period | 2019-2024 |
| Growth Rate | CAGR of 25.41% from 2019-2033 |
| Segmentation |
|
Table of Contents
- 1. Introduction
- 1.1. Research Scope
- 1.2. Market Segmentation
- 1.3. Research Methodology
- 1.4. Definitions and Assumptions
- 2. Executive Summary
- 2.1. Introduction
- 3. Market Dynamics
- 3.1. Introduction
- 3.2. Market Drivers
- 3.2.1. Increasing Adoption of BYOD in Multiple Industries; Companies Outsourcing IT Activities
- 3.3. Market Restrains
- 3.3.1. Lack of Control over Operations and Cost Visibility
- 3.4. Market Trends
- 3.4.1. IT and Telecom End-user Industry Segment Holds Significant Market Share
- 4. Market Factor Analysis
- 4.1. Porters Five Forces
- 4.2. Supply/Value Chain
- 4.3. PESTEL analysis
- 4.4. Market Entropy
- 4.5. Patent/Trademark Analysis
- 5. Global Managed Mobility Services Industry Analysis, Insights and Forecast, 2019-2031
- 5.1. Market Analysis, Insights and Forecast - by Function
- 5.1.1. Mobile Device Management
- 5.1.2. Mobile Application Management
- 5.1.3. Mobile Security
- 5.1.4. Other Functions
- 5.2. Market Analysis, Insights and Forecast - by Deployment
- 5.2.1. Cloud
- 5.2.2. On-premise
- 5.3. Market Analysis, Insights and Forecast - by End-user Industry
- 5.3.1. IT and Telecom
- 5.3.2. BFSI
- 5.3.3. Healthcare
- 5.3.4. Manufacturing
- 5.3.5. Retail
- 5.3.6. Education
- 5.3.7. Other End-user Industries
- 5.4. Market Analysis, Insights and Forecast - by Region
- 5.4.1. North America
- 5.4.2. Europe
- 5.4.3. Asia Pacific
- 5.4.4. Latin America
- 5.4.5. Middle East and Africa
- 5.1. Market Analysis, Insights and Forecast - by Function
- 6. North America Managed Mobility Services Industry Analysis, Insights and Forecast, 2019-2031
- 6.1. Market Analysis, Insights and Forecast - by Function
- 6.1.1. Mobile Device Management
- 6.1.2. Mobile Application Management
- 6.1.3. Mobile Security
- 6.1.4. Other Functions
- 6.2. Market Analysis, Insights and Forecast - by Deployment
- 6.2.1. Cloud
- 6.2.2. On-premise
- 6.3. Market Analysis, Insights and Forecast - by End-user Industry
- 6.3.1. IT and Telecom
- 6.3.2. BFSI
- 6.3.3. Healthcare
- 6.3.4. Manufacturing
- 6.3.5. Retail
- 6.3.6. Education
- 6.3.7. Other End-user Industries
- 6.1. Market Analysis, Insights and Forecast - by Function
- 7. Europe Managed Mobility Services Industry Analysis, Insights and Forecast, 2019-2031
- 7.1. Market Analysis, Insights and Forecast - by Function
- 7.1.1. Mobile Device Management
- 7.1.2. Mobile Application Management
- 7.1.3. Mobile Security
- 7.1.4. Other Functions
- 7.2. Market Analysis, Insights and Forecast - by Deployment
- 7.2.1. Cloud
- 7.2.2. On-premise
- 7.3. Market Analysis, Insights and Forecast - by End-user Industry
- 7.3.1. IT and Telecom
- 7.3.2. BFSI
- 7.3.3. Healthcare
- 7.3.4. Manufacturing
- 7.3.5. Retail
- 7.3.6. Education
- 7.3.7. Other End-user Industries
- 7.1. Market Analysis, Insights and Forecast - by Function
- 8. Asia Pacific Managed Mobility Services Industry Analysis, Insights and Forecast, 2019-2031
- 8.1. Market Analysis, Insights and Forecast - by Function
- 8.1.1. Mobile Device Management
- 8.1.2. Mobile Application Management
- 8.1.3. Mobile Security
- 8.1.4. Other Functions
- 8.2. Market Analysis, Insights and Forecast - by Deployment
- 8.2.1. Cloud
- 8.2.2. On-premise
- 8.3. Market Analysis, Insights and Forecast - by End-user Industry
- 8.3.1. IT and Telecom
- 8.3.2. BFSI
- 8.3.3. Healthcare
- 8.3.4. Manufacturing
- 8.3.5. Retail
- 8.3.6. Education
- 8.3.7. Other End-user Industries
- 8.1. Market Analysis, Insights and Forecast - by Function
- 9. Latin America Managed Mobility Services Industry Analysis, Insights and Forecast, 2019-2031
- 9.1. Market Analysis, Insights and Forecast - by Function
- 9.1.1. Mobile Device Management
- 9.1.2. Mobile Application Management
- 9.1.3. Mobile Security
- 9.1.4. Other Functions
- 9.2. Market Analysis, Insights and Forecast - by Deployment
- 9.2.1. Cloud
- 9.2.2. On-premise
- 9.3. Market Analysis, Insights and Forecast - by End-user Industry
- 9.3.1. IT and Telecom
- 9.3.2. BFSI
- 9.3.3. Healthcare
- 9.3.4. Manufacturing
- 9.3.5. Retail
- 9.3.6. Education
- 9.3.7. Other End-user Industries
- 9.1. Market Analysis, Insights and Forecast - by Function
- 10. Middle East and Africa Managed Mobility Services Industry Analysis, Insights and Forecast, 2019-2031
- 10.1. Market Analysis, Insights and Forecast - by Function
- 10.1.1. Mobile Device Management
- 10.1.2. Mobile Application Management
- 10.1.3. Mobile Security
- 10.1.4. Other Functions
- 10.2. Market Analysis, Insights and Forecast - by Deployment
- 10.2.1. Cloud
- 10.2.2. On-premise
- 10.3. Market Analysis, Insights and Forecast - by End-user Industry
- 10.3.1. IT and Telecom
- 10.3.2. BFSI
- 10.3.3. Healthcare
- 10.3.4. Manufacturing
- 10.3.5. Retail
- 10.3.6. Education
- 10.3.7. Other End-user Industries
- 10.1. Market Analysis, Insights and Forecast - by Function
- 11. North America Managed Mobility Services Industry Analysis, Insights and Forecast, 2019-2031
- 11.1. Market Analysis, Insights and Forecast - By Country/Sub-region
- 11.1.1 United States
- 11.1.2 Canada
- 11.1.3 Mexico
- 12. Europe Managed Mobility Services Industry Analysis, Insights and Forecast, 2019-2031
- 12.1. Market Analysis, Insights and Forecast - By Country/Sub-region
- 12.1.1 Germany
- 12.1.2 United Kingdom
- 12.1.3 France
- 12.1.4 Spain
- 12.1.5 Italy
- 12.1.6 Spain
- 12.1.7 Belgium
- 12.1.8 Netherland
- 12.1.9 Nordics
- 12.1.10 Rest of Europe
- 13. Asia Pacific Managed Mobility Services Industry Analysis, Insights and Forecast, 2019-2031
- 13.1. Market Analysis, Insights and Forecast - By Country/Sub-region
- 13.1.1 China
- 13.1.2 Japan
- 13.1.3 India
- 13.1.4 South Korea
- 13.1.5 Southeast Asia
- 13.1.6 Australia
- 13.1.7 Indonesia
- 13.1.8 Phillipes
- 13.1.9 Singapore
- 13.1.10 Thailandc
- 13.1.11 Rest of Asia Pacific
- 14. South America Managed Mobility Services Industry Analysis, Insights and Forecast, 2019-2031
- 14.1. Market Analysis, Insights and Forecast - By Country/Sub-region
- 14.1.1 Brazil
- 14.1.2 Argentina
- 14.1.3 Peru
- 14.1.4 Chile
- 14.1.5 Colombia
- 14.1.6 Ecuador
- 14.1.7 Venezuela
- 14.1.8 Rest of South America
- 15. North America Managed Mobility Services Industry Analysis, Insights and Forecast, 2019-2031
- 15.1. Market Analysis, Insights and Forecast - By Country/Sub-region
- 15.1.1 United States
- 15.1.2 Canada
- 15.1.3 Mexico
- 16. MEA Managed Mobility Services Industry Analysis, Insights and Forecast, 2019-2031
- 16.1. Market Analysis, Insights and Forecast - By Country/Sub-region
- 16.1.1 United Arab Emirates
- 16.1.2 Saudi Arabia
- 16.1.3 South Africa
- 16.1.4 Rest of Middle East and Africa
- 17. Competitive Analysis
- 17.1. Global Market Share Analysis 2024
- 17.2. Company Profiles
- 17.2.1 Tech Mahindra
- 17.2.1.1. Overview
- 17.2.1.2. Products
- 17.2.1.3. SWOT Analysis
- 17.2.1.4. Recent Developments
- 17.2.1.5. Financials (Based on Availability)
- 17.2.2 Orange SA
- 17.2.2.1. Overview
- 17.2.2.2. Products
- 17.2.2.3. SWOT Analysis
- 17.2.2.4. Recent Developments
- 17.2.2.5. Financials (Based on Availability)
- 17.2.3 AT&T Intellectual Property
- 17.2.3.1. Overview
- 17.2.3.2. Products
- 17.2.3.3. SWOT Analysis
- 17.2.3.4. Recent Developments
- 17.2.3.5. Financials (Based on Availability)
- 17.2.4 Samsung Electronics Co Ltd
- 17.2.4.1. Overview
- 17.2.4.2. Products
- 17.2.4.3. SWOT Analysis
- 17.2.4.4. Recent Developments
- 17.2.4.5. Financials (Based on Availability)
- 17.2.5 Hewlett Packard Enterprise
- 17.2.5.1. Overview
- 17.2.5.2. Products
- 17.2.5.3. SWOT Analysis
- 17.2.5.4. Recent Developments
- 17.2.5.5. Financials (Based on Availability)
- 17.2.6 Microsoft Corporation
- 17.2.6.1. Overview
- 17.2.6.2. Products
- 17.2.6.3. SWOT Analysis
- 17.2.6.4. Recent Developments
- 17.2.6.5. Financials (Based on Availability)
- 17.2.7 Kyndryl Inc
- 17.2.7.1. Overview
- 17.2.7.2. Products
- 17.2.7.3. SWOT Analysis
- 17.2.7.4. Recent Developments
- 17.2.7.5. Financials (Based on Availability)
- 17.2.8 Wipro
- 17.2.8.1. Overview
- 17.2.8.2. Products
- 17.2.8.3. SWOT Analysis
- 17.2.8.4. Recent Developments
- 17.2.8.5. Financials (Based on Availability)
- 17.2.9 Telefónica SA
- 17.2.9.1. Overview
- 17.2.9.2. Products
- 17.2.9.3. SWOT Analysis
- 17.2.9.4. Recent Developments
- 17.2.9.5. Financials (Based on Availability)
- 17.2.10 Fujitsu
- 17.2.10.1. Overview
- 17.2.10.2. Products
- 17.2.10.3. SWOT Analysis
- 17.2.10.4. Recent Developments
- 17.2.10.5. Financials (Based on Availability)
- 17.2.11 Vodafone Group PLC
- 17.2.11.1. Overview
- 17.2.11.2. Products
- 17.2.11.3. SWOT Analysis
- 17.2.11.4. Recent Developments
- 17.2.11.5. Financials (Based on Availability)
- 17.2.1 Tech Mahindra
List of Figures
- Figure 1: Global Managed Mobility Services Industry Revenue Breakdown (Million, %) by Region 2024 & 2032
- Figure 2: Global Managed Mobility Services Industry Volume Breakdown (K Unit, %) by Region 2024 & 2032
- Figure 3: North America Managed Mobility Services Industry Revenue (Million), by Country 2024 & 2032
- Figure 4: North America Managed Mobility Services Industry Volume (K Unit), by Country 2024 & 2032
- Figure 5: North America Managed Mobility Services Industry Revenue Share (%), by Country 2024 & 2032
- Figure 6: North America Managed Mobility Services Industry Volume Share (%), by Country 2024 & 2032
- Figure 7: Europe Managed Mobility Services Industry Revenue (Million), by Country 2024 & 2032
- Figure 8: Europe Managed Mobility Services Industry Volume (K Unit), by Country 2024 & 2032
- Figure 9: Europe Managed Mobility Services Industry Revenue Share (%), by Country 2024 & 2032
- Figure 10: Europe Managed Mobility Services Industry Volume Share (%), by Country 2024 & 2032
- Figure 11: Asia Pacific Managed Mobility Services Industry Revenue (Million), by Country 2024 & 2032
- Figure 12: Asia Pacific Managed Mobility Services Industry Volume (K Unit), by Country 2024 & 2032
- Figure 13: Asia Pacific Managed Mobility Services Industry Revenue Share (%), by Country 2024 & 2032
- Figure 14: Asia Pacific Managed Mobility Services Industry Volume Share (%), by Country 2024 & 2032
- Figure 15: South America Managed Mobility Services Industry Revenue (Million), by Country 2024 & 2032
- Figure 16: South America Managed Mobility Services Industry Volume (K Unit), by Country 2024 & 2032
- Figure 17: South America Managed Mobility Services Industry Revenue Share (%), by Country 2024 & 2032
- Figure 18: South America Managed Mobility Services Industry Volume Share (%), by Country 2024 & 2032
- Figure 19: North America Managed Mobility Services Industry Revenue (Million), by Country 2024 & 2032
- Figure 20: North America Managed Mobility Services Industry Volume (K Unit), by Country 2024 & 2032
- Figure 21: North America Managed Mobility Services Industry Revenue Share (%), by Country 2024 & 2032
- Figure 22: North America Managed Mobility Services Industry Volume Share (%), by Country 2024 & 2032
- Figure 23: MEA Managed Mobility Services Industry Revenue (Million), by Country 2024 & 2032
- Figure 24: MEA Managed Mobility Services Industry Volume (K Unit), by Country 2024 & 2032
- Figure 25: MEA Managed Mobility Services Industry Revenue Share (%), by Country 2024 & 2032
- Figure 26: MEA Managed Mobility Services Industry Volume Share (%), by Country 2024 & 2032
- Figure 27: North America Managed Mobility Services Industry Revenue (Million), by Function 2024 & 2032
- Figure 28: North America Managed Mobility Services Industry Volume (K Unit), by Function 2024 & 2032
- Figure 29: North America Managed Mobility Services Industry Revenue Share (%), by Function 2024 & 2032
- Figure 30: North America Managed Mobility Services Industry Volume Share (%), by Function 2024 & 2032
- Figure 31: North America Managed Mobility Services Industry Revenue (Million), by Deployment 2024 & 2032
- Figure 32: North America Managed Mobility Services Industry Volume (K Unit), by Deployment 2024 & 2032
- Figure 33: North America Managed Mobility Services Industry Revenue Share (%), by Deployment 2024 & 2032
- Figure 34: North America Managed Mobility Services Industry Volume Share (%), by Deployment 2024 & 2032
- Figure 35: North America Managed Mobility Services Industry Revenue (Million), by End-user Industry 2024 & 2032
- Figure 36: North America Managed Mobility Services Industry Volume (K Unit), by End-user Industry 2024 & 2032
- Figure 37: North America Managed Mobility Services Industry Revenue Share (%), by End-user Industry 2024 & 2032
- Figure 38: North America Managed Mobility Services Industry Volume Share (%), by End-user Industry 2024 & 2032
- Figure 39: North America Managed Mobility Services Industry Revenue (Million), by Country 2024 & 2032
- Figure 40: North America Managed Mobility Services Industry Volume (K Unit), by Country 2024 & 2032
- Figure 41: North America Managed Mobility Services Industry Revenue Share (%), by Country 2024 & 2032
- Figure 42: North America Managed Mobility Services Industry Volume Share (%), by Country 2024 & 2032
- Figure 43: Europe Managed Mobility Services Industry Revenue (Million), by Function 2024 & 2032
- Figure 44: Europe Managed Mobility Services Industry Volume (K Unit), by Function 2024 & 2032
- Figure 45: Europe Managed Mobility Services Industry Revenue Share (%), by Function 2024 & 2032
- Figure 46: Europe Managed Mobility Services Industry Volume Share (%), by Function 2024 & 2032
- Figure 47: Europe Managed Mobility Services Industry Revenue (Million), by Deployment 2024 & 2032
- Figure 48: Europe Managed Mobility Services Industry Volume (K Unit), by Deployment 2024 & 2032
- Figure 49: Europe Managed Mobility Services Industry Revenue Share (%), by Deployment 2024 & 2032
- Figure 50: Europe Managed Mobility Services Industry Volume Share (%), by Deployment 2024 & 2032
- Figure 51: Europe Managed Mobility Services Industry Revenue (Million), by End-user Industry 2024 & 2032
- Figure 52: Europe Managed Mobility Services Industry Volume (K Unit), by End-user Industry 2024 & 2032
- Figure 53: Europe Managed Mobility Services Industry Revenue Share (%), by End-user Industry 2024 & 2032
- Figure 54: Europe Managed Mobility Services Industry Volume Share (%), by End-user Industry 2024 & 2032
- Figure 55: Europe Managed Mobility Services Industry Revenue (Million), by Country 2024 & 2032
- Figure 56: Europe Managed Mobility Services Industry Volume (K Unit), by Country 2024 & 2032
- Figure 57: Europe Managed Mobility Services Industry Revenue Share (%), by Country 2024 & 2032
- Figure 58: Europe Managed Mobility Services Industry Volume Share (%), by Country 2024 & 2032
- Figure 59: Asia Pacific Managed Mobility Services Industry Revenue (Million), by Function 2024 & 2032
- Figure 60: Asia Pacific Managed Mobility Services Industry Volume (K Unit), by Function 2024 & 2032
- Figure 61: Asia Pacific Managed Mobility Services Industry Revenue Share (%), by Function 2024 & 2032
- Figure 62: Asia Pacific Managed Mobility Services Industry Volume Share (%), by Function 2024 & 2032
- Figure 63: Asia Pacific Managed Mobility Services Industry Revenue (Million), by Deployment 2024 & 2032
- Figure 64: Asia Pacific Managed Mobility Services Industry Volume (K Unit), by Deployment 2024 & 2032
- Figure 65: Asia Pacific Managed Mobility Services Industry Revenue Share (%), by Deployment 2024 & 2032
- Figure 66: Asia Pacific Managed Mobility Services Industry Volume Share (%), by Deployment 2024 & 2032
- Figure 67: Asia Pacific Managed Mobility Services Industry Revenue (Million), by End-user Industry 2024 & 2032
- Figure 68: Asia Pacific Managed Mobility Services Industry Volume (K Unit), by End-user Industry 2024 & 2032
- Figure 69: Asia Pacific Managed Mobility Services Industry Revenue Share (%), by End-user Industry 2024 & 2032
- Figure 70: Asia Pacific Managed Mobility Services Industry Volume Share (%), by End-user Industry 2024 & 2032
- Figure 71: Asia Pacific Managed Mobility Services Industry Revenue (Million), by Country 2024 & 2032
- Figure 72: Asia Pacific Managed Mobility Services Industry Volume (K Unit), by Country 2024 & 2032
- Figure 73: Asia Pacific Managed Mobility Services Industry Revenue Share (%), by Country 2024 & 2032
- Figure 74: Asia Pacific Managed Mobility Services Industry Volume Share (%), by Country 2024 & 2032
- Figure 75: Latin America Managed Mobility Services Industry Revenue (Million), by Function 2024 & 2032
- Figure 76: Latin America Managed Mobility Services Industry Volume (K Unit), by Function 2024 & 2032
- Figure 77: Latin America Managed Mobility Services Industry Revenue Share (%), by Function 2024 & 2032
- Figure 78: Latin America Managed Mobility Services Industry Volume Share (%), by Function 2024 & 2032
- Figure 79: Latin America Managed Mobility Services Industry Revenue (Million), by Deployment 2024 & 2032
- Figure 80: Latin America Managed Mobility Services Industry Volume (K Unit), by Deployment 2024 & 2032
- Figure 81: Latin America Managed Mobility Services Industry Revenue Share (%), by Deployment 2024 & 2032
- Figure 82: Latin America Managed Mobility Services Industry Volume Share (%), by Deployment 2024 & 2032
- Figure 83: Latin America Managed Mobility Services Industry Revenue (Million), by End-user Industry 2024 & 2032
- Figure 84: Latin America Managed Mobility Services Industry Volume (K Unit), by End-user Industry 2024 & 2032
- Figure 85: Latin America Managed Mobility Services Industry Revenue Share (%), by End-user Industry 2024 & 2032
- Figure 86: Latin America Managed Mobility Services Industry Volume Share (%), by End-user Industry 2024 & 2032
- Figure 87: Latin America Managed Mobility Services Industry Revenue (Million), by Country 2024 & 2032
- Figure 88: Latin America Managed Mobility Services Industry Volume (K Unit), by Country 2024 & 2032
- Figure 89: Latin America Managed Mobility Services Industry Revenue Share (%), by Country 2024 & 2032
- Figure 90: Latin America Managed Mobility Services Industry Volume Share (%), by Country 2024 & 2032
- Figure 91: Middle East and Africa Managed Mobility Services Industry Revenue (Million), by Function 2024 & 2032
- Figure 92: Middle East and Africa Managed Mobility Services Industry Volume (K Unit), by Function 2024 & 2032
- Figure 93: Middle East and Africa Managed Mobility Services Industry Revenue Share (%), by Function 2024 & 2032
- Figure 94: Middle East and Africa Managed Mobility Services Industry Volume Share (%), by Function 2024 & 2032
- Figure 95: Middle East and Africa Managed Mobility Services Industry Revenue (Million), by Deployment 2024 & 2032
- Figure 96: Middle East and Africa Managed Mobility Services Industry Volume (K Unit), by Deployment 2024 & 2032
- Figure 97: Middle East and Africa Managed Mobility Services Industry Revenue Share (%), by Deployment 2024 & 2032
- Figure 98: Middle East and Africa Managed Mobility Services Industry Volume Share (%), by Deployment 2024 & 2032
- Figure 99: Middle East and Africa Managed Mobility Services Industry Revenue (Million), by End-user Industry 2024 & 2032
- Figure 100: Middle East and Africa Managed Mobility Services Industry Volume (K Unit), by End-user Industry 2024 & 2032
- Figure 101: Middle East and Africa Managed Mobility Services Industry Revenue Share (%), by End-user Industry 2024 & 2032
- Figure 102: Middle East and Africa Managed Mobility Services Industry Volume Share (%), by End-user Industry 2024 & 2032
- Figure 103: Middle East and Africa Managed Mobility Services Industry Revenue (Million), by Country 2024 & 2032
- Figure 104: Middle East and Africa Managed Mobility Services Industry Volume (K Unit), by Country 2024 & 2032
- Figure 105: Middle East and Africa Managed Mobility Services Industry Revenue Share (%), by Country 2024 & 2032
- Figure 106: Middle East and Africa Managed Mobility Services Industry Volume Share (%), by Country 2024 & 2032
List of Tables
- Table 1: Global Managed Mobility Services Industry Revenue Million Forecast, by Region 2019 & 2032
- Table 2: Global Managed Mobility Services Industry Volume K Unit Forecast, by Region 2019 & 2032
- Table 3: Global Managed Mobility Services Industry Revenue Million Forecast, by Function 2019 & 2032
- Table 4: Global Managed Mobility Services Industry Volume K Unit Forecast, by Function 2019 & 2032
- Table 5: Global Managed Mobility Services Industry Revenue Million Forecast, by Deployment 2019 & 2032
- Table 6: Global Managed Mobility Services Industry Volume K Unit Forecast, by Deployment 2019 & 2032
- Table 7: Global Managed Mobility Services Industry Revenue Million Forecast, by End-user Industry 2019 & 2032
- Table 8: Global Managed Mobility Services Industry Volume K Unit Forecast, by End-user Industry 2019 & 2032
- Table 9: Global Managed Mobility Services Industry Revenue Million Forecast, by Region 2019 & 2032
- Table 10: Global Managed Mobility Services Industry Volume K Unit Forecast, by Region 2019 & 2032
- Table 11: Global Managed Mobility Services Industry Revenue Million Forecast, by Country 2019 & 2032
- Table 12: Global Managed Mobility Services Industry Volume K Unit Forecast, by Country 2019 & 2032
- Table 13: United States Managed Mobility Services Industry Revenue (Million) Forecast, by Application 2019 & 2032
- Table 14: United States Managed Mobility Services Industry Volume (K Unit) Forecast, by Application 2019 & 2032
- Table 15: Canada Managed Mobility Services Industry Revenue (Million) Forecast, by Application 2019 & 2032
- Table 16: Canada Managed Mobility Services Industry Volume (K Unit) Forecast, by Application 2019 & 2032
- Table 17: Mexico Managed Mobility Services Industry Revenue (Million) Forecast, by Application 2019 & 2032
- Table 18: Mexico Managed Mobility Services Industry Volume (K Unit) Forecast, by Application 2019 & 2032
- Table 19: Global Managed Mobility Services Industry Revenue Million Forecast, by Country 2019 & 2032
- Table 20: Global Managed Mobility Services Industry Volume K Unit Forecast, by Country 2019 & 2032
- Table 21: Germany Managed Mobility Services Industry Revenue (Million) Forecast, by Application 2019 & 2032
- Table 22: Germany Managed Mobility Services Industry Volume (K Unit) Forecast, by Application 2019 & 2032
- Table 23: United Kingdom Managed Mobility Services Industry Revenue (Million) Forecast, by Application 2019 & 2032
- Table 24: United Kingdom Managed Mobility Services Industry Volume (K Unit) Forecast, by Application 2019 & 2032
- Table 25: France Managed Mobility Services Industry Revenue (Million) Forecast, by Application 2019 & 2032
- Table 26: France Managed Mobility Services Industry Volume (K Unit) Forecast, by Application 2019 & 2032
- Table 27: Spain Managed Mobility Services Industry Revenue (Million) Forecast, by Application 2019 & 2032
- Table 28: Spain Managed Mobility Services Industry Volume (K Unit) Forecast, by Application 2019 & 2032
- Table 29: Italy Managed Mobility Services Industry Revenue (Million) Forecast, by Application 2019 & 2032
- Table 30: Italy Managed Mobility Services Industry Volume (K Unit) Forecast, by Application 2019 & 2032
- Table 31: Spain Managed Mobility Services Industry Revenue (Million) Forecast, by Application 2019 & 2032
- Table 32: Spain Managed Mobility Services Industry Volume (K Unit) Forecast, by Application 2019 & 2032
- Table 33: Belgium Managed Mobility Services Industry Revenue (Million) Forecast, by Application 2019 & 2032
- Table 34: Belgium Managed Mobility Services Industry Volume (K Unit) Forecast, by Application 2019 & 2032
- Table 35: Netherland Managed Mobility Services Industry Revenue (Million) Forecast, by Application 2019 & 2032
- Table 36: Netherland Managed Mobility Services Industry Volume (K Unit) Forecast, by Application 2019 & 2032
- Table 37: Nordics Managed Mobility Services Industry Revenue (Million) Forecast, by Application 2019 & 2032
- Table 38: Nordics Managed Mobility Services Industry Volume (K Unit) Forecast, by Application 2019 & 2032
- Table 39: Rest of Europe Managed Mobility Services Industry Revenue (Million) Forecast, by Application 2019 & 2032
- Table 40: Rest of Europe Managed Mobility Services Industry Volume (K Unit) Forecast, by Application 2019 & 2032
- Table 41: Global Managed Mobility Services Industry Revenue Million Forecast, by Country 2019 & 2032
- Table 42: Global Managed Mobility Services Industry Volume K Unit Forecast, by Country 2019 & 2032
- Table 43: China Managed Mobility Services Industry Revenue (Million) Forecast, by Application 2019 & 2032
- Table 44: China Managed Mobility Services Industry Volume (K Unit) Forecast, by Application 2019 & 2032
- Table 45: Japan Managed Mobility Services Industry Revenue (Million) Forecast, by Application 2019 & 2032
- Table 46: Japan Managed Mobility Services Industry Volume (K Unit) Forecast, by Application 2019 & 2032
- Table 47: India Managed Mobility Services Industry Revenue (Million) Forecast, by Application 2019 & 2032
- Table 48: India Managed Mobility Services Industry Volume (K Unit) Forecast, by Application 2019 & 2032
- Table 49: South Korea Managed Mobility Services Industry Revenue (Million) Forecast, by Application 2019 & 2032
- Table 50: South Korea Managed Mobility Services Industry Volume (K Unit) Forecast, by Application 2019 & 2032
- Table 51: Southeast Asia Managed Mobility Services Industry Revenue (Million) Forecast, by Application 2019 & 2032
- Table 52: Southeast Asia Managed Mobility Services Industry Volume (K Unit) Forecast, by Application 2019 & 2032
- Table 53: Australia Managed Mobility Services Industry Revenue (Million) Forecast, by Application 2019 & 2032
- Table 54: Australia Managed Mobility Services Industry Volume (K Unit) Forecast, by Application 2019 & 2032
- Table 55: Indonesia Managed Mobility Services Industry Revenue (Million) Forecast, by Application 2019 & 2032
- Table 56: Indonesia Managed Mobility Services Industry Volume (K Unit) Forecast, by Application 2019 & 2032
- Table 57: Phillipes Managed Mobility Services Industry Revenue (Million) Forecast, by Application 2019 & 2032
- Table 58: Phillipes Managed Mobility Services Industry Volume (K Unit) Forecast, by Application 2019 & 2032
- Table 59: Singapore Managed Mobility Services Industry Revenue (Million) Forecast, by Application 2019 & 2032
- Table 60: Singapore Managed Mobility Services Industry Volume (K Unit) Forecast, by Application 2019 & 2032
- Table 61: Thailandc Managed Mobility Services Industry Revenue (Million) Forecast, by Application 2019 & 2032
- Table 62: Thailandc Managed Mobility Services Industry Volume (K Unit) Forecast, by Application 2019 & 2032
- Table 63: Rest of Asia Pacific Managed Mobility Services Industry Revenue (Million) Forecast, by Application 2019 & 2032
- Table 64: Rest of Asia Pacific Managed Mobility Services Industry Volume (K Unit) Forecast, by Application 2019 & 2032
- Table 65: Global Managed Mobility Services Industry Revenue Million Forecast, by Country 2019 & 2032
- Table 66: Global Managed Mobility Services Industry Volume K Unit Forecast, by Country 2019 & 2032
- Table 67: Brazil Managed Mobility Services Industry Revenue (Million) Forecast, by Application 2019 & 2032
- Table 68: Brazil Managed Mobility Services Industry Volume (K Unit) Forecast, by Application 2019 & 2032
- Table 69: Argentina Managed Mobility Services Industry Revenue (Million) Forecast, by Application 2019 & 2032
- Table 70: Argentina Managed Mobility Services Industry Volume (K Unit) Forecast, by Application 2019 & 2032
- Table 71: Peru Managed Mobility Services Industry Revenue (Million) Forecast, by Application 2019 & 2032
- Table 72: Peru Managed Mobility Services Industry Volume (K Unit) Forecast, by Application 2019 & 2032
- Table 73: Chile Managed Mobility Services Industry Revenue (Million) Forecast, by Application 2019 & 2032
- Table 74: Chile Managed Mobility Services Industry Volume (K Unit) Forecast, by Application 2019 & 2032
- Table 75: Colombia Managed Mobility Services Industry Revenue (Million) Forecast, by Application 2019 & 2032
- Table 76: Colombia Managed Mobility Services Industry Volume (K Unit) Forecast, by Application 2019 & 2032
- Table 77: Ecuador Managed Mobility Services Industry Revenue (Million) Forecast, by Application 2019 & 2032
- Table 78: Ecuador Managed Mobility Services Industry Volume (K Unit) Forecast, by Application 2019 & 2032
- Table 79: Venezuela Managed Mobility Services Industry Revenue (Million) Forecast, by Application 2019 & 2032
- Table 80: Venezuela Managed Mobility Services Industry Volume (K Unit) Forecast, by Application 2019 & 2032
- Table 81: Rest of South America Managed Mobility Services Industry Revenue (Million) Forecast, by Application 2019 & 2032
- Table 82: Rest of South America Managed Mobility Services Industry Volume (K Unit) Forecast, by Application 2019 & 2032
- Table 83: Global Managed Mobility Services Industry Revenue Million Forecast, by Country 2019 & 2032
- Table 84: Global Managed Mobility Services Industry Volume K Unit Forecast, by Country 2019 & 2032
- Table 85: United States Managed Mobility Services Industry Revenue (Million) Forecast, by Application 2019 & 2032
- Table 86: United States Managed Mobility Services Industry Volume (K Unit) Forecast, by Application 2019 & 2032
- Table 87: Canada Managed Mobility Services Industry Revenue (Million) Forecast, by Application 2019 & 2032
- Table 88: Canada Managed Mobility Services Industry Volume (K Unit) Forecast, by Application 2019 & 2032
- Table 89: Mexico Managed Mobility Services Industry Revenue (Million) Forecast, by Application 2019 & 2032
- Table 90: Mexico Managed Mobility Services Industry Volume (K Unit) Forecast, by Application 2019 & 2032
- Table 91: Global Managed Mobility Services Industry Revenue Million Forecast, by Country 2019 & 2032
- Table 92: Global Managed Mobility Services Industry Volume K Unit Forecast, by Country 2019 & 2032
- Table 93: United Arab Emirates Managed Mobility Services Industry Revenue (Million) Forecast, by Application 2019 & 2032
- Table 94: United Arab Emirates Managed Mobility Services Industry Volume (K Unit) Forecast, by Application 2019 & 2032
- Table 95: Saudi Arabia Managed Mobility Services Industry Revenue (Million) Forecast, by Application 2019 & 2032
- Table 96: Saudi Arabia Managed Mobility Services Industry Volume (K Unit) Forecast, by Application 2019 & 2032
- Table 97: South Africa Managed Mobility Services Industry Revenue (Million) Forecast, by Application 2019 & 2032
- Table 98: South Africa Managed Mobility Services Industry Volume (K Unit) Forecast, by Application 2019 & 2032
- Table 99: Rest of Middle East and Africa Managed Mobility Services Industry Revenue (Million) Forecast, by Application 2019 & 2032
- Table 100: Rest of Middle East and Africa Managed Mobility Services Industry Volume (K Unit) Forecast, by Application 2019 & 2032
- Table 101: Global Managed Mobility Services Industry Revenue Million Forecast, by Function 2019 & 2032
- Table 102: Global Managed Mobility Services Industry Volume K Unit Forecast, by Function 2019 & 2032
- Table 103: Global Managed Mobility Services Industry Revenue Million Forecast, by Deployment 2019 & 2032
- Table 104: Global Managed Mobility Services Industry Volume K Unit Forecast, by Deployment 2019 & 2032
- Table 105: Global Managed Mobility Services Industry Revenue Million Forecast, by End-user Industry 2019 & 2032
- Table 106: Global Managed Mobility Services Industry Volume K Unit Forecast, by End-user Industry 2019 & 2032
- Table 107: Global Managed Mobility Services Industry Revenue Million Forecast, by Country 2019 & 2032
- Table 108: Global Managed Mobility Services Industry Volume K Unit Forecast, by Country 2019 & 2032
- Table 109: United States Managed Mobility Services Industry Revenue (Million) Forecast, by Application 2019 & 2032
- Table 110: United States Managed Mobility Services Industry Volume (K Unit) Forecast, by Application 2019 & 2032
- Table 111: Canada Managed Mobility Services Industry Revenue (Million) Forecast, by Application 2019 & 2032
- Table 112: Canada Managed Mobility Services Industry Volume (K Unit) Forecast, by Application 2019 & 2032
- Table 113: Global Managed Mobility Services Industry Revenue Million Forecast, by Function 2019 & 2032
- Table 114: Global Managed Mobility Services Industry Volume K Unit Forecast, by Function 2019 & 2032
- Table 115: Global Managed Mobility Services Industry Revenue Million Forecast, by Deployment 2019 & 2032
- Table 116: Global Managed Mobility Services Industry Volume K Unit Forecast, by Deployment 2019 & 2032
- Table 117: Global Managed Mobility Services Industry Revenue Million Forecast, by End-user Industry 2019 & 2032
- Table 118: Global Managed Mobility Services Industry Volume K Unit Forecast, by End-user Industry 2019 & 2032
- Table 119: Global Managed Mobility Services Industry Revenue Million Forecast, by Country 2019 & 2032
- Table 120: Global Managed Mobility Services Industry Volume K Unit Forecast, by Country 2019 & 2032
- Table 121: United Kingdom Managed Mobility Services Industry Revenue (Million) Forecast, by Application 2019 & 2032
- Table 122: United Kingdom Managed Mobility Services Industry Volume (K Unit) Forecast, by Application 2019 & 2032
- Table 123: Germany Managed Mobility Services Industry Revenue (Million) Forecast, by Application 2019 & 2032
- Table 124: Germany Managed Mobility Services Industry Volume (K Unit) Forecast, by Application 2019 & 2032
- Table 125: France Managed Mobility Services Industry Revenue (Million) Forecast, by Application 2019 & 2032
- Table 126: France Managed Mobility Services Industry Volume (K Unit) Forecast, by Application 2019 & 2032
- Table 127: Rest of Europe Managed Mobility Services Industry Revenue (Million) Forecast, by Application 2019 & 2032
- Table 128: Rest of Europe Managed Mobility Services Industry Volume (K Unit) Forecast, by Application 2019 & 2032
- Table 129: Global Managed Mobility Services Industry Revenue Million Forecast, by Function 2019 & 2032
- Table 130: Global Managed Mobility Services Industry Volume K Unit Forecast, by Function 2019 & 2032
- Table 131: Global Managed Mobility Services Industry Revenue Million Forecast, by Deployment 2019 & 2032
- Table 132: Global Managed Mobility Services Industry Volume K Unit Forecast, by Deployment 2019 & 2032
- Table 133: Global Managed Mobility Services Industry Revenue Million Forecast, by End-user Industry 2019 & 2032
- Table 134: Global Managed Mobility Services Industry Volume K Unit Forecast, by End-user Industry 2019 & 2032
- Table 135: Global Managed Mobility Services Industry Revenue Million Forecast, by Country 2019 & 2032
- Table 136: Global Managed Mobility Services Industry Volume K Unit Forecast, by Country 2019 & 2032
- Table 137: China Managed Mobility Services Industry Revenue (Million) Forecast, by Application 2019 & 2032
- Table 138: China Managed Mobility Services Industry Volume (K Unit) Forecast, by Application 2019 & 2032
- Table 139: India Managed Mobility Services Industry Revenue (Million) Forecast, by Application 2019 & 2032
- Table 140: India Managed Mobility Services Industry Volume (K Unit) Forecast, by Application 2019 & 2032
- Table 141: Japan Managed Mobility Services Industry Revenue (Million) Forecast, by Application 2019 & 2032
- Table 142: Japan Managed Mobility Services Industry Volume (K Unit) Forecast, by Application 2019 & 2032
- Table 143: Rest of Asia Pacific Managed Mobility Services Industry Revenue (Million) Forecast, by Application 2019 & 2032
- Table 144: Rest of Asia Pacific Managed Mobility Services Industry Volume (K Unit) Forecast, by Application 2019 & 2032
- Table 145: Global Managed Mobility Services Industry Revenue Million Forecast, by Function 2019 & 2032
- Table 146: Global Managed Mobility Services Industry Volume K Unit Forecast, by Function 2019 & 2032
- Table 147: Global Managed Mobility Services Industry Revenue Million Forecast, by Deployment 2019 & 2032
- Table 148: Global Managed Mobility Services Industry Volume K Unit Forecast, by Deployment 2019 & 2032
- Table 149: Global Managed Mobility Services Industry Revenue Million Forecast, by End-user Industry 2019 & 2032
- Table 150: Global Managed Mobility Services Industry Volume K Unit Forecast, by End-user Industry 2019 & 2032
- Table 151: Global Managed Mobility Services Industry Revenue Million Forecast, by Country 2019 & 2032
- Table 152: Global Managed Mobility Services Industry Volume K Unit Forecast, by Country 2019 & 2032
- Table 153: Brazil Managed Mobility Services Industry Revenue (Million) Forecast, by Application 2019 & 2032
- Table 154: Brazil Managed Mobility Services Industry Volume (K Unit) Forecast, by Application 2019 & 2032
- Table 155: Argentina Managed Mobility Services Industry Revenue (Million) Forecast, by Application 2019 & 2032
- Table 156: Argentina Managed Mobility Services Industry Volume (K Unit) Forecast, by Application 2019 & 2032
- Table 157: Mexico Managed Mobility Services Industry Revenue (Million) Forecast, by Application 2019 & 2032
- Table 158: Mexico Managed Mobility Services Industry Volume (K Unit) Forecast, by Application 2019 & 2032
- Table 159: Rest of Latin America Managed Mobility Services Industry Revenue (Million) Forecast, by Application 2019 & 2032
- Table 160: Rest of Latin America Managed Mobility Services Industry Volume (K Unit) Forecast, by Application 2019 & 2032
- Table 161: Global Managed Mobility Services Industry Revenue Million Forecast, by Function 2019 & 2032
- Table 162: Global Managed Mobility Services Industry Volume K Unit Forecast, by Function 2019 & 2032
- Table 163: Global Managed Mobility Services Industry Revenue Million Forecast, by Deployment 2019 & 2032
- Table 164: Global Managed Mobility Services Industry Volume K Unit Forecast, by Deployment 2019 & 2032
- Table 165: Global Managed Mobility Services Industry Revenue Million Forecast, by End-user Industry 2019 & 2032
- Table 166: Global Managed Mobility Services Industry Volume K Unit Forecast, by End-user Industry 2019 & 2032
- Table 167: Global Managed Mobility Services Industry Revenue Million Forecast, by Country 2019 & 2032
- Table 168: Global Managed Mobility Services Industry Volume K Unit Forecast, by Country 2019 & 2032
- Table 169: United Arab Emirates Managed Mobility Services Industry Revenue (Million) Forecast, by Application 2019 & 2032
- Table 170: United Arab Emirates Managed Mobility Services Industry Volume (K Unit) Forecast, by Application 2019 & 2032
- Table 171: Saudi Arabia Managed Mobility Services Industry Revenue (Million) Forecast, by Application 2019 & 2032
- Table 172: Saudi Arabia Managed Mobility Services Industry Volume (K Unit) Forecast, by Application 2019 & 2032
- Table 173: South Africa Managed Mobility Services Industry Revenue (Million) Forecast, by Application 2019 & 2032
- Table 174: South Africa Managed Mobility Services Industry Volume (K Unit) Forecast, by Application 2019 & 2032
- Table 175: Rest of Middle East and Africa Managed Mobility Services Industry Revenue (Million) Forecast, by Application 2019 & 2032
- Table 176: Rest of Middle East and Africa Managed Mobility Services Industry Volume (K Unit) Forecast, by Application 2019 & 2032
Frequently Asked Questions
1. What is the projected Compound Annual Growth Rate (CAGR) of the Managed Mobility Services Industry?
The projected CAGR is approximately 25.41%.
2. Which companies are prominent players in the Managed Mobility Services Industry?
Key companies in the market include Tech Mahindra, Orange SA, AT&T Intellectual Property, Samsung Electronics Co Ltd, Hewlett Packard Enterprise, Microsoft Corporation, Kyndryl Inc, Wipro, Telefónica SA, Fujitsu, Vodafone Group PLC.
3. What are the main segments of the Managed Mobility Services Industry?
The market segments include Function, Deployment, End-user Industry.
4. Can you provide details about the market size?
The market size is estimated to be USD 6.07 Million as of 2022.
5. What are some drivers contributing to market growth?
Increasing Adoption of BYOD in Multiple Industries; Companies Outsourcing IT Activities.
6. What are the notable trends driving market growth?
IT and Telecom End-user Industry Segment Holds Significant Market Share.
7. Are there any restraints impacting market growth?
Lack of Control over Operations and Cost Visibility.
8. Can you provide examples of recent developments in the market?
February 2023: Kyndryland Microsoft established its first Latin American Center of Excellence with multidisciplinary teams in Brazil, Colombia, Mexico, and Peru. The center combines Kyndryl'sexpertise and understanding of mission-critical IT systems with the Microsoft Cloud to assist companies in the region in accelerating their digital transformation journeys. Organizations throughout Latin America have identified the need to modernize their IT structures and legacy systems by migrating to cloud environments. This will allow them to increase hybrid cloud speed and agility. According to IDC, the cloud market in the region will grow by more than 30% by 2023. Furthermore, the Kyndryland Microsoft Center of Excellence will be a central hub of information, resources, and skills related to Microsoft technologies to support enterprise customers throughout Latin America. Kyndryl's experts in solutions, consulting, and managed services, will collaborate with Microsoft architects and technical staff to co-create replicable assets, conduct proof of concepts (POCs), and scale innovation best practices.
9. What pricing options are available for accessing the report?
Pricing options include single-user, multi-user, and enterprise licenses priced at USD 4750, USD 5250, and USD 8750 respectively.
10. Is the market size provided in terms of value or volume?
The market size is provided in terms of value, measured in Million and volume, measured in K Unit.
11. Are there any specific market keywords associated with the report?
Yes, the market keyword associated with the report is "Managed Mobility Services Industry," which aids in identifying and referencing the specific market segment covered.
12. How do I determine which pricing option suits my needs best?
The pricing options vary based on user requirements and access needs. Individual users may opt for single-user licenses, while businesses requiring broader access may choose multi-user or enterprise licenses for cost-effective access to the report.
13. Are there any additional resources or data provided in the Managed Mobility Services Industry report?
While the report offers comprehensive insights, it's advisable to review the specific contents or supplementary materials provided to ascertain if additional resources or data are available.
14. How can I stay updated on further developments or reports in the Managed Mobility Services Industry?
To stay informed about further developments, trends, and reports in the Managed Mobility Services Industry, consider subscribing to industry newsletters, following relevant companies and organizations, or regularly checking reputable industry news sources and publications.
Methodology
Step 1 - Identification of Relevant Samples Size from Population Database


Step 2 - Approaches for Defining Global Market Size (Value, Volume* & Price*)

Note*: In applicable scenarios
Step 3 - Data Sources
Primary Research
- Web Analytics
- Survey Reports
- Research Institute
- Latest Research Reports
- Opinion Leaders
Secondary Research
- Annual Reports
- White Paper
- Latest Press Release
- Industry Association
- Paid Database
- Investor Presentations

Step 4 - Data Triangulation
Involves using different sources of information in order to increase the validity of a study
These sources are likely to be stakeholders in a program - participants, other researchers, program staff, other community members, and so on.
Then we put all data in single framework & apply various statistical tools to find out the dynamic on the market.
During the analysis stage, feedback from the stakeholder groups would be compared to determine areas of agreement as well as areas of divergence
