

Key Insights
The photoelectric switch sensor market, valued at $1917 million in 2017 and exhibiting a Compound Annual Growth Rate (CAGR) of 7.2%, is poised for significant expansion. Driven by increasing automation across diverse industries like manufacturing, logistics, and automotive, the market is witnessing a surge in demand for high-precision, versatile sensors. Technological advancements, such as the integration of smart sensors with IoT capabilities and the development of more compact and energy-efficient designs, are further fueling market growth. While supply chain disruptions and fluctuating raw material prices present some challenges, the overall trend indicates a robust and expanding market. The segment breakdown likely includes variations based on sensor type (e.g., through-beam, retro-reflective, diffuse-reflective), range, and application. Key players like Omron, Keyence, and Banner Engineering are leveraging their established market presence and technological expertise to cater to this growing demand, introducing innovative products and expanding their geographical reach. Increased adoption in emerging economies, particularly in Asia-Pacific, driven by industrialization and infrastructure development, is contributing substantially to market expansion.
The forecast for the photoelectric switch sensor market through 2033 is positive. Continued automation trends across various industries, including the ongoing growth of e-commerce and its related logistics needs, predict a sustained increase in demand. The market is expected to see a shift towards more sophisticated sensors with enhanced functionalities, particularly in areas requiring higher accuracy and faster response times. Competitive pressures are driving innovation, with companies continuously investing in research and development to offer improved sensor performance, durability, and cost-effectiveness. Strategic partnerships, mergers, and acquisitions within the industry will continue shaping the competitive landscape, potentially leading to further consolidation. While economic fluctuations may influence growth rates in certain periods, the long-term outlook for photoelectric switch sensors remains strong, supported by the underlying technological advancements and increasing industrial automation.
Photoelectric Switch Sensor Market Report: 2019-2033 - A Comprehensive Analysis
This comprehensive report provides an in-depth analysis of the global photoelectric switch sensor market, covering the period 2019-2033. With a focus on market dynamics, key players, and future trends, this report is an essential resource for industry stakeholders, investors, and researchers seeking to understand and capitalize on this dynamic market. The global market size is projected to reach xx million by 2033, showcasing substantial growth potential. This report meticulously analyzes market concentration, technological advancements, and key regional trends to offer actionable insights.
Photoelectric Switch Sensor Market Concentration & Dynamics
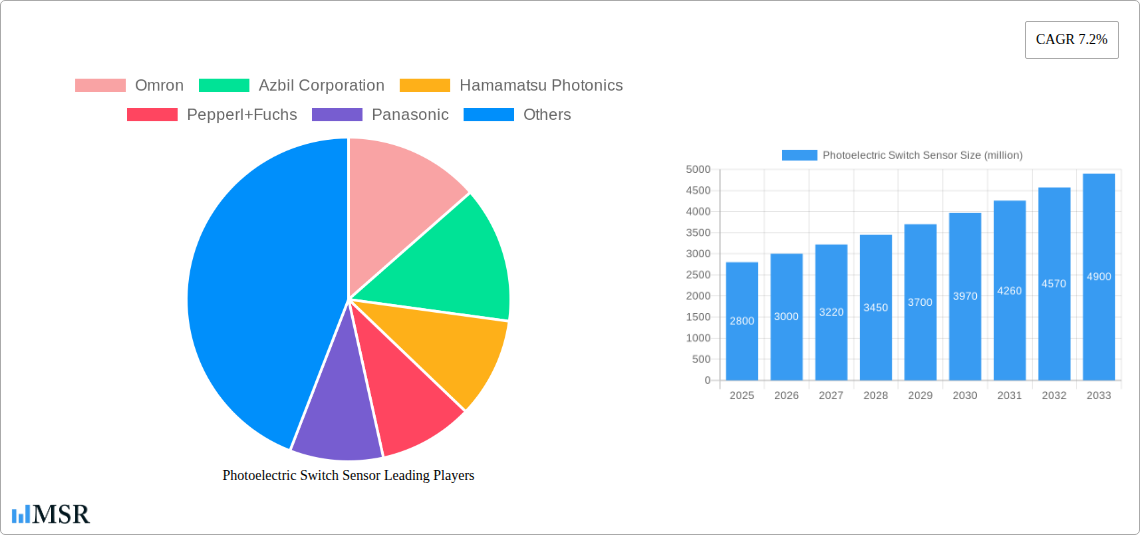
The global photoelectric switch sensor market is characterized by a moderately concentrated landscape, with several major players holding significant market share. Omron, Omron, Azbil Corporation, Hamamatsu Photonics, Pepperl+Fuchs, Panasonic, di-soric, Eaton, Banner, Telemecanique Sensors, Carlo Gavazzi, KEYENCE Singapore, IBEST ELECTRICAL, Shenzhen Shenwu Sensor, and Intellisense (XIAMEN) MICROELECTRONICS Ltd. are among the key players shaping market dynamics.
- Market Share: Omron and KEYENCE Singapore, for example, are estimated to hold approximately xx% and xx% of the market share in 2025, respectively, illustrating the dominance of established players. However, smaller players are also contributing to market growth through niche applications and regional dominance.
- M&A Activity: The historical period (2019-2024) witnessed approximately xx M&A deals in the photoelectric switch sensor market. These deals primarily focused on expanding product portfolios, gaining access to new technologies, and increasing geographic reach. This activity is expected to continue at a similar pace in the forecast period, driven by the desire for market consolidation.
- Innovation Ecosystem: The market is highly dynamic, fueled by continuous innovation in sensor technology, particularly in areas like improved accuracy, faster response times, and miniaturization. Strong R&D investments and collaborations between sensor manufacturers and end-users are driving this innovation.
- Regulatory Frameworks: Varying international and regional regulations related to safety and industrial standards significantly impact the adoption and manufacturing of photoelectric switch sensors. These regulations influence the market's development and product specifications.
- Substitute Products: While photoelectric sensors offer significant advantages in terms of accuracy and non-contact sensing, other sensing technologies such as ultrasonic, capacitive, and inductive sensors exist, offering competition and shaping market strategies.
- End-User Trends: The increasing automation across various industries, including automotive, manufacturing, and logistics, is a major driver for the growth of the photoelectric switch sensor market. The demand for higher precision and increased efficiency in automated systems drives the adoption of advanced sensor technologies.
Photoelectric Switch Sensor Industry Insights & Trends
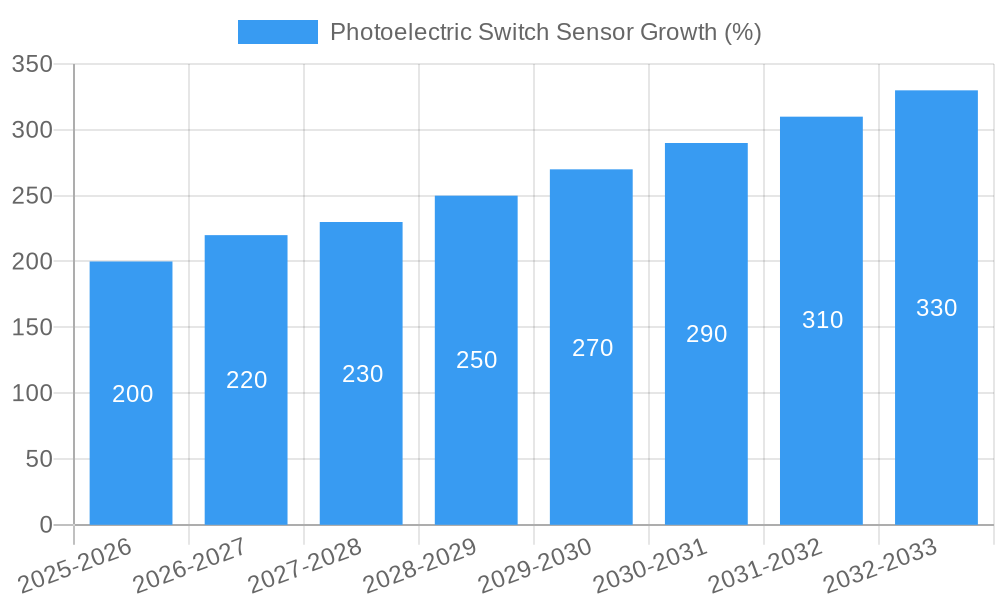
The global photoelectric switch sensor market experienced robust growth during the historical period (2019-2024), with a CAGR of approximately xx%. This growth is projected to continue in the forecast period (2025-2033), driven by several key factors. The market size is estimated to be xx million in 2025 and is expected to reach xx million by 2033. The increasing adoption of automation in diverse industrial sectors is a primary growth driver. Technological advancements, such as the introduction of high-speed, miniature sensors with enhanced features like integrated signal processing, have expanded the applications of these sensors. Furthermore, evolving consumer preferences toward increased safety and reliability in industrial and commercial applications drive the market's growth. The rising demand for sophisticated sensor technologies in smart factories, robotics, and other advanced systems significantly contributes to the market expansion. Furthermore, increasing investments in R&D and government initiatives promoting automation are further fueling market growth. The market is also witnessing a rise in demand for customized solutions, reflecting the varied needs of different industries and applications.
Key Markets & Segments Leading Photoelectric Switch Sensor
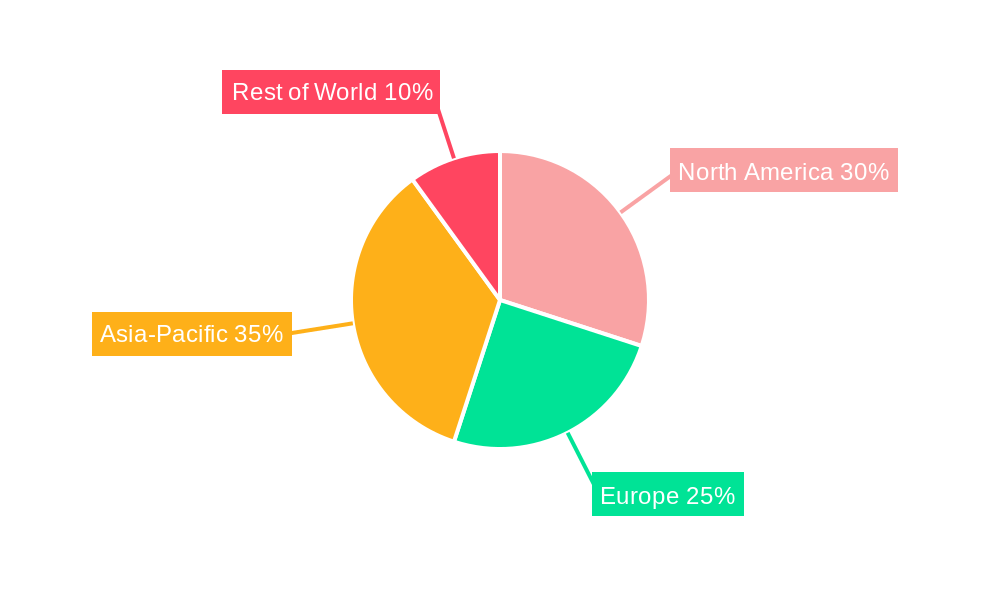
The Asia-Pacific region is currently the dominant market for photoelectric switch sensors, driven by rapid industrialization, particularly in countries like China, Japan, and South Korea.
- Drivers for Dominance in Asia-Pacific:
- Rapid Economic Growth: Strong economic growth in several Asian countries fuels high demand for automation in manufacturing and other industries.
- Robust Infrastructure Development: Significant investments in infrastructure create a substantial need for advanced sensing technologies.
- Growing Automation Adoption: The increased automation across diverse sectors directly correlates with a higher demand for photoelectric sensors.
- Favorable Government Policies: Supportive government policies promoting industrial automation incentivize the adoption of sophisticated sensors.
The dominance of the Asia-Pacific region is expected to continue during the forecast period, albeit with a gradual increase in market share from other regions like North America and Europe as automation adoption increases globally.
Photoelectric Switch Sensor Product Developments
Recent product innovations focus on miniaturization, enhanced performance, and expanded functionality. The integration of advanced signal processing capabilities directly within the sensors allows for improved accuracy and faster response times. New designs feature improved durability and resistance to environmental factors. The applications of these sensors are expanding beyond traditional industrial applications to include areas such as healthcare, logistics, and smart homes. These developments are crucial in maintaining a competitive edge and catering to the evolving needs of diverse industries.
Challenges in the Photoelectric Switch Sensor Market
The photoelectric switch sensor market faces several challenges, including:
- Supply Chain Disruptions: Global supply chain disruptions can lead to increased material costs and production delays impacting market stability and profitability. The impact is estimated at approximately xx million in lost revenue annually.
- Intense Competition: The market is intensely competitive, with many established and emerging players. This competition exerts pressure on pricing and margins.
- Regulatory Hurdles: Varying international and regional regulations related to safety and environmental standards add complexity to manufacturing and distribution.
Forces Driving Photoelectric Switch Sensor Growth
The growth of the photoelectric switch sensor market is fueled by several key factors:
- Technological Advancements: Continuous innovation leading to improved sensor performance, miniaturization, and expanded functionality.
- Increased Automation: The ongoing trend towards automation across diverse industrial sectors is a significant growth driver.
- Favorable Government Policies: Government initiatives promoting industrial automation and technological advancements further support market expansion.
Long-Term Growth Catalysts in the Photoelectric Switch Sensor Market
Long-term growth in the photoelectric switch sensor market will be driven by strategic partnerships between sensor manufacturers and technology providers to develop innovative solutions, along with significant expansions into new markets, like the burgeoning IoT (Internet of Things) sector, and continued innovations in sensor technology leading to higher precision and performance.
Emerging Opportunities in Photoelectric Switch Sensor
Emerging opportunities exist in the development of advanced sensor technologies for specific applications, such as high-temperature environments or harsh industrial settings. Expanding into new and growing markets, such as autonomous vehicles and robotics, offers significant growth potential. Furthermore, developing sensor solutions with integrated data analytics and connectivity capabilities presents substantial opportunities.
Leading Players in the Photoelectric Switch Sensor Sector
- Omron
- Azbil Corporation
- Hamamatsu Photonics
- Pepperl+Fuchs
- Panasonic
- di-soric
- Eaton
- Banner
- Telemecanique Sensors
- Carlo Gavazzi
- KEYENCE Singapore
- IBEST ELECTRICAL
- Shenzhen Shenwu Sensor
- Intellisense (XIAMEN) MICROELECTRONICS Ltd.
Key Milestones in Photoelectric Switch Sensor Industry
- 2020: Introduction of xx million high-speed photoelectric sensors by Omron.
- 2022: Acquisition of xx company by KEYENCE Singapore, expanding its market reach and product portfolio.
- 2023: Launch of xx million miniature photoelectric switch sensor by Panasonic, targeting niche applications in consumer electronics.
Strategic Outlook for Photoelectric Switch Sensor Market
The future of the photoelectric switch sensor market appears promising, with continued growth driven by technological innovation, increased automation across industries, and expansion into new application areas. Strategic partnerships, targeted investments in R&D, and a focus on developing customized sensor solutions will be key success factors for players in this competitive market. The market's long-term potential remains significant due to continued advancements in sensing technologies and their integration into emerging technologies.
Photoelectric Switch Sensor Segmentation
-
1. Application
- 1.1. Industrial Automation
- 1.2. Automotive Manufacturing
- 1.3. Logistics
- 1.4. Medical Equipments
- 1.5. Others
-
2. Type
- 2.1. Transmitter Type
- 2.2. Regression Reflection Type
- 2.3. Diffuse Reflection Type
Photoelectric Switch Sensor Segmentation By Geography
-
1. North America
- 1.1. United States
- 1.2. Canada
- 1.3. Mexico
-
2. South America
- 2.1. Brazil
- 2.2. Argentina
- 2.3. Rest of South America
-
3. Europe
- 3.1. United Kingdom
- 3.2. Germany
- 3.3. France
- 3.4. Italy
- 3.5. Spain
- 3.6. Russia
- 3.7. Benelux
- 3.8. Nordics
- 3.9. Rest of Europe
-
4. Middle East & Africa
- 4.1. Turkey
- 4.2. Israel
- 4.3. GCC
- 4.4. North Africa
- 4.5. South Africa
- 4.6. Rest of Middle East & Africa
-
5. Asia Pacific
- 5.1. China
- 5.2. India
- 5.3. Japan
- 5.4. South Korea
- 5.5. ASEAN
- 5.6. Oceania
- 5.7. Rest of Asia Pacific
Photoelectric Switch Sensor REPORT HIGHLIGHTS
| Aspects | Details |
|---|---|
| Study Period | 2019-2033 |
| Base Year | 2024 |
| Estimated Year | 2025 |
| Forecast Period | 2025-2033 |
| Historical Period | 2019-2024 |
| Growth Rate | CAGR of 7.2% from 2019-2033 |
| Segmentation |
|
Table of Contents
- 1. Introduction
- 1.1. Research Scope
- 1.2. Market Segmentation
- 1.3. Research Methodology
- 1.4. Definitions and Assumptions
- 2. Executive Summary
- 2.1. Introduction
- 3. Market Dynamics
- 3.1. Introduction
- 3.2. Market Drivers
- 3.3. Market Restrains
- 3.4. Market Trends
- 4. Market Factor Analysis
- 4.1. Porters Five Forces
- 4.2. Supply/Value Chain
- 4.3. PESTEL analysis
- 4.4. Market Entropy
- 4.5. Patent/Trademark Analysis
- 5. Global Photoelectric Switch Sensor Analysis, Insights and Forecast, 2019-2031
- 5.1. Market Analysis, Insights and Forecast - by Application
- 5.1.1. Industrial Automation
- 5.1.2. Automotive Manufacturing
- 5.1.3. Logistics
- 5.1.4. Medical Equipments
- 5.1.5. Others
- 5.2. Market Analysis, Insights and Forecast - by Type
- 5.2.1. Transmitter Type
- 5.2.2. Regression Reflection Type
- 5.2.3. Diffuse Reflection Type
- 5.3. Market Analysis, Insights and Forecast - by Region
- 5.3.1. North America
- 5.3.2. South America
- 5.3.3. Europe
- 5.3.4. Middle East & Africa
- 5.3.5. Asia Pacific
- 5.1. Market Analysis, Insights and Forecast - by Application
- 6. North America Photoelectric Switch Sensor Analysis, Insights and Forecast, 2019-2031
- 6.1. Market Analysis, Insights and Forecast - by Application
- 6.1.1. Industrial Automation
- 6.1.2. Automotive Manufacturing
- 6.1.3. Logistics
- 6.1.4. Medical Equipments
- 6.1.5. Others
- 6.2. Market Analysis, Insights and Forecast - by Type
- 6.2.1. Transmitter Type
- 6.2.2. Regression Reflection Type
- 6.2.3. Diffuse Reflection Type
- 6.1. Market Analysis, Insights and Forecast - by Application
- 7. South America Photoelectric Switch Sensor Analysis, Insights and Forecast, 2019-2031
- 7.1. Market Analysis, Insights and Forecast - by Application
- 7.1.1. Industrial Automation
- 7.1.2. Automotive Manufacturing
- 7.1.3. Logistics
- 7.1.4. Medical Equipments
- 7.1.5. Others
- 7.2. Market Analysis, Insights and Forecast - by Type
- 7.2.1. Transmitter Type
- 7.2.2. Regression Reflection Type
- 7.2.3. Diffuse Reflection Type
- 7.1. Market Analysis, Insights and Forecast - by Application
- 8. Europe Photoelectric Switch Sensor Analysis, Insights and Forecast, 2019-2031
- 8.1. Market Analysis, Insights and Forecast - by Application
- 8.1.1. Industrial Automation
- 8.1.2. Automotive Manufacturing
- 8.1.3. Logistics
- 8.1.4. Medical Equipments
- 8.1.5. Others
- 8.2. Market Analysis, Insights and Forecast - by Type
- 8.2.1. Transmitter Type
- 8.2.2. Regression Reflection Type
- 8.2.3. Diffuse Reflection Type
- 8.1. Market Analysis, Insights and Forecast - by Application
- 9. Middle East & Africa Photoelectric Switch Sensor Analysis, Insights and Forecast, 2019-2031
- 9.1. Market Analysis, Insights and Forecast - by Application
- 9.1.1. Industrial Automation
- 9.1.2. Automotive Manufacturing
- 9.1.3. Logistics
- 9.1.4. Medical Equipments
- 9.1.5. Others
- 9.2. Market Analysis, Insights and Forecast - by Type
- 9.2.1. Transmitter Type
- 9.2.2. Regression Reflection Type
- 9.2.3. Diffuse Reflection Type
- 9.1. Market Analysis, Insights and Forecast - by Application
- 10. Asia Pacific Photoelectric Switch Sensor Analysis, Insights and Forecast, 2019-2031
- 10.1. Market Analysis, Insights and Forecast - by Application
- 10.1.1. Industrial Automation
- 10.1.2. Automotive Manufacturing
- 10.1.3. Logistics
- 10.1.4. Medical Equipments
- 10.1.5. Others
- 10.2. Market Analysis, Insights and Forecast - by Type
- 10.2.1. Transmitter Type
- 10.2.2. Regression Reflection Type
- 10.2.3. Diffuse Reflection Type
- 10.1. Market Analysis, Insights and Forecast - by Application
- 11. Competitive Analysis
- 11.1. Global Market Share Analysis 2024
- 11.2. Company Profiles
- 11.2.1 Omron
- 11.2.1.1. Overview
- 11.2.1.2. Products
- 11.2.1.3. SWOT Analysis
- 11.2.1.4. Recent Developments
- 11.2.1.5. Financials (Based on Availability)
- 11.2.2 Azbil Corporation
- 11.2.2.1. Overview
- 11.2.2.2. Products
- 11.2.2.3. SWOT Analysis
- 11.2.2.4. Recent Developments
- 11.2.2.5. Financials (Based on Availability)
- 11.2.3 Hamamatsu Photonics
- 11.2.3.1. Overview
- 11.2.3.2. Products
- 11.2.3.3. SWOT Analysis
- 11.2.3.4. Recent Developments
- 11.2.3.5. Financials (Based on Availability)
- 11.2.4 Pepperl+Fuchs
- 11.2.4.1. Overview
- 11.2.4.2. Products
- 11.2.4.3. SWOT Analysis
- 11.2.4.4. Recent Developments
- 11.2.4.5. Financials (Based on Availability)
- 11.2.5 Panasonic
- 11.2.5.1. Overview
- 11.2.5.2. Products
- 11.2.5.3. SWOT Analysis
- 11.2.5.4. Recent Developments
- 11.2.5.5. Financials (Based on Availability)
- 11.2.6 di-soric
- 11.2.6.1. Overview
- 11.2.6.2. Products
- 11.2.6.3. SWOT Analysis
- 11.2.6.4. Recent Developments
- 11.2.6.5. Financials (Based on Availability)
- 11.2.7 Eaton
- 11.2.7.1. Overview
- 11.2.7.2. Products
- 11.2.7.3. SWOT Analysis
- 11.2.7.4. Recent Developments
- 11.2.7.5. Financials (Based on Availability)
- 11.2.8 Banner
- 11.2.8.1. Overview
- 11.2.8.2. Products
- 11.2.8.3. SWOT Analysis
- 11.2.8.4. Recent Developments
- 11.2.8.5. Financials (Based on Availability)
- 11.2.9 Telemecanique Sensors
- 11.2.9.1. Overview
- 11.2.9.2. Products
- 11.2.9.3. SWOT Analysis
- 11.2.9.4. Recent Developments
- 11.2.9.5. Financials (Based on Availability)
- 11.2.10 Carlo Gavazzi
- 11.2.10.1. Overview
- 11.2.10.2. Products
- 11.2.10.3. SWOT Analysis
- 11.2.10.4. Recent Developments
- 11.2.10.5. Financials (Based on Availability)
- 11.2.11 KEYENCE Singapore
- 11.2.11.1. Overview
- 11.2.11.2. Products
- 11.2.11.3. SWOT Analysis
- 11.2.11.4. Recent Developments
- 11.2.11.5. Financials (Based on Availability)
- 11.2.12 IBEST ELECTRICAL
- 11.2.12.1. Overview
- 11.2.12.2. Products
- 11.2.12.3. SWOT Analysis
- 11.2.12.4. Recent Developments
- 11.2.12.5. Financials (Based on Availability)
- 11.2.13 Shenzhen Shenwu Sensor
- 11.2.13.1. Overview
- 11.2.13.2. Products
- 11.2.13.3. SWOT Analysis
- 11.2.13.4. Recent Developments
- 11.2.13.5. Financials (Based on Availability)
- 11.2.14 Intellisense (XIAMEN) MICROELECTRONICS Ltd.
- 11.2.14.1. Overview
- 11.2.14.2. Products
- 11.2.14.3. SWOT Analysis
- 11.2.14.4. Recent Developments
- 11.2.14.5. Financials (Based on Availability)
- 11.2.1 Omron
List of Figures
- Figure 1: Global Photoelectric Switch Sensor Revenue Breakdown (million, %) by Region 2024 & 2032
- Figure 2: North America Photoelectric Switch Sensor Revenue (million), by Application 2024 & 2032
- Figure 3: North America Photoelectric Switch Sensor Revenue Share (%), by Application 2024 & 2032
- Figure 4: North America Photoelectric Switch Sensor Revenue (million), by Type 2024 & 2032
- Figure 5: North America Photoelectric Switch Sensor Revenue Share (%), by Type 2024 & 2032
- Figure 6: North America Photoelectric Switch Sensor Revenue (million), by Country 2024 & 2032
- Figure 7: North America Photoelectric Switch Sensor Revenue Share (%), by Country 2024 & 2032
- Figure 8: South America Photoelectric Switch Sensor Revenue (million), by Application 2024 & 2032
- Figure 9: South America Photoelectric Switch Sensor Revenue Share (%), by Application 2024 & 2032
- Figure 10: South America Photoelectric Switch Sensor Revenue (million), by Type 2024 & 2032
- Figure 11: South America Photoelectric Switch Sensor Revenue Share (%), by Type 2024 & 2032
- Figure 12: South America Photoelectric Switch Sensor Revenue (million), by Country 2024 & 2032
- Figure 13: South America Photoelectric Switch Sensor Revenue Share (%), by Country 2024 & 2032
- Figure 14: Europe Photoelectric Switch Sensor Revenue (million), by Application 2024 & 2032
- Figure 15: Europe Photoelectric Switch Sensor Revenue Share (%), by Application 2024 & 2032
- Figure 16: Europe Photoelectric Switch Sensor Revenue (million), by Type 2024 & 2032
- Figure 17: Europe Photoelectric Switch Sensor Revenue Share (%), by Type 2024 & 2032
- Figure 18: Europe Photoelectric Switch Sensor Revenue (million), by Country 2024 & 2032
- Figure 19: Europe Photoelectric Switch Sensor Revenue Share (%), by Country 2024 & 2032
- Figure 20: Middle East & Africa Photoelectric Switch Sensor Revenue (million), by Application 2024 & 2032
- Figure 21: Middle East & Africa Photoelectric Switch Sensor Revenue Share (%), by Application 2024 & 2032
- Figure 22: Middle East & Africa Photoelectric Switch Sensor Revenue (million), by Type 2024 & 2032
- Figure 23: Middle East & Africa Photoelectric Switch Sensor Revenue Share (%), by Type 2024 & 2032
- Figure 24: Middle East & Africa Photoelectric Switch Sensor Revenue (million), by Country 2024 & 2032
- Figure 25: Middle East & Africa Photoelectric Switch Sensor Revenue Share (%), by Country 2024 & 2032
- Figure 26: Asia Pacific Photoelectric Switch Sensor Revenue (million), by Application 2024 & 2032
- Figure 27: Asia Pacific Photoelectric Switch Sensor Revenue Share (%), by Application 2024 & 2032
- Figure 28: Asia Pacific Photoelectric Switch Sensor Revenue (million), by Type 2024 & 2032
- Figure 29: Asia Pacific Photoelectric Switch Sensor Revenue Share (%), by Type 2024 & 2032
- Figure 30: Asia Pacific Photoelectric Switch Sensor Revenue (million), by Country 2024 & 2032
- Figure 31: Asia Pacific Photoelectric Switch Sensor Revenue Share (%), by Country 2024 & 2032
List of Tables
- Table 1: Global Photoelectric Switch Sensor Revenue million Forecast, by Region 2019 & 2032
- Table 2: Global Photoelectric Switch Sensor Revenue million Forecast, by Application 2019 & 2032
- Table 3: Global Photoelectric Switch Sensor Revenue million Forecast, by Type 2019 & 2032
- Table 4: Global Photoelectric Switch Sensor Revenue million Forecast, by Region 2019 & 2032
- Table 5: Global Photoelectric Switch Sensor Revenue million Forecast, by Application 2019 & 2032
- Table 6: Global Photoelectric Switch Sensor Revenue million Forecast, by Type 2019 & 2032
- Table 7: Global Photoelectric Switch Sensor Revenue million Forecast, by Country 2019 & 2032
- Table 8: United States Photoelectric Switch Sensor Revenue (million) Forecast, by Application 2019 & 2032
- Table 9: Canada Photoelectric Switch Sensor Revenue (million) Forecast, by Application 2019 & 2032
- Table 10: Mexico Photoelectric Switch Sensor Revenue (million) Forecast, by Application 2019 & 2032
- Table 11: Global Photoelectric Switch Sensor Revenue million Forecast, by Application 2019 & 2032
- Table 12: Global Photoelectric Switch Sensor Revenue million Forecast, by Type 2019 & 2032
- Table 13: Global Photoelectric Switch Sensor Revenue million Forecast, by Country 2019 & 2032
- Table 14: Brazil Photoelectric Switch Sensor Revenue (million) Forecast, by Application 2019 & 2032
- Table 15: Argentina Photoelectric Switch Sensor Revenue (million) Forecast, by Application 2019 & 2032
- Table 16: Rest of South America Photoelectric Switch Sensor Revenue (million) Forecast, by Application 2019 & 2032
- Table 17: Global Photoelectric Switch Sensor Revenue million Forecast, by Application 2019 & 2032
- Table 18: Global Photoelectric Switch Sensor Revenue million Forecast, by Type 2019 & 2032
- Table 19: Global Photoelectric Switch Sensor Revenue million Forecast, by Country 2019 & 2032
- Table 20: United Kingdom Photoelectric Switch Sensor Revenue (million) Forecast, by Application 2019 & 2032
- Table 21: Germany Photoelectric Switch Sensor Revenue (million) Forecast, by Application 2019 & 2032
- Table 22: France Photoelectric Switch Sensor Revenue (million) Forecast, by Application 2019 & 2032
- Table 23: Italy Photoelectric Switch Sensor Revenue (million) Forecast, by Application 2019 & 2032
- Table 24: Spain Photoelectric Switch Sensor Revenue (million) Forecast, by Application 2019 & 2032
- Table 25: Russia Photoelectric Switch Sensor Revenue (million) Forecast, by Application 2019 & 2032
- Table 26: Benelux Photoelectric Switch Sensor Revenue (million) Forecast, by Application 2019 & 2032
- Table 27: Nordics Photoelectric Switch Sensor Revenue (million) Forecast, by Application 2019 & 2032
- Table 28: Rest of Europe Photoelectric Switch Sensor Revenue (million) Forecast, by Application 2019 & 2032
- Table 29: Global Photoelectric Switch Sensor Revenue million Forecast, by Application 2019 & 2032
- Table 30: Global Photoelectric Switch Sensor Revenue million Forecast, by Type 2019 & 2032
- Table 31: Global Photoelectric Switch Sensor Revenue million Forecast, by Country 2019 & 2032
- Table 32: Turkey Photoelectric Switch Sensor Revenue (million) Forecast, by Application 2019 & 2032
- Table 33: Israel Photoelectric Switch Sensor Revenue (million) Forecast, by Application 2019 & 2032
- Table 34: GCC Photoelectric Switch Sensor Revenue (million) Forecast, by Application 2019 & 2032
- Table 35: North Africa Photoelectric Switch Sensor Revenue (million) Forecast, by Application 2019 & 2032
- Table 36: South Africa Photoelectric Switch Sensor Revenue (million) Forecast, by Application 2019 & 2032
- Table 37: Rest of Middle East & Africa Photoelectric Switch Sensor Revenue (million) Forecast, by Application 2019 & 2032
- Table 38: Global Photoelectric Switch Sensor Revenue million Forecast, by Application 2019 & 2032
- Table 39: Global Photoelectric Switch Sensor Revenue million Forecast, by Type 2019 & 2032
- Table 40: Global Photoelectric Switch Sensor Revenue million Forecast, by Country 2019 & 2032
- Table 41: China Photoelectric Switch Sensor Revenue (million) Forecast, by Application 2019 & 2032
- Table 42: India Photoelectric Switch Sensor Revenue (million) Forecast, by Application 2019 & 2032
- Table 43: Japan Photoelectric Switch Sensor Revenue (million) Forecast, by Application 2019 & 2032
- Table 44: South Korea Photoelectric Switch Sensor Revenue (million) Forecast, by Application 2019 & 2032
- Table 45: ASEAN Photoelectric Switch Sensor Revenue (million) Forecast, by Application 2019 & 2032
- Table 46: Oceania Photoelectric Switch Sensor Revenue (million) Forecast, by Application 2019 & 2032
- Table 47: Rest of Asia Pacific Photoelectric Switch Sensor Revenue (million) Forecast, by Application 2019 & 2032
Frequently Asked Questions
1. What is the projected Compound Annual Growth Rate (CAGR) of the Photoelectric Switch Sensor?
The projected CAGR is approximately 7.2%.
2. Which companies are prominent players in the Photoelectric Switch Sensor?
Key companies in the market include Omron, Azbil Corporation, Hamamatsu Photonics, Pepperl+Fuchs, Panasonic, di-soric, Eaton, Banner, Telemecanique Sensors, Carlo Gavazzi, KEYENCE Singapore, IBEST ELECTRICAL, Shenzhen Shenwu Sensor, Intellisense (XIAMEN) MICROELECTRONICS Ltd..
3. What are the main segments of the Photoelectric Switch Sensor?
The market segments include Application, Type.
4. Can you provide details about the market size?
The market size is estimated to be USD 1917 million as of 2022.
5. What are some drivers contributing to market growth?
N/A
6. What are the notable trends driving market growth?
N/A
7. Are there any restraints impacting market growth?
N/A
8. Can you provide examples of recent developments in the market?
N/A
9. What pricing options are available for accessing the report?
Pricing options include single-user, multi-user, and enterprise licenses priced at USD 2900.00, USD 4350.00, and USD 5800.00 respectively.
10. Is the market size provided in terms of value or volume?
The market size is provided in terms of value, measured in million.
11. Are there any specific market keywords associated with the report?
Yes, the market keyword associated with the report is "Photoelectric Switch Sensor," which aids in identifying and referencing the specific market segment covered.
12. How do I determine which pricing option suits my needs best?
The pricing options vary based on user requirements and access needs. Individual users may opt for single-user licenses, while businesses requiring broader access may choose multi-user or enterprise licenses for cost-effective access to the report.
13. Are there any additional resources or data provided in the Photoelectric Switch Sensor report?
While the report offers comprehensive insights, it's advisable to review the specific contents or supplementary materials provided to ascertain if additional resources or data are available.
14. How can I stay updated on further developments or reports in the Photoelectric Switch Sensor?
To stay informed about further developments, trends, and reports in the Photoelectric Switch Sensor, consider subscribing to industry newsletters, following relevant companies and organizations, or regularly checking reputable industry news sources and publications.
Methodology
Step 1 - Identification of Relevant Samples Size from Population Database


Step 2 - Approaches for Defining Global Market Size (Value, Volume* & Price*)

Note*: In applicable scenarios
Step 3 - Data Sources
Primary Research
- Web Analytics
- Survey Reports
- Research Institute
- Latest Research Reports
- Opinion Leaders
Secondary Research
- Annual Reports
- White Paper
- Latest Press Release
- Industry Association
- Paid Database
- Investor Presentations

Step 4 - Data Triangulation
Involves using different sources of information in order to increase the validity of a study
These sources are likely to be stakeholders in a program - participants, other researchers, program staff, other community members, and so on.
Then we put all data in single framework & apply various statistical tools to find out the dynamic on the market.
During the analysis stage, feedback from the stakeholder groups would be compared to determine areas of agreement as well as areas of divergence
