

Key Insights
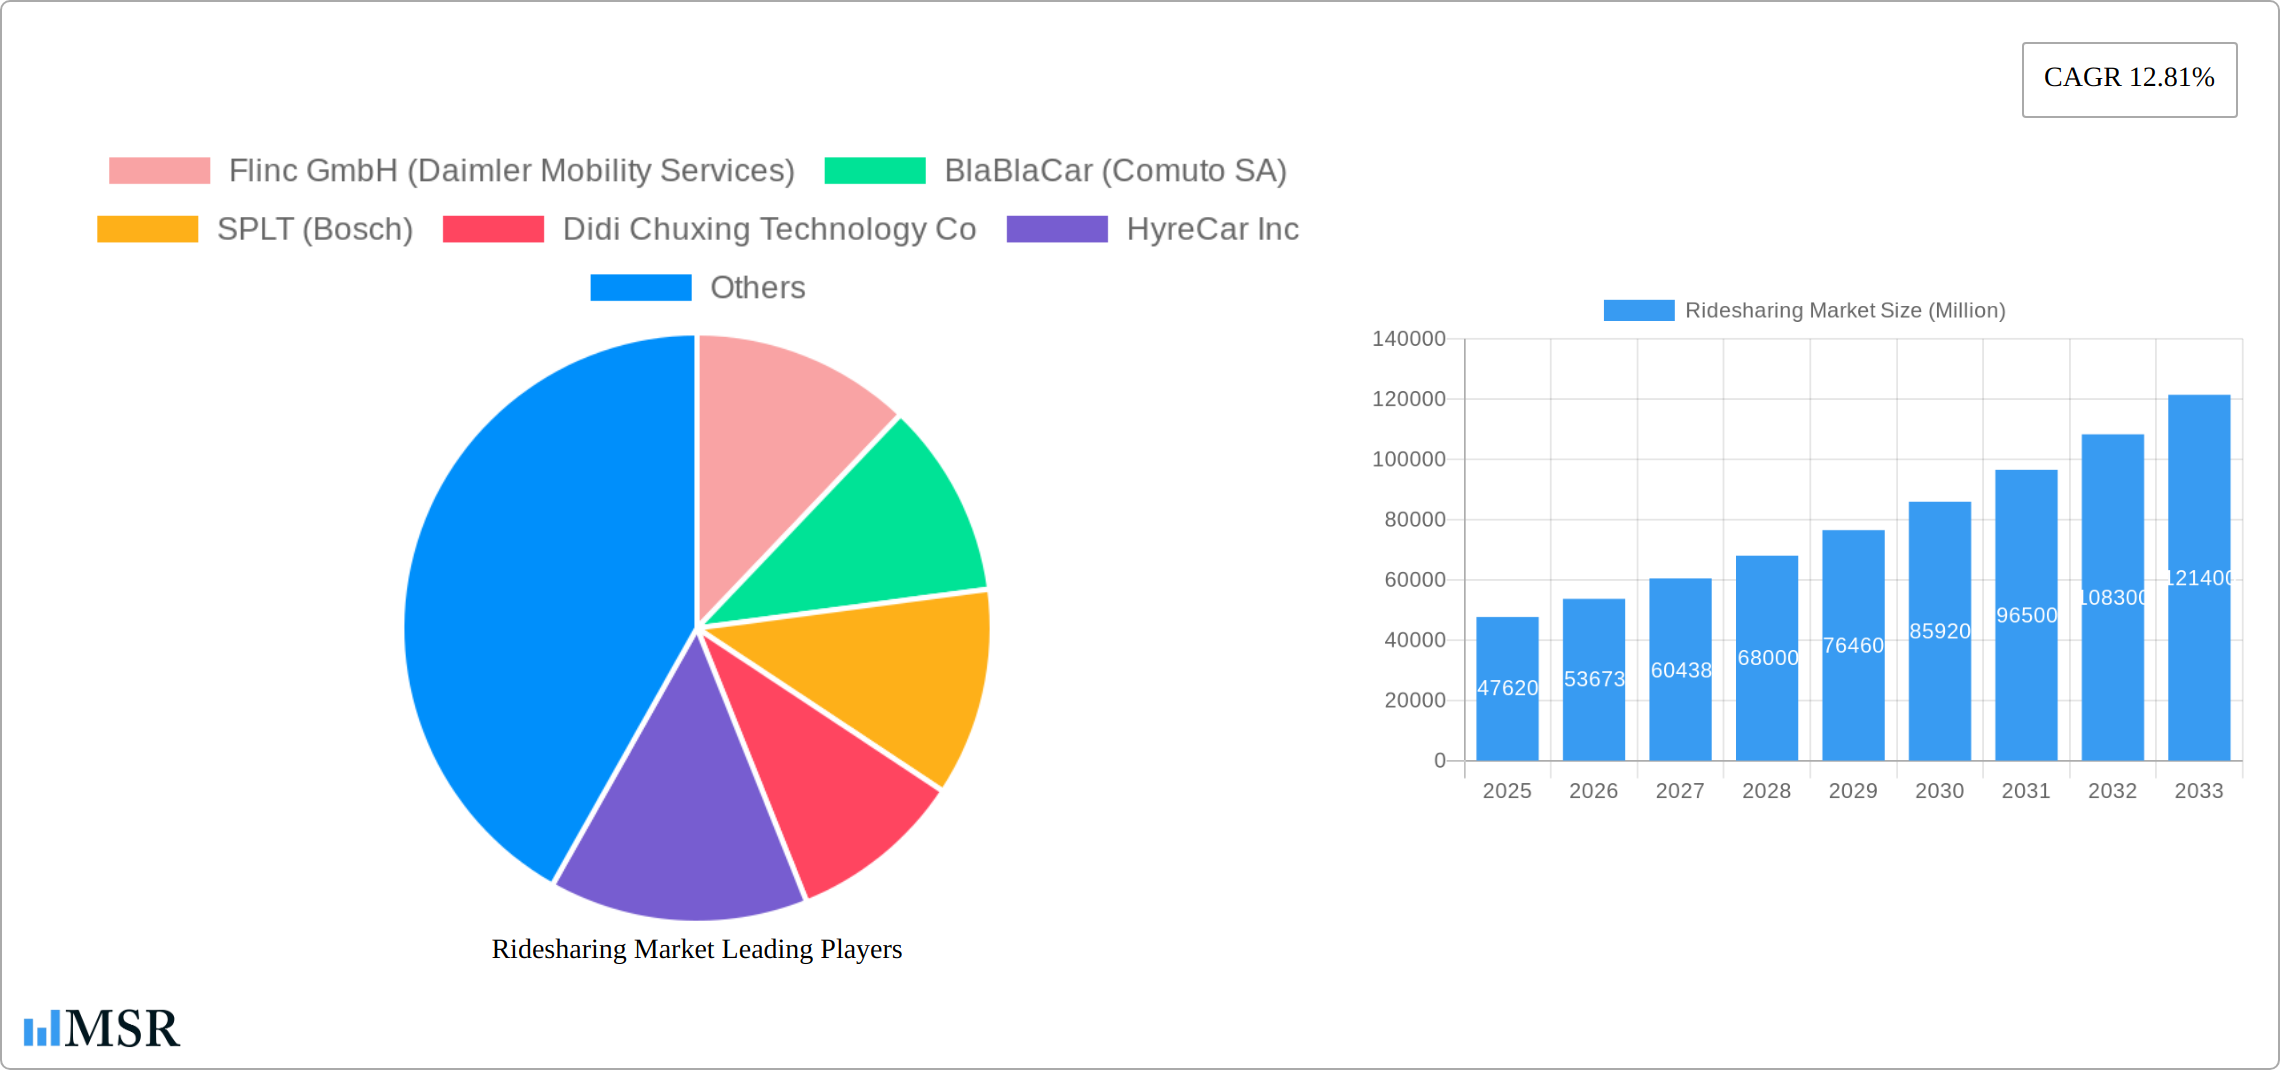
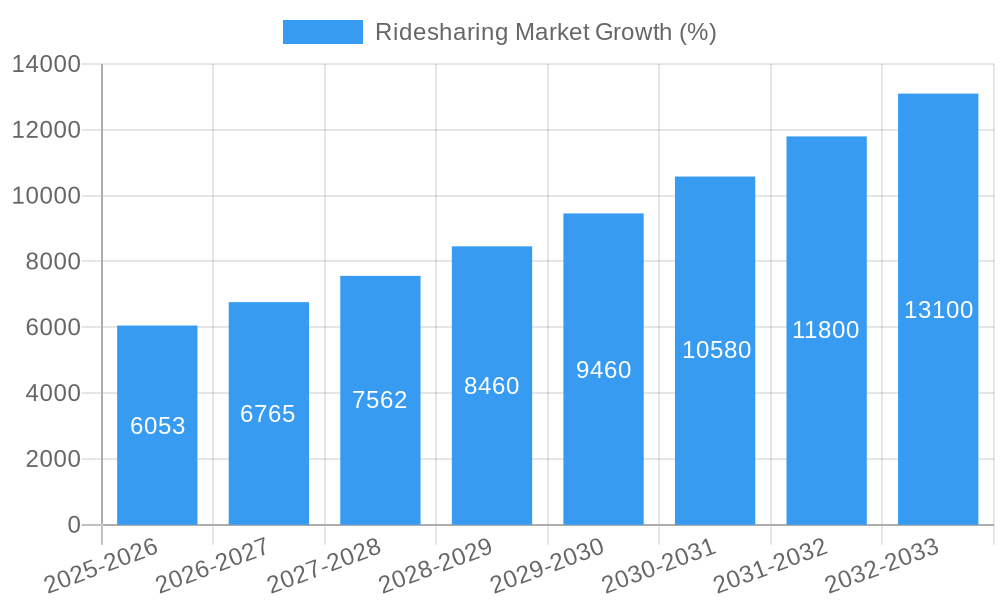
The global ridesharing market, valued at $47.62 billion in 2025, is projected to experience robust growth, driven by increasing urbanization, rising fuel prices, and the growing preference for convenient and cost-effective transportation solutions. The market's Compound Annual Growth Rate (CAGR) of 12.81% from 2025 to 2033 indicates a significant expansion, with the market expected to surpass $150 billion by 2033. This growth is fueled by several key factors including the increasing adoption of smartphone technology and app-based services, the expansion of corporate ridesharing programs for employee commuting, and the development of innovative features like ride-pooling and dynamic pricing. Furthermore, government initiatives promoting sustainable transportation and reducing traffic congestion are contributing to market growth. Competition among established players and emerging startups is driving innovation, resulting in improved services, enhanced user experiences, and expanded geographical reach.
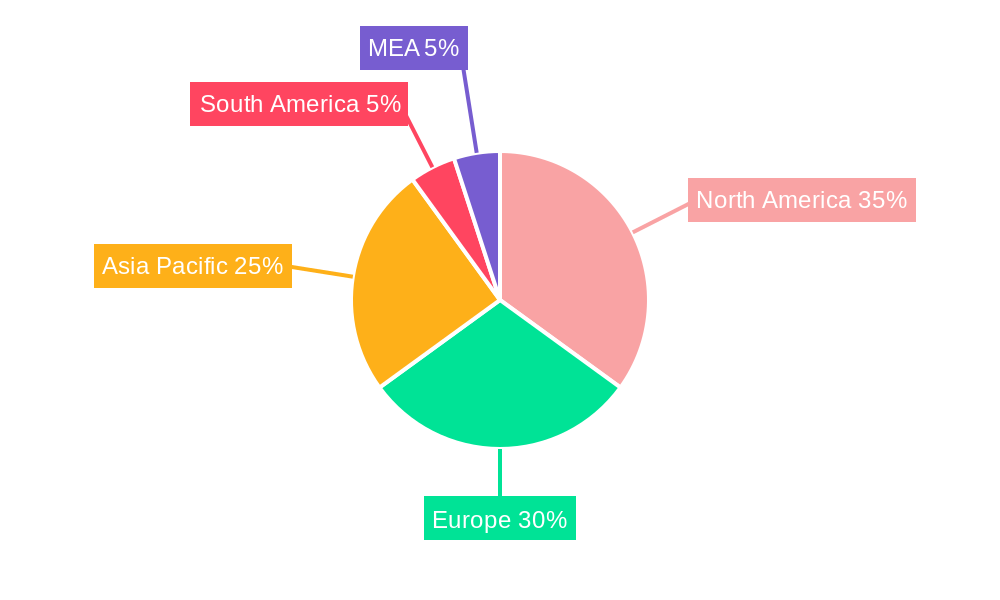
The market segmentation reveals significant opportunities across various membership and service types. App-based ridesharing dominates, reflecting the pervasive use of smartphones, however, the web-based and hybrid (web and app-based) segments are also showing steady growth, catering to diverse user preferences and technological capabilities. Fixed ridesharing offers predictable pricing and scheduling benefits for businesses and commuters, while dynamic ridesharing continues to be popular for its flexibility and on-demand accessibility. Geographically, North America and Europe currently hold a significant market share, but the Asia-Pacific region is expected to witness the fastest growth due to its burgeoning population and increasing disposable incomes. However, regulatory hurdles, concerns regarding driver safety and compensation, and the need for robust cybersecurity measures present ongoing challenges to the market's sustained expansion.
Ridesharing Market: A Comprehensive Report (2019-2033)
This comprehensive report provides an in-depth analysis of the global ridesharing market, covering its historical performance (2019-2024), current status (2025), and future projections (2025-2033). We analyze market dynamics, key players, technological advancements, and emerging trends to offer actionable insights for industry stakeholders. The report encompasses detailed segmentation by membership type (Fixed, Dynamic, Corporate) and service type (Web-Based, App-Based, Web & App-Based), providing a granular understanding of market opportunities. The market size is expected to reach xx Million by 2025 and will continue expanding at a CAGR of xx% during the forecast period.
Ridesharing Market Concentration & Dynamics
The ridesharing market exhibits a dynamic interplay of concentration and fragmentation. While a few dominant players control significant market share, a considerable number of smaller companies and startups actively compete. This report analyzes the market share of key players, including Didi Chuxing, Uber, and BlaBlaCar, and assesses their strategies. Market concentration is influenced by factors such as regulatory frameworks (varying across regions), technological advancements (e.g., autonomous vehicle technology), and mergers & acquisitions (M&A) activity.
- Market Share: Didi Chuxing holds a significant market share in Asia, while Uber dominates in North America and Europe. BlaBlaCar maintains a strong position in the long-distance carpooling segment. Precise market share data for 2025 is currently under evaluation but will be included in the final report.
- M&A Activity: The industry has witnessed significant M&A activity in recent years, with companies consolidating to expand their market reach and enhance their technological capabilities. xx M&A deals were recorded between 2019 and 2024, indicating a trend of industry consolidation.
- Innovation Ecosystems: The ridesharing market is characterized by a vibrant innovation ecosystem, with continuous technological advancements driving growth and efficiency. This includes the integration of AI for optimized route planning, the development of electric and autonomous vehicles, and the emergence of innovative business models.
- Regulatory Frameworks: Varying regulatory environments across different countries significantly impact market dynamics. Regulations concerning driver licensing, background checks, and pricing policies can create barriers to entry or influence the competitive landscape.
- Substitute Products: Public transportation, taxis, and personal vehicle ownership are major substitute products. The relative competitiveness of ridesharing depends on factors such as pricing, convenience, and the availability of alternatives.
- End-User Trends: Shifting consumer preferences toward convenience, affordability, and sustainability are key drivers of market growth. Increased adoption of ride-sharing services by younger demographics and a growing preference for shared mobility options are shaping the market landscape.
Ridesharing Market Industry Insights & Trends
The ridesharing market is experiencing robust growth, driven by several factors. Increasing urbanization, rising disposable incomes, and the growing preference for convenient and cost-effective transportation options fuel market expansion. Technological advancements, particularly in mobile app development and GPS technology, have played a crucial role in facilitating the widespread adoption of ridesharing services. Evolving consumer behaviors, including the growing acceptance of sharing economy models and a preference for on-demand services, further contribute to market growth. The market is predicted to reach xx Million by 2025, indicating a steady expansion.
The global market size reached xx Million in 2024 and is projected to grow at a Compound Annual Growth Rate (CAGR) of xx% from 2025 to 2033. This growth is fueled by several key factors, including increasing urbanization, rising disposable incomes, and growing preference for convenient and affordable transportation solutions. Technological advancements, such as the development of electric and autonomous vehicles, are expected to further drive market expansion. Furthermore, changing consumer behavior, with a greater emphasis on sustainable and shared mobility options, will also influence market trends.
Key Markets & Segments Leading Ridesharing Market
The ridesharing market demonstrates regional variations in adoption and growth rates. North America and Europe currently hold significant market share, driven by high levels of smartphone penetration, well-developed transportation infrastructure, and favorable regulatory environments. However, Asia-Pacific is projected to show significant growth in the coming years. The app-based service type dominates the market due to its ease of use and wide accessibility, while dynamic ridesharing offers flexibility and cost-effectiveness, leading to its high adoption rates.
- Dominant Regions: North America and Europe currently dominate, with Asia-Pacific expected to experience rapid growth.
- Dominant Segments:
- By Membership Type: Dynamic ridesharing is the leading segment due to its flexibility and affordability. Corporate ridesharing is experiencing substantial growth due to its cost-effectiveness for businesses.
- By Service Type: App-based services represent the dominant segment due to ease of access and convenience.
- Growth Drivers:
- Economic Growth: Rising disposable incomes in developing economies fuel the demand for ridesharing services.
- Urbanization: Increasing population concentration in urban areas boosts the need for efficient transportation options.
- Technological Advancements: Smartphone penetration and improved GPS technology are key drivers.
- Infrastructure Development: Investments in transportation infrastructure support ridesharing expansion.
Ridesharing Market Product Developments
The ridesharing market is witnessing continuous product innovation, primarily driven by technological advancements. Companies are integrating artificial intelligence for route optimization, incorporating electric vehicles to enhance sustainability, and exploring the potential of autonomous driving technology to improve efficiency and reduce costs. These developments offer significant competitive advantages, enhancing user experience, operational efficiency, and cost-effectiveness.
Challenges in the Ridesharing Market Market
The ridesharing market faces several challenges, including stringent regulatory requirements, particularly concerning driver licensing, insurance, and data privacy. Supply chain issues, such as the availability of vehicles and qualified drivers, can impact operational efficiency. Intense competition among established players and the emergence of new entrants create competitive pressures, affecting pricing and profitability. These factors can negatively impact market expansion, with potential losses estimated at xx Million annually due to regulatory hurdles alone.
Forces Driving Ridesharing Market Growth
Several factors are driving the growth of the ridesharing market. Technological advancements, including improvements in mobile app technology, GPS systems, and the development of electric and autonomous vehicles, significantly enhance service efficiency and user experience. Economic factors, such as rising disposable incomes and increased urbanization, fuel demand for convenient and cost-effective transportation. Supportive government policies and regulations fostering innovation and competition further contribute to market expansion.
Long-Term Growth Catalysts in Ridesharing Market
Long-term growth in the ridesharing market will be fueled by strategic partnerships and collaborations, particularly between ridesharing companies and auto manufacturers developing autonomous vehicles. Expansion into new markets with growing populations and improving infrastructure will provide significant opportunities for growth. Continuous innovation in service offerings, such as integrating personalized features and expanding into new service segments (e.g., delivery services), will further drive market expansion.
Emerging Opportunities in Ridesharing Market
Emerging opportunities lie in the integration of ridesharing services with other mobility solutions, creating integrated multi-modal transportation platforms. The potential of autonomous vehicles offers significant efficiency gains and cost reductions, providing future growth opportunities. Expansion into underserved markets and the development of sustainable and environmentally friendly transportation options, such as electric vehicle fleets, will attract environmentally conscious consumers.
Leading Players in the Ridesharing Market Sector
- Flinc GmbH (Daimler Mobility Services)
- BlaBlaCar (Comuto SA)
- SPLT (Bosch)
- Didi Chuxing Technology Co
- HyreCar Inc
- KINTO Join Limited
- Wunder Mobility Solutions GmbH
- Kangaride Canada Co
- GoMore
- Klaxit SAS (formerly Wayzup)
- Scoop Technologies Inc
- Vride Inc (Acquired by Enterprise Holdings Inc)
- CarpoolWorld (Datasphere Corporation)
- Via Transportation Inc
- Zimride Inc
Key Milestones in Ridesharing Market Industry
- June 2022: Uber launches UberX Share, offering a 20% discount for shared rides. This demonstrates a renewed focus on carpooling and cost-effective options, potentially increasing market share.
- February 2022: Avolon and AirAsia partner to create a ridesharing platform in Southeast Asia using eVTOL aircraft. This signifies the expansion of ridesharing into air travel, potentially disrupting traditional air travel models and opening new markets.
Strategic Outlook for Ridesharing Market Market
The future of the ridesharing market is bright, with significant growth potential driven by technological advancements, particularly in autonomous vehicles and electric mobility. Strategic partnerships and expansion into new geographic markets will be crucial for long-term success. Companies focusing on innovation, sustainability, and enhanced user experience will be best positioned to capitalize on the market's future opportunities.
Ridesharing Market Segmentation
-
1. Membership Type
- 1.1. Fixed Ridesharing
- 1.2. Dynamic Ridesharing
- 1.3. Corporate Ridesharing
-
2. Service Type
- 2.1. Web-Based
- 2.2. App-Based
- 2.3. Web and App Based
Ridesharing Market Segmentation By Geography
- 1. North America
- 2. Europe
- 3. Asia
- 4. Australia and New Zealand
- 5. Latin America
- 6. Middle East and Africa
Ridesharing Market REPORT HIGHLIGHTS
| Aspects | Details |
|---|---|
| Study Period | 2019-2033 |
| Base Year | 2024 |
| Estimated Year | 2025 |
| Forecast Period | 2025-2033 |
| Historical Period | 2019-2024 |
| Growth Rate | CAGR of 12.81% from 2019-2033 |
| Segmentation |
|
Table of Contents
- 1. Introduction
- 1.1. Research Scope
- 1.2. Market Segmentation
- 1.3. Research Methodology
- 1.4. Definitions and Assumptions
- 2. Executive Summary
- 2.1. Introduction
- 3. Market Dynamics
- 3.1. Introduction
- 3.2. Market Drivers
- 3.2.1 Cost Advantage and Increasing Availability of Carpooling/Corporate Pooling Services; Incentives and Rebates Provided by Governments in Major Markets
- 3.2.2 such as France; Increasing Cost of Vehicle Ownership and Environmental Benefits
- 3.3. Market Restrains
- 3.3.1. Technical Challenges Pertaining to CMP Technique
- 3.4. Market Trends
- 3.4.1. COVID-19 Has Posed Significant Threat to the Market
- 4. Market Factor Analysis
- 4.1. Porters Five Forces
- 4.2. Supply/Value Chain
- 4.3. PESTEL analysis
- 4.4. Market Entropy
- 4.5. Patent/Trademark Analysis
- 5. Global Ridesharing Market Analysis, Insights and Forecast, 2019-2031
- 5.1. Market Analysis, Insights and Forecast - by Membership Type
- 5.1.1. Fixed Ridesharing
- 5.1.2. Dynamic Ridesharing
- 5.1.3. Corporate Ridesharing
- 5.2. Market Analysis, Insights and Forecast - by Service Type
- 5.2.1. Web-Based
- 5.2.2. App-Based
- 5.2.3. Web and App Based
- 5.3. Market Analysis, Insights and Forecast - by Region
- 5.3.1. North America
- 5.3.2. Europe
- 5.3.3. Asia
- 5.3.4. Australia and New Zealand
- 5.3.5. Latin America
- 5.3.6. Middle East and Africa
- 5.1. Market Analysis, Insights and Forecast - by Membership Type
- 6. North America Ridesharing Market Analysis, Insights and Forecast, 2019-2031
- 6.1. Market Analysis, Insights and Forecast - by Membership Type
- 6.1.1. Fixed Ridesharing
- 6.1.2. Dynamic Ridesharing
- 6.1.3. Corporate Ridesharing
- 6.2. Market Analysis, Insights and Forecast - by Service Type
- 6.2.1. Web-Based
- 6.2.2. App-Based
- 6.2.3. Web and App Based
- 6.1. Market Analysis, Insights and Forecast - by Membership Type
- 7. Europe Ridesharing Market Analysis, Insights and Forecast, 2019-2031
- 7.1. Market Analysis, Insights and Forecast - by Membership Type
- 7.1.1. Fixed Ridesharing
- 7.1.2. Dynamic Ridesharing
- 7.1.3. Corporate Ridesharing
- 7.2. Market Analysis, Insights and Forecast - by Service Type
- 7.2.1. Web-Based
- 7.2.2. App-Based
- 7.2.3. Web and App Based
- 7.1. Market Analysis, Insights and Forecast - by Membership Type
- 8. Asia Ridesharing Market Analysis, Insights and Forecast, 2019-2031
- 8.1. Market Analysis, Insights and Forecast - by Membership Type
- 8.1.1. Fixed Ridesharing
- 8.1.2. Dynamic Ridesharing
- 8.1.3. Corporate Ridesharing
- 8.2. Market Analysis, Insights and Forecast - by Service Type
- 8.2.1. Web-Based
- 8.2.2. App-Based
- 8.2.3. Web and App Based
- 8.1. Market Analysis, Insights and Forecast - by Membership Type
- 9. Australia and New Zealand Ridesharing Market Analysis, Insights and Forecast, 2019-2031
- 9.1. Market Analysis, Insights and Forecast - by Membership Type
- 9.1.1. Fixed Ridesharing
- 9.1.2. Dynamic Ridesharing
- 9.1.3. Corporate Ridesharing
- 9.2. Market Analysis, Insights and Forecast - by Service Type
- 9.2.1. Web-Based
- 9.2.2. App-Based
- 9.2.3. Web and App Based
- 9.1. Market Analysis, Insights and Forecast - by Membership Type
- 10. Latin America Ridesharing Market Analysis, Insights and Forecast, 2019-2031
- 10.1. Market Analysis, Insights and Forecast - by Membership Type
- 10.1.1. Fixed Ridesharing
- 10.1.2. Dynamic Ridesharing
- 10.1.3. Corporate Ridesharing
- 10.2. Market Analysis, Insights and Forecast - by Service Type
- 10.2.1. Web-Based
- 10.2.2. App-Based
- 10.2.3. Web and App Based
- 10.1. Market Analysis, Insights and Forecast - by Membership Type
- 11. Middle East and Africa Ridesharing Market Analysis, Insights and Forecast, 2019-2031
- 11.1. Market Analysis, Insights and Forecast - by Membership Type
- 11.1.1. Fixed Ridesharing
- 11.1.2. Dynamic Ridesharing
- 11.1.3. Corporate Ridesharing
- 11.2. Market Analysis, Insights and Forecast - by Service Type
- 11.2.1. Web-Based
- 11.2.2. App-Based
- 11.2.3. Web and App Based
- 11.1. Market Analysis, Insights and Forecast - by Membership Type
- 12. North America Ridesharing Market Analysis, Insights and Forecast, 2019-2031
- 12.1. Market Analysis, Insights and Forecast - By Country/Sub-region
- 12.1.1 United States
- 12.1.2 Canada
- 12.1.3 Mexico
- 13. Europe Ridesharing Market Analysis, Insights and Forecast, 2019-2031
- 13.1. Market Analysis, Insights and Forecast - By Country/Sub-region
- 13.1.1 Germany
- 13.1.2 United Kingdom
- 13.1.3 France
- 13.1.4 Spain
- 13.1.5 Italy
- 13.1.6 Spain
- 13.1.7 Belgium
- 13.1.8 Netherland
- 13.1.9 Nordics
- 13.1.10 Rest of Europe
- 14. Asia Pacific Ridesharing Market Analysis, Insights and Forecast, 2019-2031
- 14.1. Market Analysis, Insights and Forecast - By Country/Sub-region
- 14.1.1 China
- 14.1.2 Japan
- 14.1.3 India
- 14.1.4 South Korea
- 14.1.5 Southeast Asia
- 14.1.6 Australia
- 14.1.7 Indonesia
- 14.1.8 Phillipes
- 14.1.9 Singapore
- 14.1.10 Thailandc
- 14.1.11 Rest of Asia Pacific
- 15. South America Ridesharing Market Analysis, Insights and Forecast, 2019-2031
- 15.1. Market Analysis, Insights and Forecast - By Country/Sub-region
- 15.1.1 Brazil
- 15.1.2 Argentina
- 15.1.3 Peru
- 15.1.4 Chile
- 15.1.5 Colombia
- 15.1.6 Ecuador
- 15.1.7 Venezuela
- 15.1.8 Rest of South America
- 16. North America Ridesharing Market Analysis, Insights and Forecast, 2019-2031
- 16.1. Market Analysis, Insights and Forecast - By Country/Sub-region
- 16.1.1 United States
- 16.1.2 Canada
- 16.1.3 Mexico
- 17. MEA Ridesharing Market Analysis, Insights and Forecast, 2019-2031
- 17.1. Market Analysis, Insights and Forecast - By Country/Sub-region
- 17.1.1 United Arab Emirates
- 17.1.2 Saudi Arabia
- 17.1.3 South Africa
- 17.1.4 Rest of Middle East and Africa
- 18. Competitive Analysis
- 18.1. Global Market Share Analysis 2024
- 18.2. Company Profiles
- 18.2.1 Flinc GmbH (Daimler Mobility Services)
- 18.2.1.1. Overview
- 18.2.1.2. Products
- 18.2.1.3. SWOT Analysis
- 18.2.1.4. Recent Developments
- 18.2.1.5. Financials (Based on Availability)
- 18.2.2 BlaBlaCar (Comuto SA)
- 18.2.2.1. Overview
- 18.2.2.2. Products
- 18.2.2.3. SWOT Analysis
- 18.2.2.4. Recent Developments
- 18.2.2.5. Financials (Based on Availability)
- 18.2.3 SPLT (Bosch)
- 18.2.3.1. Overview
- 18.2.3.2. Products
- 18.2.3.3. SWOT Analysis
- 18.2.3.4. Recent Developments
- 18.2.3.5. Financials (Based on Availability)
- 18.2.4 Didi Chuxing Technology Co
- 18.2.4.1. Overview
- 18.2.4.2. Products
- 18.2.4.3. SWOT Analysis
- 18.2.4.4. Recent Developments
- 18.2.4.5. Financials (Based on Availability)
- 18.2.5 HyreCar Inc
- 18.2.5.1. Overview
- 18.2.5.2. Products
- 18.2.5.3. SWOT Analysis
- 18.2.5.4. Recent Developments
- 18.2.5.5. Financials (Based on Availability)
- 18.2.6 KINTO Join Limited
- 18.2.6.1. Overview
- 18.2.6.2. Products
- 18.2.6.3. SWOT Analysis
- 18.2.6.4. Recent Developments
- 18.2.6.5. Financials (Based on Availability)
- 18.2.7 Wunder Mobility Solutions GmbH
- 18.2.7.1. Overview
- 18.2.7.2. Products
- 18.2.7.3. SWOT Analysis
- 18.2.7.4. Recent Developments
- 18.2.7.5. Financials (Based on Availability)
- 18.2.8 Kangaride Canada Co
- 18.2.8.1. Overview
- 18.2.8.2. Products
- 18.2.8.3. SWOT Analysis
- 18.2.8.4. Recent Developments
- 18.2.8.5. Financials (Based on Availability)
- 18.2.9 GoMore
- 18.2.9.1. Overview
- 18.2.9.2. Products
- 18.2.9.3. SWOT Analysis
- 18.2.9.4. Recent Developments
- 18.2.9.5. Financials (Based on Availability)
- 18.2.10 Klaxit SAS (formerly Wayzup)
- 18.2.10.1. Overview
- 18.2.10.2. Products
- 18.2.10.3. SWOT Analysis
- 18.2.10.4. Recent Developments
- 18.2.10.5. Financials (Based on Availability)
- 18.2.11 Scoop Technologies Inc
- 18.2.11.1. Overview
- 18.2.11.2. Products
- 18.2.11.3. SWOT Analysis
- 18.2.11.4. Recent Developments
- 18.2.11.5. Financials (Based on Availability)
- 18.2.12 Vride Inc (Acquired by Enterprise Holdings Inc
- 18.2.12.1. Overview
- 18.2.12.2. Products
- 18.2.12.3. SWOT Analysis
- 18.2.12.4. Recent Developments
- 18.2.12.5. Financials (Based on Availability)
- 18.2.13 CarpoolWorld (Datasphere Corporation)
- 18.2.13.1. Overview
- 18.2.13.2. Products
- 18.2.13.3. SWOT Analysis
- 18.2.13.4. Recent Developments
- 18.2.13.5. Financials (Based on Availability)
- 18.2.14 Via Transportation Inc
- 18.2.14.1. Overview
- 18.2.14.2. Products
- 18.2.14.3. SWOT Analysis
- 18.2.14.4. Recent Developments
- 18.2.14.5. Financials (Based on Availability)
- 18.2.15 Zimride Inc
- 18.2.15.1. Overview
- 18.2.15.2. Products
- 18.2.15.3. SWOT Analysis
- 18.2.15.4. Recent Developments
- 18.2.15.5. Financials (Based on Availability)
- 18.2.1 Flinc GmbH (Daimler Mobility Services)
List of Figures
- Figure 1: Global Ridesharing Market Revenue Breakdown (Million, %) by Region 2024 & 2032
- Figure 2: North America Ridesharing Market Revenue (Million), by Country 2024 & 2032
- Figure 3: North America Ridesharing Market Revenue Share (%), by Country 2024 & 2032
- Figure 4: Europe Ridesharing Market Revenue (Million), by Country 2024 & 2032
- Figure 5: Europe Ridesharing Market Revenue Share (%), by Country 2024 & 2032
- Figure 6: Asia Pacific Ridesharing Market Revenue (Million), by Country 2024 & 2032
- Figure 7: Asia Pacific Ridesharing Market Revenue Share (%), by Country 2024 & 2032
- Figure 8: South America Ridesharing Market Revenue (Million), by Country 2024 & 2032
- Figure 9: South America Ridesharing Market Revenue Share (%), by Country 2024 & 2032
- Figure 10: North America Ridesharing Market Revenue (Million), by Country 2024 & 2032
- Figure 11: North America Ridesharing Market Revenue Share (%), by Country 2024 & 2032
- Figure 12: MEA Ridesharing Market Revenue (Million), by Country 2024 & 2032
- Figure 13: MEA Ridesharing Market Revenue Share (%), by Country 2024 & 2032
- Figure 14: North America Ridesharing Market Revenue (Million), by Membership Type 2024 & 2032
- Figure 15: North America Ridesharing Market Revenue Share (%), by Membership Type 2024 & 2032
- Figure 16: North America Ridesharing Market Revenue (Million), by Service Type 2024 & 2032
- Figure 17: North America Ridesharing Market Revenue Share (%), by Service Type 2024 & 2032
- Figure 18: North America Ridesharing Market Revenue (Million), by Country 2024 & 2032
- Figure 19: North America Ridesharing Market Revenue Share (%), by Country 2024 & 2032
- Figure 20: Europe Ridesharing Market Revenue (Million), by Membership Type 2024 & 2032
- Figure 21: Europe Ridesharing Market Revenue Share (%), by Membership Type 2024 & 2032
- Figure 22: Europe Ridesharing Market Revenue (Million), by Service Type 2024 & 2032
- Figure 23: Europe Ridesharing Market Revenue Share (%), by Service Type 2024 & 2032
- Figure 24: Europe Ridesharing Market Revenue (Million), by Country 2024 & 2032
- Figure 25: Europe Ridesharing Market Revenue Share (%), by Country 2024 & 2032
- Figure 26: Asia Ridesharing Market Revenue (Million), by Membership Type 2024 & 2032
- Figure 27: Asia Ridesharing Market Revenue Share (%), by Membership Type 2024 & 2032
- Figure 28: Asia Ridesharing Market Revenue (Million), by Service Type 2024 & 2032
- Figure 29: Asia Ridesharing Market Revenue Share (%), by Service Type 2024 & 2032
- Figure 30: Asia Ridesharing Market Revenue (Million), by Country 2024 & 2032
- Figure 31: Asia Ridesharing Market Revenue Share (%), by Country 2024 & 2032
- Figure 32: Australia and New Zealand Ridesharing Market Revenue (Million), by Membership Type 2024 & 2032
- Figure 33: Australia and New Zealand Ridesharing Market Revenue Share (%), by Membership Type 2024 & 2032
- Figure 34: Australia and New Zealand Ridesharing Market Revenue (Million), by Service Type 2024 & 2032
- Figure 35: Australia and New Zealand Ridesharing Market Revenue Share (%), by Service Type 2024 & 2032
- Figure 36: Australia and New Zealand Ridesharing Market Revenue (Million), by Country 2024 & 2032
- Figure 37: Australia and New Zealand Ridesharing Market Revenue Share (%), by Country 2024 & 2032
- Figure 38: Latin America Ridesharing Market Revenue (Million), by Membership Type 2024 & 2032
- Figure 39: Latin America Ridesharing Market Revenue Share (%), by Membership Type 2024 & 2032
- Figure 40: Latin America Ridesharing Market Revenue (Million), by Service Type 2024 & 2032
- Figure 41: Latin America Ridesharing Market Revenue Share (%), by Service Type 2024 & 2032
- Figure 42: Latin America Ridesharing Market Revenue (Million), by Country 2024 & 2032
- Figure 43: Latin America Ridesharing Market Revenue Share (%), by Country 2024 & 2032
- Figure 44: Middle East and Africa Ridesharing Market Revenue (Million), by Membership Type 2024 & 2032
- Figure 45: Middle East and Africa Ridesharing Market Revenue Share (%), by Membership Type 2024 & 2032
- Figure 46: Middle East and Africa Ridesharing Market Revenue (Million), by Service Type 2024 & 2032
- Figure 47: Middle East and Africa Ridesharing Market Revenue Share (%), by Service Type 2024 & 2032
- Figure 48: Middle East and Africa Ridesharing Market Revenue (Million), by Country 2024 & 2032
- Figure 49: Middle East and Africa Ridesharing Market Revenue Share (%), by Country 2024 & 2032
List of Tables
- Table 1: Global Ridesharing Market Revenue Million Forecast, by Region 2019 & 2032
- Table 2: Global Ridesharing Market Revenue Million Forecast, by Membership Type 2019 & 2032
- Table 3: Global Ridesharing Market Revenue Million Forecast, by Service Type 2019 & 2032
- Table 4: Global Ridesharing Market Revenue Million Forecast, by Region 2019 & 2032
- Table 5: Global Ridesharing Market Revenue Million Forecast, by Country 2019 & 2032
- Table 6: United States Ridesharing Market Revenue (Million) Forecast, by Application 2019 & 2032
- Table 7: Canada Ridesharing Market Revenue (Million) Forecast, by Application 2019 & 2032
- Table 8: Mexico Ridesharing Market Revenue (Million) Forecast, by Application 2019 & 2032
- Table 9: Global Ridesharing Market Revenue Million Forecast, by Country 2019 & 2032
- Table 10: Germany Ridesharing Market Revenue (Million) Forecast, by Application 2019 & 2032
- Table 11: United Kingdom Ridesharing Market Revenue (Million) Forecast, by Application 2019 & 2032
- Table 12: France Ridesharing Market Revenue (Million) Forecast, by Application 2019 & 2032
- Table 13: Spain Ridesharing Market Revenue (Million) Forecast, by Application 2019 & 2032
- Table 14: Italy Ridesharing Market Revenue (Million) Forecast, by Application 2019 & 2032
- Table 15: Spain Ridesharing Market Revenue (Million) Forecast, by Application 2019 & 2032
- Table 16: Belgium Ridesharing Market Revenue (Million) Forecast, by Application 2019 & 2032
- Table 17: Netherland Ridesharing Market Revenue (Million) Forecast, by Application 2019 & 2032
- Table 18: Nordics Ridesharing Market Revenue (Million) Forecast, by Application 2019 & 2032
- Table 19: Rest of Europe Ridesharing Market Revenue (Million) Forecast, by Application 2019 & 2032
- Table 20: Global Ridesharing Market Revenue Million Forecast, by Country 2019 & 2032
- Table 21: China Ridesharing Market Revenue (Million) Forecast, by Application 2019 & 2032
- Table 22: Japan Ridesharing Market Revenue (Million) Forecast, by Application 2019 & 2032
- Table 23: India Ridesharing Market Revenue (Million) Forecast, by Application 2019 & 2032
- Table 24: South Korea Ridesharing Market Revenue (Million) Forecast, by Application 2019 & 2032
- Table 25: Southeast Asia Ridesharing Market Revenue (Million) Forecast, by Application 2019 & 2032
- Table 26: Australia Ridesharing Market Revenue (Million) Forecast, by Application 2019 & 2032
- Table 27: Indonesia Ridesharing Market Revenue (Million) Forecast, by Application 2019 & 2032
- Table 28: Phillipes Ridesharing Market Revenue (Million) Forecast, by Application 2019 & 2032
- Table 29: Singapore Ridesharing Market Revenue (Million) Forecast, by Application 2019 & 2032
- Table 30: Thailandc Ridesharing Market Revenue (Million) Forecast, by Application 2019 & 2032
- Table 31: Rest of Asia Pacific Ridesharing Market Revenue (Million) Forecast, by Application 2019 & 2032
- Table 32: Global Ridesharing Market Revenue Million Forecast, by Country 2019 & 2032
- Table 33: Brazil Ridesharing Market Revenue (Million) Forecast, by Application 2019 & 2032
- Table 34: Argentina Ridesharing Market Revenue (Million) Forecast, by Application 2019 & 2032
- Table 35: Peru Ridesharing Market Revenue (Million) Forecast, by Application 2019 & 2032
- Table 36: Chile Ridesharing Market Revenue (Million) Forecast, by Application 2019 & 2032
- Table 37: Colombia Ridesharing Market Revenue (Million) Forecast, by Application 2019 & 2032
- Table 38: Ecuador Ridesharing Market Revenue (Million) Forecast, by Application 2019 & 2032
- Table 39: Venezuela Ridesharing Market Revenue (Million) Forecast, by Application 2019 & 2032
- Table 40: Rest of South America Ridesharing Market Revenue (Million) Forecast, by Application 2019 & 2032
- Table 41: Global Ridesharing Market Revenue Million Forecast, by Country 2019 & 2032
- Table 42: United States Ridesharing Market Revenue (Million) Forecast, by Application 2019 & 2032
- Table 43: Canada Ridesharing Market Revenue (Million) Forecast, by Application 2019 & 2032
- Table 44: Mexico Ridesharing Market Revenue (Million) Forecast, by Application 2019 & 2032
- Table 45: Global Ridesharing Market Revenue Million Forecast, by Country 2019 & 2032
- Table 46: United Arab Emirates Ridesharing Market Revenue (Million) Forecast, by Application 2019 & 2032
- Table 47: Saudi Arabia Ridesharing Market Revenue (Million) Forecast, by Application 2019 & 2032
- Table 48: South Africa Ridesharing Market Revenue (Million) Forecast, by Application 2019 & 2032
- Table 49: Rest of Middle East and Africa Ridesharing Market Revenue (Million) Forecast, by Application 2019 & 2032
- Table 50: Global Ridesharing Market Revenue Million Forecast, by Membership Type 2019 & 2032
- Table 51: Global Ridesharing Market Revenue Million Forecast, by Service Type 2019 & 2032
- Table 52: Global Ridesharing Market Revenue Million Forecast, by Country 2019 & 2032
- Table 53: Global Ridesharing Market Revenue Million Forecast, by Membership Type 2019 & 2032
- Table 54: Global Ridesharing Market Revenue Million Forecast, by Service Type 2019 & 2032
- Table 55: Global Ridesharing Market Revenue Million Forecast, by Country 2019 & 2032
- Table 56: Global Ridesharing Market Revenue Million Forecast, by Membership Type 2019 & 2032
- Table 57: Global Ridesharing Market Revenue Million Forecast, by Service Type 2019 & 2032
- Table 58: Global Ridesharing Market Revenue Million Forecast, by Country 2019 & 2032
- Table 59: Global Ridesharing Market Revenue Million Forecast, by Membership Type 2019 & 2032
- Table 60: Global Ridesharing Market Revenue Million Forecast, by Service Type 2019 & 2032
- Table 61: Global Ridesharing Market Revenue Million Forecast, by Country 2019 & 2032
- Table 62: Global Ridesharing Market Revenue Million Forecast, by Membership Type 2019 & 2032
- Table 63: Global Ridesharing Market Revenue Million Forecast, by Service Type 2019 & 2032
- Table 64: Global Ridesharing Market Revenue Million Forecast, by Country 2019 & 2032
- Table 65: Global Ridesharing Market Revenue Million Forecast, by Membership Type 2019 & 2032
- Table 66: Global Ridesharing Market Revenue Million Forecast, by Service Type 2019 & 2032
- Table 67: Global Ridesharing Market Revenue Million Forecast, by Country 2019 & 2032
Frequently Asked Questions
1. What is the projected Compound Annual Growth Rate (CAGR) of the Ridesharing Market?
The projected CAGR is approximately 12.81%.
2. Which companies are prominent players in the Ridesharing Market?
Key companies in the market include Flinc GmbH (Daimler Mobility Services), BlaBlaCar (Comuto SA), SPLT (Bosch), Didi Chuxing Technology Co, HyreCar Inc, KINTO Join Limited, Wunder Mobility Solutions GmbH, Kangaride Canada Co, GoMore, Klaxit SAS (formerly Wayzup), Scoop Technologies Inc, Vride Inc (Acquired by Enterprise Holdings Inc, CarpoolWorld (Datasphere Corporation), Via Transportation Inc, Zimride Inc.
3. What are the main segments of the Ridesharing Market?
The market segments include Membership Type, Service Type.
4. Can you provide details about the market size?
The market size is estimated to be USD 47.62 Million as of 2022.
5. What are some drivers contributing to market growth?
Cost Advantage and Increasing Availability of Carpooling/Corporate Pooling Services; Incentives and Rebates Provided by Governments in Major Markets. such as France; Increasing Cost of Vehicle Ownership and Environmental Benefits.
6. What are the notable trends driving market growth?
COVID-19 Has Posed Significant Threat to the Market.
7. Are there any restraints impacting market growth?
Technical Challenges Pertaining to CMP Technique.
8. Can you provide examples of recent developments in the market?
June 2022 - Uber has launched a new UberX Share service to share rides, which is remarkably similar to Uber's pre-pandemic carpooling feature, but with a monetary incentive. Riders who choose UberX Share will be paired with another co-rider traveling in the same direction. Uber will give riders a 20% reduction on the overall fee in exchange for the inconvenience and extra time spent on the road. Even if riders are not matched with a co-rider, they will receive an up-front discount on their ride.
9. What pricing options are available for accessing the report?
Pricing options include single-user, multi-user, and enterprise licenses priced at USD 4750, USD 5250, and USD 8750 respectively.
10. Is the market size provided in terms of value or volume?
The market size is provided in terms of value, measured in Million.
11. Are there any specific market keywords associated with the report?
Yes, the market keyword associated with the report is "Ridesharing Market," which aids in identifying and referencing the specific market segment covered.
12. How do I determine which pricing option suits my needs best?
The pricing options vary based on user requirements and access needs. Individual users may opt for single-user licenses, while businesses requiring broader access may choose multi-user or enterprise licenses for cost-effective access to the report.
13. Are there any additional resources or data provided in the Ridesharing Market report?
While the report offers comprehensive insights, it's advisable to review the specific contents or supplementary materials provided to ascertain if additional resources or data are available.
14. How can I stay updated on further developments or reports in the Ridesharing Market?
To stay informed about further developments, trends, and reports in the Ridesharing Market, consider subscribing to industry newsletters, following relevant companies and organizations, or regularly checking reputable industry news sources and publications.
Methodology
Step 1 - Identification of Relevant Samples Size from Population Database


Step 2 - Approaches for Defining Global Market Size (Value, Volume* & Price*)

Note*: In applicable scenarios
Step 3 - Data Sources
Primary Research
- Web Analytics
- Survey Reports
- Research Institute
- Latest Research Reports
- Opinion Leaders
Secondary Research
- Annual Reports
- White Paper
- Latest Press Release
- Industry Association
- Paid Database
- Investor Presentations

Step 4 - Data Triangulation
Involves using different sources of information in order to increase the validity of a study
These sources are likely to be stakeholders in a program - participants, other researchers, program staff, other community members, and so on.
Then we put all data in single framework & apply various statistical tools to find out the dynamic on the market.
During the analysis stage, feedback from the stakeholder groups would be compared to determine areas of agreement as well as areas of divergence
