

Key Insights
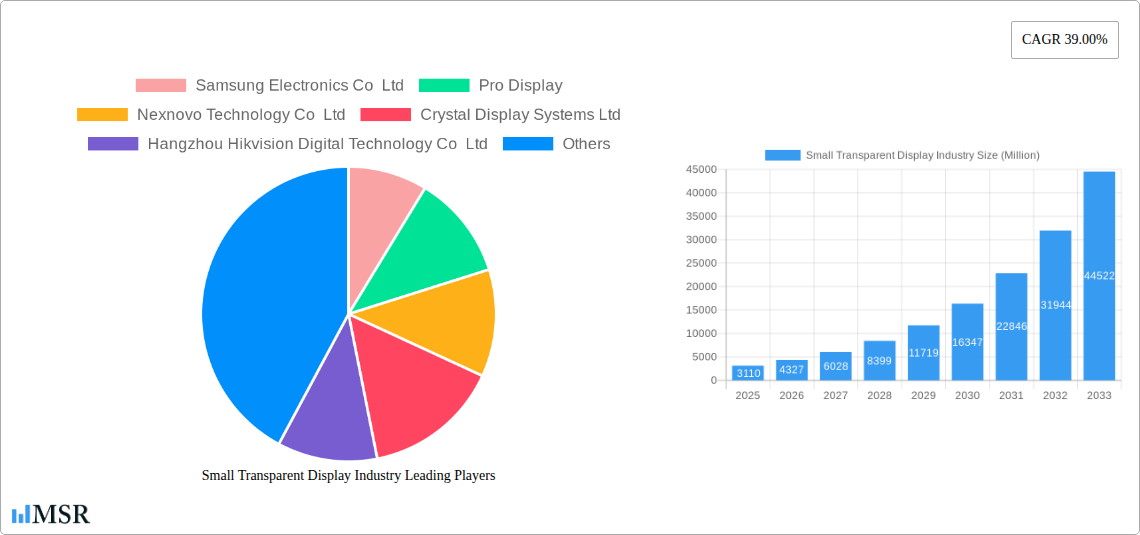
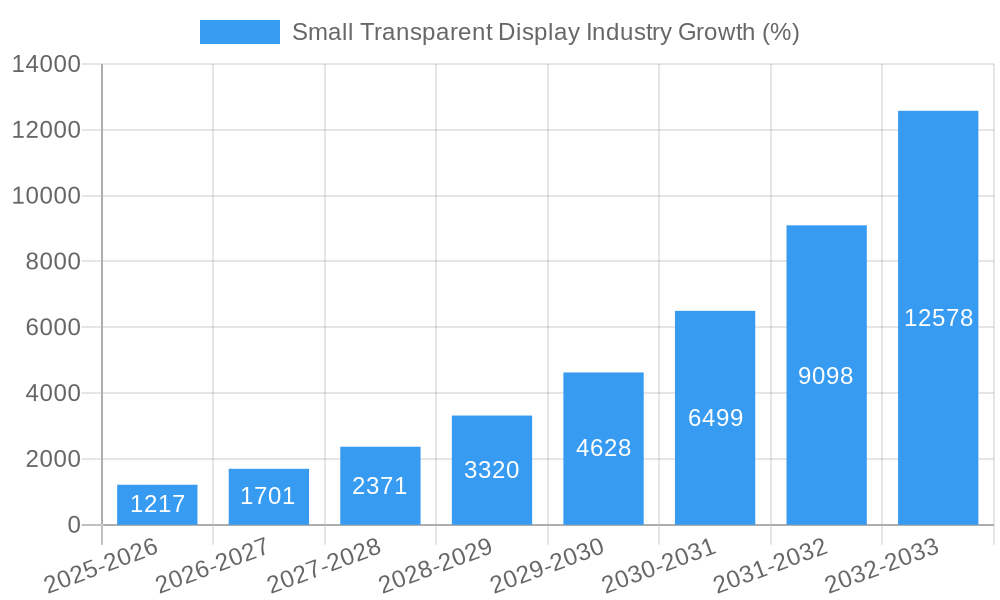
The small transparent display market is experiencing robust growth, projected to reach $3.11 billion in 2025 and exhibiting a remarkable Compound Annual Growth Rate (CAGR) of 39% from 2025 to 2033. This expansion is fueled by several key drivers. The increasing demand for aesthetically pleasing and innovative displays in consumer electronics, particularly smartphones and wearables, is a significant factor. Furthermore, the automotive industry's adoption of transparent displays for head-up displays (HUDs) and in-car infotainment systems is significantly contributing to market growth. Advancements in display technologies, such as OLED and other emerging technologies beyond LCD, are enabling higher transparency, improved brightness, and enhanced color accuracy, further stimulating market demand. The retail sector is also embracing transparent displays for interactive showcases and digital signage, enhancing customer engagement and providing unique brand experiences. While supply chain complexities and high manufacturing costs could pose some restraints, the overall market outlook remains exceptionally positive, driven by technological advancements and expanding applications across diverse sectors.
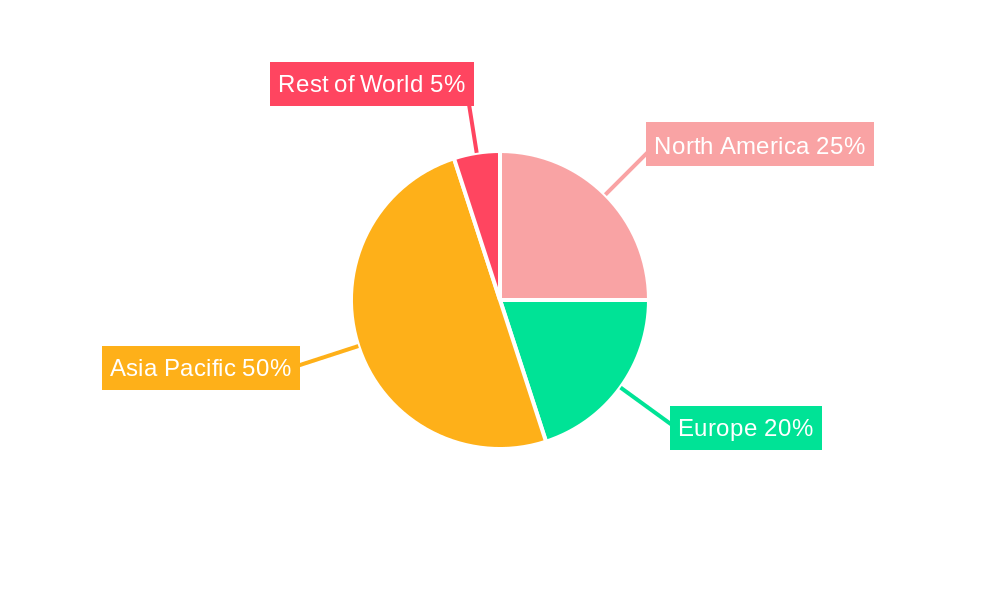
The segmentation of the market reveals a dynamic landscape. The OLED technology segment is expected to witness the fastest growth due to its superior image quality and energy efficiency compared to LCD. Within end-user industries, consumer electronics currently holds the largest market share, followed by the automotive sector's rapidly growing contribution. Geographically, Asia-Pacific, particularly China and South Korea, are major market players, driven by substantial manufacturing capabilities and high consumer electronics demand. North America and Europe are also experiencing significant growth, primarily fueled by the automotive and retail sectors' adoption of transparent display technologies. Companies like Samsung, LG, and BOE are key players, constantly innovating and competing to capture a larger market share through technological advancements and strategic partnerships. The forecast period of 2025-2033 promises continued expansion, driven by ongoing technological improvements, expanding applications, and increased investments in research and development.
Small Transparent Display Market Report: 2019-2033 Forecast
This comprehensive report provides an in-depth analysis of the small transparent display market, projecting a robust growth trajectory fueled by technological advancements and expanding applications across diverse sectors. Valued at xx Million in 2025, the market is poised to reach xx Million by 2033, exhibiting a CAGR of xx% during the forecast period (2025-2033). The report covers the historical period (2019-2024), uses 2025 as the base year, and extends its projections to 2033, offering actionable insights for industry stakeholders. Key players analyzed include Samsung Electronics Co Ltd, Pro Display, Nexnovo Technology Co Ltd, Crystal Display Systems Ltd, Hangzhou Hikvision Digital Technology Co Ltd, Planar Systems Inc (Leyard Optoelectronic Co), Shenzhen AuroLED Technology Co Ltd, BOE Technology Group, LG Electronics Co Ltd, Panasonic Corporation, and 2Point0 Concepts. The market is segmented by technology (LCD, OLED, Other Technologies) and end-user industry (Retail, Consumer Electronics, Automotive, Aerospace & Defense, Other End-user Industries).
Small Transparent Display Industry Market Concentration & Dynamics
The small transparent display market exhibits a moderately concentrated landscape, with a few key players holding significant market share. Samsung Electronics Co Ltd and LG Electronics Co Ltd are major players, while others like BOE Technology Group and Nexnovo Technology Co Ltd are increasingly competitive. Market share dynamics are influenced by technological innovations, particularly in OLED and microLED technologies. The industry is characterized by a dynamic innovation ecosystem, with continuous advancements in display resolution, brightness, and transparency levels driving growth. Regulatory frameworks concerning safety and environmental standards play a crucial role. Substitute products, such as projected displays, compete for market share. End-user trends, notably the increasing demand for interactive and aesthetically pleasing displays in retail and automotive sectors, are key market drivers. M&A activities have been moderate, with xx deals recorded between 2019 and 2024, resulting in increased consolidation and technological integration within the industry.
- Market Concentration: Moderately concentrated, with top 5 players holding approximately xx% market share in 2024.
- Innovation Ecosystem: Highly dynamic, focusing on advancements in OLED, microLED, and other emerging technologies.
- Regulatory Frameworks: Stringent safety and environmental regulations influence manufacturing and product design.
- Substitute Products: Projected displays and traditional LCDs pose some competitive pressure.
- End-User Trends: Growing demand in automotive, retail, and consumer electronics sectors.
- M&A Activities: xx M&A deals recorded between 2019 and 2024.
Small Transparent Display Industry Industry Insights & Trends
The small transparent display market is experiencing significant growth, driven primarily by technological advancements and rising demand from diverse end-user industries. The market size, valued at xx Million in 2024, is expected to experience substantial growth, reaching xx Million by 2025 and xx Million by 2033. This translates to a CAGR of xx% over the forecast period. Key growth drivers include the increasing adoption of transparent displays in automotive head-up displays (HUDs), interactive retail displays, and advanced consumer electronics. The shift towards aesthetically pleasing and energy-efficient displays fuels this growth. Technological disruptions such as the emergence of microLED technology and flexible displays are reshaping market dynamics. Evolving consumer behavior, emphasizing seamless integration of technology into daily life, further strengthens the market outlook.
Key Markets & Segments Leading Small Transparent Display Industry
The automotive sector is currently the dominant end-user industry for small transparent displays, driven by the increasing integration of advanced driver-assistance systems (ADAS) and infotainment features. Asia-Pacific region holds the largest market share owing to robust economic growth, increasing consumer spending, and strong manufacturing base. Within technologies, OLED displays are witnessing rapid adoption due to superior image quality and energy efficiency, followed by LCDs and emerging technologies.
- Dominant Region: Asia-Pacific
- Dominant End-user Industry: Automotive
- Dominant Technology: OLED
- Drivers for Automotive Sector: Increased adoption of ADAS, demand for advanced infotainment systems, and improved driver experience.
- Drivers for Asia-Pacific: Strong economic growth, rising disposable incomes, and a thriving electronics manufacturing sector.
Small Transparent Display Industry Product Developments
Recent innovations in small transparent displays encompass advancements in microLED technology, offering higher brightness, improved resolution, and enhanced transparency levels. These advancements are expanding applications into the automotive, retail, and wearable device markets. The development of flexible transparent displays is further broadening the range of potential applications, particularly in consumer electronics. Companies are focusing on enhancing the durability and longevity of these displays to meet the diverse needs of various end-user sectors. These developments are creating significant competitive edges for companies that can deliver high-quality, reliable, and cost-effective solutions.
Challenges in the Small Transparent Display Industry Market
The small transparent display market faces challenges like high manufacturing costs, limited production capacity, and complex supply chains, impacting overall market availability. Stringent regulatory requirements relating to safety and environmental compliance create barriers to entry for new players. Competition from established players, particularly in mature markets, also presents a challenge. These issues result in xx Million of losses annually in research and development.
Forces Driving Small Transparent Display Industry Growth
Several factors drive the growth of the small transparent display industry. Technological advancements in OLED and microLED technology are enhancing display performance. Increased demand from diverse end-user industries, particularly in automotive, consumer electronics, and retail, is fueling market expansion. Supportive government policies and initiatives promoting technological innovation are also stimulating market growth.
Challenges in the Small Transparent Display Industry Market
Long-term growth hinges on continuous innovation in display technologies, strategic partnerships across the value chain, and exploration of new markets. Collaboration between display manufacturers and end-users to develop specialized solutions will be crucial. Expansion into niche applications such as augmented reality (AR) and smart wearables offers significant growth potential.
Emerging Opportunities in Small Transparent Display Industry
Emerging opportunities exist in smart glasses, head-up displays, transparent interactive retail kiosks, and architectural applications. The adoption of these technologies in emerging economies also presents significant growth potential. The integration of transparent displays with other technologies like sensors and AI offers further market expansion.
Leading Players in the Small Transparent Display Industry Sector
- Samsung Electronics Co Ltd
- Pro Display
- Nexnovo Technology Co Ltd
- Crystal Display Systems Ltd
- Hangzhou Hikvision Digital Technology Co Ltd
- Planar Systems Inc (Leyard Optoelectronic Co)
- Shenzhen AuroLED Technology Co Ltd
- BOE Technology Group
- LG Electronics Co Ltd
- Panasonic Corporation
- 2Point0 Concepts
Key Milestones in Small Transparent Display Industry Industry
- July 2023: Tianma unveils transparent microLED display prototypes at Display Week 2023, targeting the automotive sector. The 8.75” panel boasts 880x480 resolution, 800 nits brightness, and >70% transparency. This launch signals a significant advancement in microLED technology for transparent displays.
- June 2023: LG Business Solutions USA showcases transparent digital displays at InfoComm 2023, including LED films, a 55-inch OLED panel, and touch displays, expanding the design possibilities for businesses and artists. This highlights the increasing focus on versatile applications of transparent displays.
Strategic Outlook for Small Transparent Display Market
The small transparent display market holds substantial future potential, driven by ongoing technological advancements and the increasing demand for innovative display solutions across various sectors. Strategic opportunities lie in developing cost-effective manufacturing processes, fostering collaborations with end-user industries, and exploring new applications in emerging markets. Companies that can effectively address the challenges related to production costs and supply chain complexities while delivering high-quality products will be best positioned to capitalize on the market's growth potential.
Small Transparent Display Industry Segmentation
-
1. Technology
- 1.1. LCD
- 1.2. OLED
- 1.3. Other Technologies
-
2. End-user Industry
- 2.1. Retail
- 2.2. Consumer Electronics
- 2.3. Automotive
- 2.4. Aerospace and Defense
- 2.5. Other End-user Industries
Small Transparent Display Industry Segmentation By Geography
-
1. North America
- 1.1. United States
- 1.2. Canada
-
2. Europe
- 2.1. Germany
- 2.2. United Kingdom
- 2.3. France
-
3. Asia
- 3.1. China
- 3.2. Japan
- 3.3. India
- 3.4. South Korea
- 3.5. Australia and New Zealand
- 4. Latin America
- 5. Middle East and Africa
Small Transparent Display Industry REPORT HIGHLIGHTS
| Aspects | Details |
|---|---|
| Study Period | 2019-2033 |
| Base Year | 2024 |
| Estimated Year | 2025 |
| Forecast Period | 2025-2033 |
| Historical Period | 2019-2024 |
| Growth Rate | CAGR of 39.00% from 2019-2033 |
| Segmentation |
|
Table of Contents
- 1. Introduction
- 1.1. Research Scope
- 1.2. Market Segmentation
- 1.3. Research Methodology
- 1.4. Definitions and Assumptions
- 2. Executive Summary
- 2.1. Introduction
- 3. Market Dynamics
- 3.1. Introduction
- 3.2. Market Drivers
- 3.2.1. Increasing Demand for Advanced Displays in the Automotive Market; Growth of Augmented and Virtual Reality
- 3.3. Market Restrains
- 3.3.1. Complex Manufacturing Process and Expensive to Deploy in Consumer Products
- 3.4. Market Trends
- 3.4.1. Retail Sector to Hold a Significant Market Share
- 4. Market Factor Analysis
- 4.1. Porters Five Forces
- 4.2. Supply/Value Chain
- 4.3. PESTEL analysis
- 4.4. Market Entropy
- 4.5. Patent/Trademark Analysis
- 5. Global Small Transparent Display Industry Analysis, Insights and Forecast, 2019-2031
- 5.1. Market Analysis, Insights and Forecast - by Technology
- 5.1.1. LCD
- 5.1.2. OLED
- 5.1.3. Other Technologies
- 5.2. Market Analysis, Insights and Forecast - by End-user Industry
- 5.2.1. Retail
- 5.2.2. Consumer Electronics
- 5.2.3. Automotive
- 5.2.4. Aerospace and Defense
- 5.2.5. Other End-user Industries
- 5.3. Market Analysis, Insights and Forecast - by Region
- 5.3.1. North America
- 5.3.2. Europe
- 5.3.3. Asia
- 5.3.4. Latin America
- 5.3.5. Middle East and Africa
- 5.1. Market Analysis, Insights and Forecast - by Technology
- 6. North America Small Transparent Display Industry Analysis, Insights and Forecast, 2019-2031
- 6.1. Market Analysis, Insights and Forecast - by Technology
- 6.1.1. LCD
- 6.1.2. OLED
- 6.1.3. Other Technologies
- 6.2. Market Analysis, Insights and Forecast - by End-user Industry
- 6.2.1. Retail
- 6.2.2. Consumer Electronics
- 6.2.3. Automotive
- 6.2.4. Aerospace and Defense
- 6.2.5. Other End-user Industries
- 6.1. Market Analysis, Insights and Forecast - by Technology
- 7. Europe Small Transparent Display Industry Analysis, Insights and Forecast, 2019-2031
- 7.1. Market Analysis, Insights and Forecast - by Technology
- 7.1.1. LCD
- 7.1.2. OLED
- 7.1.3. Other Technologies
- 7.2. Market Analysis, Insights and Forecast - by End-user Industry
- 7.2.1. Retail
- 7.2.2. Consumer Electronics
- 7.2.3. Automotive
- 7.2.4. Aerospace and Defense
- 7.2.5. Other End-user Industries
- 7.1. Market Analysis, Insights and Forecast - by Technology
- 8. Asia Small Transparent Display Industry Analysis, Insights and Forecast, 2019-2031
- 8.1. Market Analysis, Insights and Forecast - by Technology
- 8.1.1. LCD
- 8.1.2. OLED
- 8.1.3. Other Technologies
- 8.2. Market Analysis, Insights and Forecast - by End-user Industry
- 8.2.1. Retail
- 8.2.2. Consumer Electronics
- 8.2.3. Automotive
- 8.2.4. Aerospace and Defense
- 8.2.5. Other End-user Industries
- 8.1. Market Analysis, Insights and Forecast - by Technology
- 9. Latin America Small Transparent Display Industry Analysis, Insights and Forecast, 2019-2031
- 9.1. Market Analysis, Insights and Forecast - by Technology
- 9.1.1. LCD
- 9.1.2. OLED
- 9.1.3. Other Technologies
- 9.2. Market Analysis, Insights and Forecast - by End-user Industry
- 9.2.1. Retail
- 9.2.2. Consumer Electronics
- 9.2.3. Automotive
- 9.2.4. Aerospace and Defense
- 9.2.5. Other End-user Industries
- 9.1. Market Analysis, Insights and Forecast - by Technology
- 10. Middle East and Africa Small Transparent Display Industry Analysis, Insights and Forecast, 2019-2031
- 10.1. Market Analysis, Insights and Forecast - by Technology
- 10.1.1. LCD
- 10.1.2. OLED
- 10.1.3. Other Technologies
- 10.2. Market Analysis, Insights and Forecast - by End-user Industry
- 10.2.1. Retail
- 10.2.2. Consumer Electronics
- 10.2.3. Automotive
- 10.2.4. Aerospace and Defense
- 10.2.5. Other End-user Industries
- 10.1. Market Analysis, Insights and Forecast - by Technology
- 11. North America Small Transparent Display Industry Analysis, Insights and Forecast, 2019-2031
- 11.1. Market Analysis, Insights and Forecast - By Country/Sub-region
- 11.1.1 United States
- 11.1.2 Canada
- 12. Europe Small Transparent Display Industry Analysis, Insights and Forecast, 2019-2031
- 12.1. Market Analysis, Insights and Forecast - By Country/Sub-region
- 12.1.1 Germany
- 12.1.2 United Kingdom
- 12.1.3 France
- 12.1.4 Rest of Europe
- 13. Asia Pacific Small Transparent Display Industry Analysis, Insights and Forecast, 2019-2031
- 13.1. Market Analysis, Insights and Forecast - By Country/Sub-region
- 13.1.1 China
- 13.1.2 Japan
- 13.1.3 India
- 13.1.4 South Korea
- 13.1.5 Rest of Asia Pacific
- 14. Rest of the World Small Transparent Display Industry Analysis, Insights and Forecast, 2019-2031
- 14.1. Market Analysis, Insights and Forecast - By Country/Sub-region
- 14.1.1.
- 15. Competitive Analysis
- 15.1. Global Market Share Analysis 2024
- 15.2. Company Profiles
- 15.2.1 Samsung Electronics Co Ltd
- 15.2.1.1. Overview
- 15.2.1.2. Products
- 15.2.1.3. SWOT Analysis
- 15.2.1.4. Recent Developments
- 15.2.1.5. Financials (Based on Availability)
- 15.2.2 Pro Display
- 15.2.2.1. Overview
- 15.2.2.2. Products
- 15.2.2.3. SWOT Analysis
- 15.2.2.4. Recent Developments
- 15.2.2.5. Financials (Based on Availability)
- 15.2.3 Nexnovo Technology Co Ltd
- 15.2.3.1. Overview
- 15.2.3.2. Products
- 15.2.3.3. SWOT Analysis
- 15.2.3.4. Recent Developments
- 15.2.3.5. Financials (Based on Availability)
- 15.2.4 Crystal Display Systems Ltd
- 15.2.4.1. Overview
- 15.2.4.2. Products
- 15.2.4.3. SWOT Analysis
- 15.2.4.4. Recent Developments
- 15.2.4.5. Financials (Based on Availability)
- 15.2.5 Hangzhou Hikvision Digital Technology Co Ltd
- 15.2.5.1. Overview
- 15.2.5.2. Products
- 15.2.5.3. SWOT Analysis
- 15.2.5.4. Recent Developments
- 15.2.5.5. Financials (Based on Availability)
- 15.2.6 Planar Systems Inc (Leyard Optoelectronic Co )
- 15.2.6.1. Overview
- 15.2.6.2. Products
- 15.2.6.3. SWOT Analysis
- 15.2.6.4. Recent Developments
- 15.2.6.5. Financials (Based on Availability)
- 15.2.7 Shenzhen AuroLED Technology Co Ltd
- 15.2.7.1. Overview
- 15.2.7.2. Products
- 15.2.7.3. SWOT Analysis
- 15.2.7.4. Recent Developments
- 15.2.7.5. Financials (Based on Availability)
- 15.2.8 BOE Technology Grou
- 15.2.8.1. Overview
- 15.2.8.2. Products
- 15.2.8.3. SWOT Analysis
- 15.2.8.4. Recent Developments
- 15.2.8.5. Financials (Based on Availability)
- 15.2.9 LG Electronics Co Ltd
- 15.2.9.1. Overview
- 15.2.9.2. Products
- 15.2.9.3. SWOT Analysis
- 15.2.9.4. Recent Developments
- 15.2.9.5. Financials (Based on Availability)
- 15.2.10 Panasonic Corporation
- 15.2.10.1. Overview
- 15.2.10.2. Products
- 15.2.10.3. SWOT Analysis
- 15.2.10.4. Recent Developments
- 15.2.10.5. Financials (Based on Availability)
- 15.2.11 2Point0 Concepts
- 15.2.11.1. Overview
- 15.2.11.2. Products
- 15.2.11.3. SWOT Analysis
- 15.2.11.4. Recent Developments
- 15.2.11.5. Financials (Based on Availability)
- 15.2.1 Samsung Electronics Co Ltd
List of Figures
- Figure 1: Global Small Transparent Display Industry Revenue Breakdown (Million, %) by Region 2024 & 2032
- Figure 2: North America Small Transparent Display Industry Revenue (Million), by Country 2024 & 2032
- Figure 3: North America Small Transparent Display Industry Revenue Share (%), by Country 2024 & 2032
- Figure 4: Europe Small Transparent Display Industry Revenue (Million), by Country 2024 & 2032
- Figure 5: Europe Small Transparent Display Industry Revenue Share (%), by Country 2024 & 2032
- Figure 6: Asia Pacific Small Transparent Display Industry Revenue (Million), by Country 2024 & 2032
- Figure 7: Asia Pacific Small Transparent Display Industry Revenue Share (%), by Country 2024 & 2032
- Figure 8: Rest of the World Small Transparent Display Industry Revenue (Million), by Country 2024 & 2032
- Figure 9: Rest of the World Small Transparent Display Industry Revenue Share (%), by Country 2024 & 2032
- Figure 10: North America Small Transparent Display Industry Revenue (Million), by Technology 2024 & 2032
- Figure 11: North America Small Transparent Display Industry Revenue Share (%), by Technology 2024 & 2032
- Figure 12: North America Small Transparent Display Industry Revenue (Million), by End-user Industry 2024 & 2032
- Figure 13: North America Small Transparent Display Industry Revenue Share (%), by End-user Industry 2024 & 2032
- Figure 14: North America Small Transparent Display Industry Revenue (Million), by Country 2024 & 2032
- Figure 15: North America Small Transparent Display Industry Revenue Share (%), by Country 2024 & 2032
- Figure 16: Europe Small Transparent Display Industry Revenue (Million), by Technology 2024 & 2032
- Figure 17: Europe Small Transparent Display Industry Revenue Share (%), by Technology 2024 & 2032
- Figure 18: Europe Small Transparent Display Industry Revenue (Million), by End-user Industry 2024 & 2032
- Figure 19: Europe Small Transparent Display Industry Revenue Share (%), by End-user Industry 2024 & 2032
- Figure 20: Europe Small Transparent Display Industry Revenue (Million), by Country 2024 & 2032
- Figure 21: Europe Small Transparent Display Industry Revenue Share (%), by Country 2024 & 2032
- Figure 22: Asia Small Transparent Display Industry Revenue (Million), by Technology 2024 & 2032
- Figure 23: Asia Small Transparent Display Industry Revenue Share (%), by Technology 2024 & 2032
- Figure 24: Asia Small Transparent Display Industry Revenue (Million), by End-user Industry 2024 & 2032
- Figure 25: Asia Small Transparent Display Industry Revenue Share (%), by End-user Industry 2024 & 2032
- Figure 26: Asia Small Transparent Display Industry Revenue (Million), by Country 2024 & 2032
- Figure 27: Asia Small Transparent Display Industry Revenue Share (%), by Country 2024 & 2032
- Figure 28: Latin America Small Transparent Display Industry Revenue (Million), by Technology 2024 & 2032
- Figure 29: Latin America Small Transparent Display Industry Revenue Share (%), by Technology 2024 & 2032
- Figure 30: Latin America Small Transparent Display Industry Revenue (Million), by End-user Industry 2024 & 2032
- Figure 31: Latin America Small Transparent Display Industry Revenue Share (%), by End-user Industry 2024 & 2032
- Figure 32: Latin America Small Transparent Display Industry Revenue (Million), by Country 2024 & 2032
- Figure 33: Latin America Small Transparent Display Industry Revenue Share (%), by Country 2024 & 2032
- Figure 34: Middle East and Africa Small Transparent Display Industry Revenue (Million), by Technology 2024 & 2032
- Figure 35: Middle East and Africa Small Transparent Display Industry Revenue Share (%), by Technology 2024 & 2032
- Figure 36: Middle East and Africa Small Transparent Display Industry Revenue (Million), by End-user Industry 2024 & 2032
- Figure 37: Middle East and Africa Small Transparent Display Industry Revenue Share (%), by End-user Industry 2024 & 2032
- Figure 38: Middle East and Africa Small Transparent Display Industry Revenue (Million), by Country 2024 & 2032
- Figure 39: Middle East and Africa Small Transparent Display Industry Revenue Share (%), by Country 2024 & 2032
List of Tables
- Table 1: Global Small Transparent Display Industry Revenue Million Forecast, by Region 2019 & 2032
- Table 2: Global Small Transparent Display Industry Revenue Million Forecast, by Technology 2019 & 2032
- Table 3: Global Small Transparent Display Industry Revenue Million Forecast, by End-user Industry 2019 & 2032
- Table 4: Global Small Transparent Display Industry Revenue Million Forecast, by Region 2019 & 2032
- Table 5: Global Small Transparent Display Industry Revenue Million Forecast, by Country 2019 & 2032
- Table 6: United States Small Transparent Display Industry Revenue (Million) Forecast, by Application 2019 & 2032
- Table 7: Canada Small Transparent Display Industry Revenue (Million) Forecast, by Application 2019 & 2032
- Table 8: Global Small Transparent Display Industry Revenue Million Forecast, by Country 2019 & 2032
- Table 9: Germany Small Transparent Display Industry Revenue (Million) Forecast, by Application 2019 & 2032
- Table 10: United Kingdom Small Transparent Display Industry Revenue (Million) Forecast, by Application 2019 & 2032
- Table 11: France Small Transparent Display Industry Revenue (Million) Forecast, by Application 2019 & 2032
- Table 12: Rest of Europe Small Transparent Display Industry Revenue (Million) Forecast, by Application 2019 & 2032
- Table 13: Global Small Transparent Display Industry Revenue Million Forecast, by Country 2019 & 2032
- Table 14: China Small Transparent Display Industry Revenue (Million) Forecast, by Application 2019 & 2032
- Table 15: Japan Small Transparent Display Industry Revenue (Million) Forecast, by Application 2019 & 2032
- Table 16: India Small Transparent Display Industry Revenue (Million) Forecast, by Application 2019 & 2032
- Table 17: South Korea Small Transparent Display Industry Revenue (Million) Forecast, by Application 2019 & 2032
- Table 18: Rest of Asia Pacific Small Transparent Display Industry Revenue (Million) Forecast, by Application 2019 & 2032
- Table 19: Global Small Transparent Display Industry Revenue Million Forecast, by Country 2019 & 2032
- Table 20: Small Transparent Display Industry Revenue (Million) Forecast, by Application 2019 & 2032
- Table 21: Global Small Transparent Display Industry Revenue Million Forecast, by Technology 2019 & 2032
- Table 22: Global Small Transparent Display Industry Revenue Million Forecast, by End-user Industry 2019 & 2032
- Table 23: Global Small Transparent Display Industry Revenue Million Forecast, by Country 2019 & 2032
- Table 24: United States Small Transparent Display Industry Revenue (Million) Forecast, by Application 2019 & 2032
- Table 25: Canada Small Transparent Display Industry Revenue (Million) Forecast, by Application 2019 & 2032
- Table 26: Global Small Transparent Display Industry Revenue Million Forecast, by Technology 2019 & 2032
- Table 27: Global Small Transparent Display Industry Revenue Million Forecast, by End-user Industry 2019 & 2032
- Table 28: Global Small Transparent Display Industry Revenue Million Forecast, by Country 2019 & 2032
- Table 29: Germany Small Transparent Display Industry Revenue (Million) Forecast, by Application 2019 & 2032
- Table 30: United Kingdom Small Transparent Display Industry Revenue (Million) Forecast, by Application 2019 & 2032
- Table 31: France Small Transparent Display Industry Revenue (Million) Forecast, by Application 2019 & 2032
- Table 32: Global Small Transparent Display Industry Revenue Million Forecast, by Technology 2019 & 2032
- Table 33: Global Small Transparent Display Industry Revenue Million Forecast, by End-user Industry 2019 & 2032
- Table 34: Global Small Transparent Display Industry Revenue Million Forecast, by Country 2019 & 2032
- Table 35: China Small Transparent Display Industry Revenue (Million) Forecast, by Application 2019 & 2032
- Table 36: Japan Small Transparent Display Industry Revenue (Million) Forecast, by Application 2019 & 2032
- Table 37: India Small Transparent Display Industry Revenue (Million) Forecast, by Application 2019 & 2032
- Table 38: South Korea Small Transparent Display Industry Revenue (Million) Forecast, by Application 2019 & 2032
- Table 39: Australia and New Zealand Small Transparent Display Industry Revenue (Million) Forecast, by Application 2019 & 2032
- Table 40: Global Small Transparent Display Industry Revenue Million Forecast, by Technology 2019 & 2032
- Table 41: Global Small Transparent Display Industry Revenue Million Forecast, by End-user Industry 2019 & 2032
- Table 42: Global Small Transparent Display Industry Revenue Million Forecast, by Country 2019 & 2032
- Table 43: Global Small Transparent Display Industry Revenue Million Forecast, by Technology 2019 & 2032
- Table 44: Global Small Transparent Display Industry Revenue Million Forecast, by End-user Industry 2019 & 2032
- Table 45: Global Small Transparent Display Industry Revenue Million Forecast, by Country 2019 & 2032
Frequently Asked Questions
1. What is the projected Compound Annual Growth Rate (CAGR) of the Small Transparent Display Industry?
The projected CAGR is approximately 39.00%.
2. Which companies are prominent players in the Small Transparent Display Industry?
Key companies in the market include Samsung Electronics Co Ltd, Pro Display, Nexnovo Technology Co Ltd, Crystal Display Systems Ltd, Hangzhou Hikvision Digital Technology Co Ltd, Planar Systems Inc (Leyard Optoelectronic Co ), Shenzhen AuroLED Technology Co Ltd, BOE Technology Grou, LG Electronics Co Ltd, Panasonic Corporation, 2Point0 Concepts.
3. What are the main segments of the Small Transparent Display Industry?
The market segments include Technology, End-user Industry.
4. Can you provide details about the market size?
The market size is estimated to be USD 3.11 Million as of 2022.
5. What are some drivers contributing to market growth?
Increasing Demand for Advanced Displays in the Automotive Market; Growth of Augmented and Virtual Reality.
6. What are the notable trends driving market growth?
Retail Sector to Hold a Significant Market Share.
7. Are there any restraints impacting market growth?
Complex Manufacturing Process and Expensive to Deploy in Consumer Products.
8. Can you provide examples of recent developments in the market?
Jul 2023: Tianma unveiled the latest transparent microLED display prototypes demonstrated at Display Week 2023. The company claims that the automotive sector is the primary application for these displays. The first display is an 8.75” (114 PPI) panel with an 880x480 resolution, 800 nits brightness, and more than 70% transparency.
9. What pricing options are available for accessing the report?
Pricing options include single-user, multi-user, and enterprise licenses priced at USD 4750, USD 5250, and USD 8750 respectively.
10. Is the market size provided in terms of value or volume?
The market size is provided in terms of value, measured in Million.
11. Are there any specific market keywords associated with the report?
Yes, the market keyword associated with the report is "Small Transparent Display Industry," which aids in identifying and referencing the specific market segment covered.
12. How do I determine which pricing option suits my needs best?
The pricing options vary based on user requirements and access needs. Individual users may opt for single-user licenses, while businesses requiring broader access may choose multi-user or enterprise licenses for cost-effective access to the report.
13. Are there any additional resources or data provided in the Small Transparent Display Industry report?
While the report offers comprehensive insights, it's advisable to review the specific contents or supplementary materials provided to ascertain if additional resources or data are available.
14. How can I stay updated on further developments or reports in the Small Transparent Display Industry?
To stay informed about further developments, trends, and reports in the Small Transparent Display Industry, consider subscribing to industry newsletters, following relevant companies and organizations, or regularly checking reputable industry news sources and publications.
Methodology
Step 1 - Identification of Relevant Samples Size from Population Database


Step 2 - Approaches for Defining Global Market Size (Value, Volume* & Price*)

Note*: In applicable scenarios
Step 3 - Data Sources
Primary Research
- Web Analytics
- Survey Reports
- Research Institute
- Latest Research Reports
- Opinion Leaders
Secondary Research
- Annual Reports
- White Paper
- Latest Press Release
- Industry Association
- Paid Database
- Investor Presentations

Step 4 - Data Triangulation
Involves using different sources of information in order to increase the validity of a study
These sources are likely to be stakeholders in a program - participants, other researchers, program staff, other community members, and so on.
Then we put all data in single framework & apply various statistical tools to find out the dynamic on the market.
During the analysis stage, feedback from the stakeholder groups would be compared to determine areas of agreement as well as areas of divergence
