

Key Insights
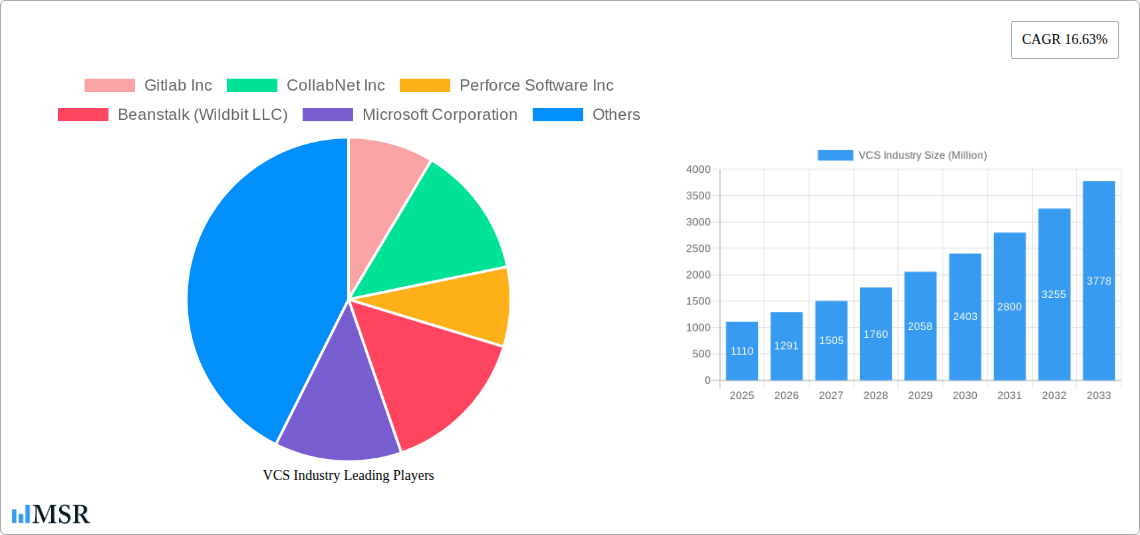
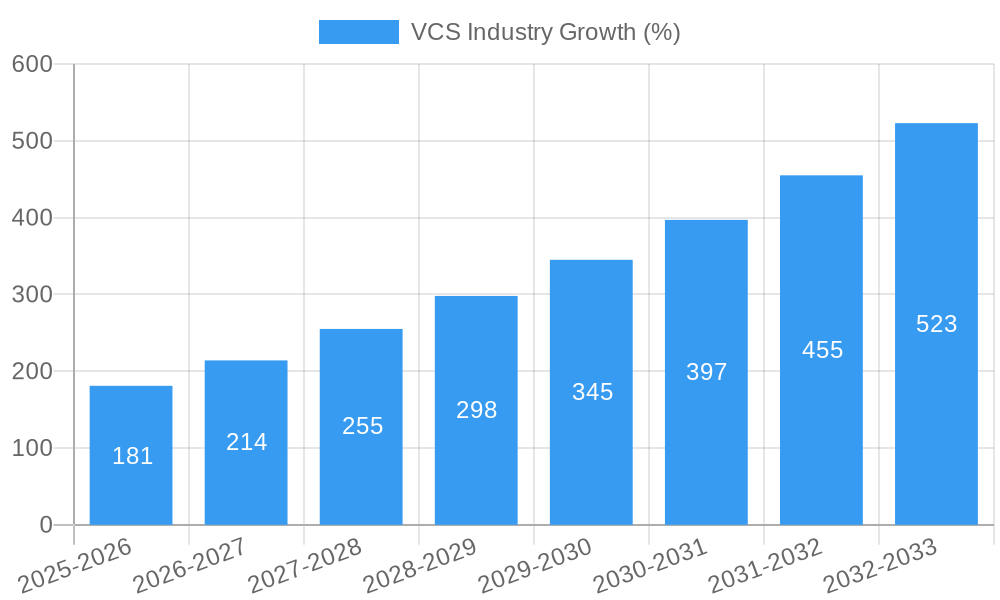
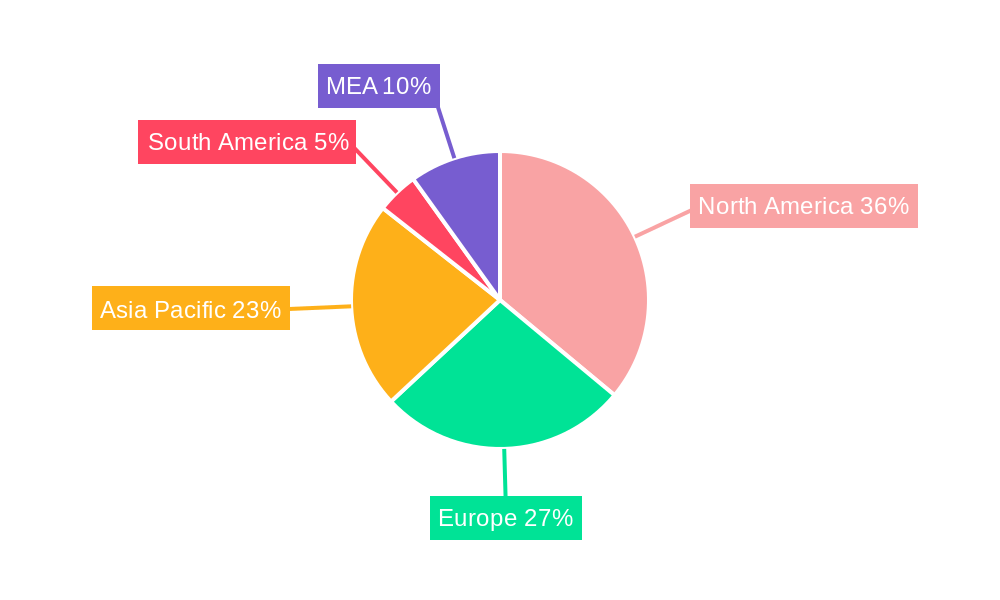
The Version Control System (VCS) market is experiencing robust growth, projected to reach $1.11 billion in 2025 and exhibiting a Compound Annual Growth Rate (CAGR) of 16.63% from 2025 to 2033. This expansion is driven by several key factors. The increasing adoption of DevOps methodologies across various industries, including IT and Telecom, Retail & E-commerce, and Healthcare and Life Sciences, fuels the demand for efficient and reliable VCS solutions. Furthermore, the shift towards cloud-based deployments offers scalability and cost-effectiveness, contributing significantly to market growth. The rise of collaborative software development practices and the growing need for secure and manageable code repositories further enhance market momentum. Segmentation analysis reveals that Distributed VCS holds a significant share, reflecting the preference for flexible and decentralized workflows. Geographic analysis indicates strong growth across North America and Asia Pacific, driven by technological advancements and a thriving digital economy in these regions. However, challenges such as security concerns related to code repositories and the complexity of integrating VCS into existing workflows could potentially act as restraints on market expansion.
The competitive landscape is characterized by a mix of established players like GitLab, Atlassian (Bitbucket), Microsoft, and Perforce, alongside emerging cloud-based providers like Amazon Web Services (AWS). This competitive environment fosters innovation and drives down pricing, making VCS solutions increasingly accessible to businesses of all sizes. Future growth will likely be influenced by advancements in AI-powered code analysis and automated workflows, further enhancing the efficiency and effectiveness of VCS platforms. The increasing demand for secure and collaborative development environments across diverse industries will ensure that the VCS market continues its robust expansion in the coming years. The expanding use of VCS in sectors like media & entertainment, travel & tourism, and educational institutions promises further market diversification and sustained growth.
VCS Industry Market Report: 2019-2033 Forecast
This comprehensive report provides a detailed analysis of the Version Control System (VCS) industry, encompassing market size, growth drivers, competitive landscape, and future outlook. With a study period spanning 2019-2033, a base year of 2025, and a forecast period of 2025-2033, this report offers invaluable insights for stakeholders across the VCS ecosystem. The report covers a market valued at Millions USD, encompassing key players like Gitlab Inc, Github Inc, and Microsoft Corporation, across various segments including Distributed VCS, Centralized VCS, and deployment modes such as On-Premise and On-Cloud. This in-depth analysis will equip you with actionable intelligence to navigate this dynamic market.
VCS Industry Market Concentration & Dynamics
The VCS market exhibits a moderately concentrated landscape, dominated by a few major players, but also featuring numerous niche providers. Market share is dynamic, with ongoing competition and strategic acquisitions shaping the competitive hierarchy. In 2025, the top 5 vendors are estimated to hold approximately xx% of the global market share. Innovation is a key driver, with continuous improvements in features, integration capabilities, and security protocols. The regulatory landscape varies by region, influencing data privacy and security compliance requirements. Substitute products are limited, although alternative development methodologies may indirectly compete. End-user trends indicate a strong preference for cloud-based solutions and increased adoption across various industries.
- M&A Activity: The historical period (2019-2024) saw approximately xx M&A deals in the VCS industry, primarily focused on consolidating smaller players and expanding product portfolios. The forecast period (2025-2033) is projected to see a further xx deals, driven by market consolidation and strategic expansion.
- Market Share (Estimated 2025): Gitlab Inc (xx%), Github Inc (xx%), Microsoft Corporation (xx%), Atlassian Corporation Plc (xx%), Other (xx%)
VCS Industry Industry Insights & Trends
The VCS industry is experiencing robust growth, fueled by the rising adoption of agile development methodologies, the increasing complexity of software development projects, and the growing demand for collaborative development tools. The global VCS market size is estimated at $xx Million in 2025, exhibiting a Compound Annual Growth Rate (CAGR) of xx% during the forecast period (2025-2033). This growth is driven by several factors, including: the increasing adoption of DevOps practices, the rise of cloud-native applications, and the growing need for efficient and secure version control solutions. Technological disruptions like AI-powered code completion and automated testing are further enhancing the capabilities of VCS platforms, driving adoption among developers. Evolving consumer behaviors demonstrate a strong preference for cloud-based VCS solutions due to scalability, cost-effectiveness, and ease of accessibility.
Key Markets & Segments Leading VCS Industry
The IT and Telecom sector remains the dominant end-user industry for VCS, followed by Retail & E-commerce and Healthcare and Life Sciences. The On-Cloud deployment mode holds the largest market share, driven by the benefits of scalability, accessibility, and cost-effectiveness. Distributed VCS systems are increasingly preferred for their flexibility and support for geographically dispersed teams.
- Dominant Regions: North America and Europe continue to be leading markets, followed by APAC.
- Drivers:
- IT and Telecom: High software development activity, demand for robust collaboration tools, and stringent security requirements.
- Retail & E-commerce: Growing reliance on e-commerce platforms, need for rapid software updates, and efficient version control for website and application development.
- Healthcare and Life Sciences: Stringent regulatory compliance, need for secure data management, and collaboration among researchers and clinicians.
- BFSI: High security requirements, need for regulatory compliance, and efficient management of financial applications.
- Other End-user Industries: Growing adoption across various sectors driven by increasing digitalization and the need for efficient software development.
- Deployment Mode: Cloud-based VCS is experiencing rapid growth due to its scalability, cost-efficiency, and accessibility.
- VCS Type: Distributed VCS is gaining traction due to its flexibility and support for distributed teams.
VCS Industry Product Developments
Recent product innovations focus on enhanced collaboration features, improved integration with CI/CD pipelines, and enhanced security capabilities. AI-powered features, such as code completion and automated testing, are becoming increasingly common, streamlining the development process and improving code quality. These advancements provide a significant competitive edge, attracting developers and businesses to adopt these advanced tools.
Challenges in the VCS Industry Market
The VCS market faces challenges including the need for continuous innovation to maintain a competitive edge, ensuring data security and privacy in the face of evolving cyber threats, and managing the complexity of integrating VCS solutions with diverse development tools and platforms. The varying levels of digital literacy across end-user industries also create hurdles for seamless adoption.
Forces Driving VCS Industry Growth
Technological advancements, such as AI-powered features and improved integration capabilities, are driving industry growth. The rising adoption of agile development methodologies and the increasing demand for collaborative software development tools fuel further market expansion. Favorable regulatory frameworks in certain regions also contribute positively. The growth of cloud computing and the increasing need for secure and efficient version control solutions are key drivers.
Long-Term Growth Catalysts in the VCS Industry
Long-term growth is fueled by continued innovation in areas like AI-driven code assistance and enhanced security features, strategic partnerships between VCS providers and other technology companies, and expansion into new markets like the Internet of Things (IoT) and edge computing.
Emerging Opportunities in VCS Industry
Emerging opportunities lie in integrating VCS solutions with AI-powered development tools, the expansion of VCS services into new industries, and catering to the growing demand for secure and efficient version control in cloud-native environments. The growing importance of DevOps further creates opportunities for advanced integration and automation.
Leading Players in the VCS Industry Sector
- Gitlab Inc
- CollabNet Inc
- Perforce Software Inc
- Beanstalk (Wildbit LLC)
- Microsoft Corporation
- Bitbucket org (Atlassian Corporation Plc)
- Amazon Web Services Inc
- APAChe Software Foundation
- Github Inc
- Dynamsoft Corporatio
Key Milestones in VCS Industry Industry
- September 2023: Accenture and Workday expand partnership to develop data-led finance solutions, impacting software and technology, retail, and media industries.
- December 2022: Microsoft introduces Git version control for canvas apps, improving collaboration in distributed development environments.
- September 2022: WebKit open-source project migrates to GitHub, highlighting GitHub's community and automation features.
Strategic Outlook for VCS Industry Market
The VCS market is poised for continued growth, driven by technological advancements, increasing adoption across diverse industries, and the expanding role of VCS in modern software development practices. Strategic opportunities exist in leveraging AI and machine learning, enhancing security features, and expanding into emerging markets. The focus on cloud-based solutions and seamless integration with other development tools will further shape the industry’s future.
VCS Industry Segmentation
-
1. Deployment Mode
- 1.1. On-Premise
- 1.2. On-Cloud
-
2. End-user Industry
- 2.1. IT and Telecom
- 2.2. Retail & E-commerce
- 2.3. Healthcare and Life Sciences
- 2.4. BFSI
- 2.5. Other
-
3. Type
- 3.1. Distributed VCS
- 3.2. Centralized VCS
VCS Industry Segmentation By Geography
- 1. North America
- 2. Europe
- 3. Asia Pacific
- 4. Latin America
- 5. Middle East and Africa
VCS Industry REPORT HIGHLIGHTS
| Aspects | Details |
|---|---|
| Study Period | 2019-2033 |
| Base Year | 2024 |
| Estimated Year | 2025 |
| Forecast Period | 2025-2033 |
| Historical Period | 2019-2024 |
| Growth Rate | CAGR of 16.63% from 2019-2033 |
| Segmentation |
|
Table of Contents
- 1. Introduction
- 1.1. Research Scope
- 1.2. Market Segmentation
- 1.3. Research Methodology
- 1.4. Definitions and Assumptions
- 2. Executive Summary
- 2.1. Introduction
- 3. Market Dynamics
- 3.1. Introduction
- 3.2. Market Drivers
- 3.2.1. Digitization of Business Processes Leading to Adoption of Software; Increasing Demand for Reduced Complexities in Software Development and Cost Optimization
- 3.3. Market Restrains
- 3.3.1. Use of Diversified Software Applications in Organizations; Growing Complexity Due to Massive Data Generation
- 3.4. Market Trends
- 3.4.1. BFSI Industry Expected to Hold Significant Share
- 4. Market Factor Analysis
- 4.1. Porters Five Forces
- 4.2. Supply/Value Chain
- 4.3. PESTEL analysis
- 4.4. Market Entropy
- 4.5. Patent/Trademark Analysis
- 5. Global VCS Industry Analysis, Insights and Forecast, 2019-2031
- 5.1. Market Analysis, Insights and Forecast - by Deployment Mode
- 5.1.1. On-Premise
- 5.1.2. On-Cloud
- 5.2. Market Analysis, Insights and Forecast - by End-user Industry
- 5.2.1. IT and Telecom
- 5.2.2. Retail & E-commerce
- 5.2.3. Healthcare and Life Sciences
- 5.2.4. BFSI
- 5.2.5. Other
- 5.3. Market Analysis, Insights and Forecast - by Type
- 5.3.1. Distributed VCS
- 5.3.2. Centralized VCS
- 5.4. Market Analysis, Insights and Forecast - by Region
- 5.4.1. North America
- 5.4.2. Europe
- 5.4.3. Asia Pacific
- 5.4.4. Latin America
- 5.4.5. Middle East and Africa
- 5.1. Market Analysis, Insights and Forecast - by Deployment Mode
- 6. North America VCS Industry Analysis, Insights and Forecast, 2019-2031
- 6.1. Market Analysis, Insights and Forecast - by Deployment Mode
- 6.1.1. On-Premise
- 6.1.2. On-Cloud
- 6.2. Market Analysis, Insights and Forecast - by End-user Industry
- 6.2.1. IT and Telecom
- 6.2.2. Retail & E-commerce
- 6.2.3. Healthcare and Life Sciences
- 6.2.4. BFSI
- 6.2.5. Other
- 6.3. Market Analysis, Insights and Forecast - by Type
- 6.3.1. Distributed VCS
- 6.3.2. Centralized VCS
- 6.1. Market Analysis, Insights and Forecast - by Deployment Mode
- 7. Europe VCS Industry Analysis, Insights and Forecast, 2019-2031
- 7.1. Market Analysis, Insights and Forecast - by Deployment Mode
- 7.1.1. On-Premise
- 7.1.2. On-Cloud
- 7.2. Market Analysis, Insights and Forecast - by End-user Industry
- 7.2.1. IT and Telecom
- 7.2.2. Retail & E-commerce
- 7.2.3. Healthcare and Life Sciences
- 7.2.4. BFSI
- 7.2.5. Other
- 7.3. Market Analysis, Insights and Forecast - by Type
- 7.3.1. Distributed VCS
- 7.3.2. Centralized VCS
- 7.1. Market Analysis, Insights and Forecast - by Deployment Mode
- 8. Asia Pacific VCS Industry Analysis, Insights and Forecast, 2019-2031
- 8.1. Market Analysis, Insights and Forecast - by Deployment Mode
- 8.1.1. On-Premise
- 8.1.2. On-Cloud
- 8.2. Market Analysis, Insights and Forecast - by End-user Industry
- 8.2.1. IT and Telecom
- 8.2.2. Retail & E-commerce
- 8.2.3. Healthcare and Life Sciences
- 8.2.4. BFSI
- 8.2.5. Other
- 8.3. Market Analysis, Insights and Forecast - by Type
- 8.3.1. Distributed VCS
- 8.3.2. Centralized VCS
- 8.1. Market Analysis, Insights and Forecast - by Deployment Mode
- 9. Latin America VCS Industry Analysis, Insights and Forecast, 2019-2031
- 9.1. Market Analysis, Insights and Forecast - by Deployment Mode
- 9.1.1. On-Premise
- 9.1.2. On-Cloud
- 9.2. Market Analysis, Insights and Forecast - by End-user Industry
- 9.2.1. IT and Telecom
- 9.2.2. Retail & E-commerce
- 9.2.3. Healthcare and Life Sciences
- 9.2.4. BFSI
- 9.2.5. Other
- 9.3. Market Analysis, Insights and Forecast - by Type
- 9.3.1. Distributed VCS
- 9.3.2. Centralized VCS
- 9.1. Market Analysis, Insights and Forecast - by Deployment Mode
- 10. Middle East and Africa VCS Industry Analysis, Insights and Forecast, 2019-2031
- 10.1. Market Analysis, Insights and Forecast - by Deployment Mode
- 10.1.1. On-Premise
- 10.1.2. On-Cloud
- 10.2. Market Analysis, Insights and Forecast - by End-user Industry
- 10.2.1. IT and Telecom
- 10.2.2. Retail & E-commerce
- 10.2.3. Healthcare and Life Sciences
- 10.2.4. BFSI
- 10.2.5. Other
- 10.3. Market Analysis, Insights and Forecast - by Type
- 10.3.1. Distributed VCS
- 10.3.2. Centralized VCS
- 10.1. Market Analysis, Insights and Forecast - by Deployment Mode
- 11. North America VCS Industry Analysis, Insights and Forecast, 2019-2031
- 11.1. Market Analysis, Insights and Forecast - By Country/Sub-region
- 11.1.1 United States
- 11.1.2 Canada
- 11.1.3 Mexico
- 12. Europe VCS Industry Analysis, Insights and Forecast, 2019-2031
- 12.1. Market Analysis, Insights and Forecast - By Country/Sub-region
- 12.1.1 Germany
- 12.1.2 United Kingdom
- 12.1.3 France
- 12.1.4 Spain
- 12.1.5 Italy
- 12.1.6 Spain
- 12.1.7 Belgium
- 12.1.8 Netherland
- 12.1.9 Nordics
- 12.1.10 Rest of Europe
- 13. Asia Pacific VCS Industry Analysis, Insights and Forecast, 2019-2031
- 13.1. Market Analysis, Insights and Forecast - By Country/Sub-region
- 13.1.1 China
- 13.1.2 Japan
- 13.1.3 India
- 13.1.4 South Korea
- 13.1.5 Southeast Asia
- 13.1.6 Australia
- 13.1.7 Indonesia
- 13.1.8 Phillipes
- 13.1.9 Singapore
- 13.1.10 Thailandc
- 13.1.11 Rest of Asia Pacific
- 14. South America VCS Industry Analysis, Insights and Forecast, 2019-2031
- 14.1. Market Analysis, Insights and Forecast - By Country/Sub-region
- 14.1.1 Brazil
- 14.1.2 Argentina
- 14.1.3 Peru
- 14.1.4 Chile
- 14.1.5 Colombia
- 14.1.6 Ecuador
- 14.1.7 Venezuela
- 14.1.8 Rest of South America
- 15. North America VCS Industry Analysis, Insights and Forecast, 2019-2031
- 15.1. Market Analysis, Insights and Forecast - By Country/Sub-region
- 15.1.1 United States
- 15.1.2 Canada
- 15.1.3 Mexico
- 16. MEA VCS Industry Analysis, Insights and Forecast, 2019-2031
- 16.1. Market Analysis, Insights and Forecast - By Country/Sub-region
- 16.1.1 United Arab Emirates
- 16.1.2 Saudi Arabia
- 16.1.3 South Africa
- 16.1.4 Rest of Middle East and Africa
- 17. Competitive Analysis
- 17.1. Global Market Share Analysis 2024
- 17.2. Company Profiles
- 17.2.1 Gitlab Inc
- 17.2.1.1. Overview
- 17.2.1.2. Products
- 17.2.1.3. SWOT Analysis
- 17.2.1.4. Recent Developments
- 17.2.1.5. Financials (Based on Availability)
- 17.2.2 CollabNet Inc
- 17.2.2.1. Overview
- 17.2.2.2. Products
- 17.2.2.3. SWOT Analysis
- 17.2.2.4. Recent Developments
- 17.2.2.5. Financials (Based on Availability)
- 17.2.3 Perforce Software Inc
- 17.2.3.1. Overview
- 17.2.3.2. Products
- 17.2.3.3. SWOT Analysis
- 17.2.3.4. Recent Developments
- 17.2.3.5. Financials (Based on Availability)
- 17.2.4 Beanstalk (Wildbit LLC)
- 17.2.4.1. Overview
- 17.2.4.2. Products
- 17.2.4.3. SWOT Analysis
- 17.2.4.4. Recent Developments
- 17.2.4.5. Financials (Based on Availability)
- 17.2.5 Microsoft Corporation
- 17.2.5.1. Overview
- 17.2.5.2. Products
- 17.2.5.3. SWOT Analysis
- 17.2.5.4. Recent Developments
- 17.2.5.5. Financials (Based on Availability)
- 17.2.6 Bitbucket org (Atlassian Corporation Plc)
- 17.2.6.1. Overview
- 17.2.6.2. Products
- 17.2.6.3. SWOT Analysis
- 17.2.6.4. Recent Developments
- 17.2.6.5. Financials (Based on Availability)
- 17.2.7 Amazon Web Services Inc
- 17.2.7.1. Overview
- 17.2.7.2. Products
- 17.2.7.3. SWOT Analysis
- 17.2.7.4. Recent Developments
- 17.2.7.5. Financials (Based on Availability)
- 17.2.8 APAChe Software Foundation
- 17.2.8.1. Overview
- 17.2.8.2. Products
- 17.2.8.3. SWOT Analysis
- 17.2.8.4. Recent Developments
- 17.2.8.5. Financials (Based on Availability)
- 17.2.9 Github Inc
- 17.2.9.1. Overview
- 17.2.9.2. Products
- 17.2.9.3. SWOT Analysis
- 17.2.9.4. Recent Developments
- 17.2.9.5. Financials (Based on Availability)
- 17.2.10 Dynamsoft Corporatio
- 17.2.10.1. Overview
- 17.2.10.2. Products
- 17.2.10.3. SWOT Analysis
- 17.2.10.4. Recent Developments
- 17.2.10.5. Financials (Based on Availability)
- 17.2.1 Gitlab Inc
List of Figures
- Figure 1: Global VCS Industry Revenue Breakdown (Million, %) by Region 2024 & 2032
- Figure 2: North America VCS Industry Revenue (Million), by Country 2024 & 2032
- Figure 3: North America VCS Industry Revenue Share (%), by Country 2024 & 2032
- Figure 4: Europe VCS Industry Revenue (Million), by Country 2024 & 2032
- Figure 5: Europe VCS Industry Revenue Share (%), by Country 2024 & 2032
- Figure 6: Asia Pacific VCS Industry Revenue (Million), by Country 2024 & 2032
- Figure 7: Asia Pacific VCS Industry Revenue Share (%), by Country 2024 & 2032
- Figure 8: South America VCS Industry Revenue (Million), by Country 2024 & 2032
- Figure 9: South America VCS Industry Revenue Share (%), by Country 2024 & 2032
- Figure 10: North America VCS Industry Revenue (Million), by Country 2024 & 2032
- Figure 11: North America VCS Industry Revenue Share (%), by Country 2024 & 2032
- Figure 12: MEA VCS Industry Revenue (Million), by Country 2024 & 2032
- Figure 13: MEA VCS Industry Revenue Share (%), by Country 2024 & 2032
- Figure 14: North America VCS Industry Revenue (Million), by Deployment Mode 2024 & 2032
- Figure 15: North America VCS Industry Revenue Share (%), by Deployment Mode 2024 & 2032
- Figure 16: North America VCS Industry Revenue (Million), by End-user Industry 2024 & 2032
- Figure 17: North America VCS Industry Revenue Share (%), by End-user Industry 2024 & 2032
- Figure 18: North America VCS Industry Revenue (Million), by Type 2024 & 2032
- Figure 19: North America VCS Industry Revenue Share (%), by Type 2024 & 2032
- Figure 20: North America VCS Industry Revenue (Million), by Country 2024 & 2032
- Figure 21: North America VCS Industry Revenue Share (%), by Country 2024 & 2032
- Figure 22: Europe VCS Industry Revenue (Million), by Deployment Mode 2024 & 2032
- Figure 23: Europe VCS Industry Revenue Share (%), by Deployment Mode 2024 & 2032
- Figure 24: Europe VCS Industry Revenue (Million), by End-user Industry 2024 & 2032
- Figure 25: Europe VCS Industry Revenue Share (%), by End-user Industry 2024 & 2032
- Figure 26: Europe VCS Industry Revenue (Million), by Type 2024 & 2032
- Figure 27: Europe VCS Industry Revenue Share (%), by Type 2024 & 2032
- Figure 28: Europe VCS Industry Revenue (Million), by Country 2024 & 2032
- Figure 29: Europe VCS Industry Revenue Share (%), by Country 2024 & 2032
- Figure 30: Asia Pacific VCS Industry Revenue (Million), by Deployment Mode 2024 & 2032
- Figure 31: Asia Pacific VCS Industry Revenue Share (%), by Deployment Mode 2024 & 2032
- Figure 32: Asia Pacific VCS Industry Revenue (Million), by End-user Industry 2024 & 2032
- Figure 33: Asia Pacific VCS Industry Revenue Share (%), by End-user Industry 2024 & 2032
- Figure 34: Asia Pacific VCS Industry Revenue (Million), by Type 2024 & 2032
- Figure 35: Asia Pacific VCS Industry Revenue Share (%), by Type 2024 & 2032
- Figure 36: Asia Pacific VCS Industry Revenue (Million), by Country 2024 & 2032
- Figure 37: Asia Pacific VCS Industry Revenue Share (%), by Country 2024 & 2032
- Figure 38: Latin America VCS Industry Revenue (Million), by Deployment Mode 2024 & 2032
- Figure 39: Latin America VCS Industry Revenue Share (%), by Deployment Mode 2024 & 2032
- Figure 40: Latin America VCS Industry Revenue (Million), by End-user Industry 2024 & 2032
- Figure 41: Latin America VCS Industry Revenue Share (%), by End-user Industry 2024 & 2032
- Figure 42: Latin America VCS Industry Revenue (Million), by Type 2024 & 2032
- Figure 43: Latin America VCS Industry Revenue Share (%), by Type 2024 & 2032
- Figure 44: Latin America VCS Industry Revenue (Million), by Country 2024 & 2032
- Figure 45: Latin America VCS Industry Revenue Share (%), by Country 2024 & 2032
- Figure 46: Middle East and Africa VCS Industry Revenue (Million), by Deployment Mode 2024 & 2032
- Figure 47: Middle East and Africa VCS Industry Revenue Share (%), by Deployment Mode 2024 & 2032
- Figure 48: Middle East and Africa VCS Industry Revenue (Million), by End-user Industry 2024 & 2032
- Figure 49: Middle East and Africa VCS Industry Revenue Share (%), by End-user Industry 2024 & 2032
- Figure 50: Middle East and Africa VCS Industry Revenue (Million), by Type 2024 & 2032
- Figure 51: Middle East and Africa VCS Industry Revenue Share (%), by Type 2024 & 2032
- Figure 52: Middle East and Africa VCS Industry Revenue (Million), by Country 2024 & 2032
- Figure 53: Middle East and Africa VCS Industry Revenue Share (%), by Country 2024 & 2032
List of Tables
- Table 1: Global VCS Industry Revenue Million Forecast, by Region 2019 & 2032
- Table 2: Global VCS Industry Revenue Million Forecast, by Deployment Mode 2019 & 2032
- Table 3: Global VCS Industry Revenue Million Forecast, by End-user Industry 2019 & 2032
- Table 4: Global VCS Industry Revenue Million Forecast, by Type 2019 & 2032
- Table 5: Global VCS Industry Revenue Million Forecast, by Region 2019 & 2032
- Table 6: Global VCS Industry Revenue Million Forecast, by Country 2019 & 2032
- Table 7: United States VCS Industry Revenue (Million) Forecast, by Application 2019 & 2032
- Table 8: Canada VCS Industry Revenue (Million) Forecast, by Application 2019 & 2032
- Table 9: Mexico VCS Industry Revenue (Million) Forecast, by Application 2019 & 2032
- Table 10: Global VCS Industry Revenue Million Forecast, by Country 2019 & 2032
- Table 11: Germany VCS Industry Revenue (Million) Forecast, by Application 2019 & 2032
- Table 12: United Kingdom VCS Industry Revenue (Million) Forecast, by Application 2019 & 2032
- Table 13: France VCS Industry Revenue (Million) Forecast, by Application 2019 & 2032
- Table 14: Spain VCS Industry Revenue (Million) Forecast, by Application 2019 & 2032
- Table 15: Italy VCS Industry Revenue (Million) Forecast, by Application 2019 & 2032
- Table 16: Spain VCS Industry Revenue (Million) Forecast, by Application 2019 & 2032
- Table 17: Belgium VCS Industry Revenue (Million) Forecast, by Application 2019 & 2032
- Table 18: Netherland VCS Industry Revenue (Million) Forecast, by Application 2019 & 2032
- Table 19: Nordics VCS Industry Revenue (Million) Forecast, by Application 2019 & 2032
- Table 20: Rest of Europe VCS Industry Revenue (Million) Forecast, by Application 2019 & 2032
- Table 21: Global VCS Industry Revenue Million Forecast, by Country 2019 & 2032
- Table 22: China VCS Industry Revenue (Million) Forecast, by Application 2019 & 2032
- Table 23: Japan VCS Industry Revenue (Million) Forecast, by Application 2019 & 2032
- Table 24: India VCS Industry Revenue (Million) Forecast, by Application 2019 & 2032
- Table 25: South Korea VCS Industry Revenue (Million) Forecast, by Application 2019 & 2032
- Table 26: Southeast Asia VCS Industry Revenue (Million) Forecast, by Application 2019 & 2032
- Table 27: Australia VCS Industry Revenue (Million) Forecast, by Application 2019 & 2032
- Table 28: Indonesia VCS Industry Revenue (Million) Forecast, by Application 2019 & 2032
- Table 29: Phillipes VCS Industry Revenue (Million) Forecast, by Application 2019 & 2032
- Table 30: Singapore VCS Industry Revenue (Million) Forecast, by Application 2019 & 2032
- Table 31: Thailandc VCS Industry Revenue (Million) Forecast, by Application 2019 & 2032
- Table 32: Rest of Asia Pacific VCS Industry Revenue (Million) Forecast, by Application 2019 & 2032
- Table 33: Global VCS Industry Revenue Million Forecast, by Country 2019 & 2032
- Table 34: Brazil VCS Industry Revenue (Million) Forecast, by Application 2019 & 2032
- Table 35: Argentina VCS Industry Revenue (Million) Forecast, by Application 2019 & 2032
- Table 36: Peru VCS Industry Revenue (Million) Forecast, by Application 2019 & 2032
- Table 37: Chile VCS Industry Revenue (Million) Forecast, by Application 2019 & 2032
- Table 38: Colombia VCS Industry Revenue (Million) Forecast, by Application 2019 & 2032
- Table 39: Ecuador VCS Industry Revenue (Million) Forecast, by Application 2019 & 2032
- Table 40: Venezuela VCS Industry Revenue (Million) Forecast, by Application 2019 & 2032
- Table 41: Rest of South America VCS Industry Revenue (Million) Forecast, by Application 2019 & 2032
- Table 42: Global VCS Industry Revenue Million Forecast, by Country 2019 & 2032
- Table 43: United States VCS Industry Revenue (Million) Forecast, by Application 2019 & 2032
- Table 44: Canada VCS Industry Revenue (Million) Forecast, by Application 2019 & 2032
- Table 45: Mexico VCS Industry Revenue (Million) Forecast, by Application 2019 & 2032
- Table 46: Global VCS Industry Revenue Million Forecast, by Country 2019 & 2032
- Table 47: United Arab Emirates VCS Industry Revenue (Million) Forecast, by Application 2019 & 2032
- Table 48: Saudi Arabia VCS Industry Revenue (Million) Forecast, by Application 2019 & 2032
- Table 49: South Africa VCS Industry Revenue (Million) Forecast, by Application 2019 & 2032
- Table 50: Rest of Middle East and Africa VCS Industry Revenue (Million) Forecast, by Application 2019 & 2032
- Table 51: Global VCS Industry Revenue Million Forecast, by Deployment Mode 2019 & 2032
- Table 52: Global VCS Industry Revenue Million Forecast, by End-user Industry 2019 & 2032
- Table 53: Global VCS Industry Revenue Million Forecast, by Type 2019 & 2032
- Table 54: Global VCS Industry Revenue Million Forecast, by Country 2019 & 2032
- Table 55: Global VCS Industry Revenue Million Forecast, by Deployment Mode 2019 & 2032
- Table 56: Global VCS Industry Revenue Million Forecast, by End-user Industry 2019 & 2032
- Table 57: Global VCS Industry Revenue Million Forecast, by Type 2019 & 2032
- Table 58: Global VCS Industry Revenue Million Forecast, by Country 2019 & 2032
- Table 59: Global VCS Industry Revenue Million Forecast, by Deployment Mode 2019 & 2032
- Table 60: Global VCS Industry Revenue Million Forecast, by End-user Industry 2019 & 2032
- Table 61: Global VCS Industry Revenue Million Forecast, by Type 2019 & 2032
- Table 62: Global VCS Industry Revenue Million Forecast, by Country 2019 & 2032
- Table 63: Global VCS Industry Revenue Million Forecast, by Deployment Mode 2019 & 2032
- Table 64: Global VCS Industry Revenue Million Forecast, by End-user Industry 2019 & 2032
- Table 65: Global VCS Industry Revenue Million Forecast, by Type 2019 & 2032
- Table 66: Global VCS Industry Revenue Million Forecast, by Country 2019 & 2032
- Table 67: Global VCS Industry Revenue Million Forecast, by Deployment Mode 2019 & 2032
- Table 68: Global VCS Industry Revenue Million Forecast, by End-user Industry 2019 & 2032
- Table 69: Global VCS Industry Revenue Million Forecast, by Type 2019 & 2032
- Table 70: Global VCS Industry Revenue Million Forecast, by Country 2019 & 2032
Frequently Asked Questions
1. What is the projected Compound Annual Growth Rate (CAGR) of the VCS Industry?
The projected CAGR is approximately 16.63%.
2. Which companies are prominent players in the VCS Industry?
Key companies in the market include Gitlab Inc, CollabNet Inc, Perforce Software Inc, Beanstalk (Wildbit LLC), Microsoft Corporation, Bitbucket org (Atlassian Corporation Plc), Amazon Web Services Inc, APAChe Software Foundation, Github Inc, Dynamsoft Corporatio.
3. What are the main segments of the VCS Industry?
The market segments include Deployment Mode, End-user Industry, Type.
4. Can you provide details about the market size?
The market size is estimated to be USD 1.11 Million as of 2022.
5. What are some drivers contributing to market growth?
Digitization of Business Processes Leading to Adoption of Software; Increasing Demand for Reduced Complexities in Software Development and Cost Optimization.
6. What are the notable trends driving market growth?
BFSI Industry Expected to Hold Significant Share.
7. Are there any restraints impacting market growth?
Use of Diversified Software Applications in Organizations; Growing Complexity Due to Massive Data Generation.
8. Can you provide examples of recent developments in the market?
September 2023 - Accenture and Workday have expanded their partnership to assist organizations in reinventing their finance functions to be more agile, data-driven, and customer-centric. The companies are collaborating to develop a suite of data-led, composable finance solutions that can be configured and reconfigured to help clients in the software and technology, retail, and media industries be more responsive to changing business requirements.
9. What pricing options are available for accessing the report?
Pricing options include single-user, multi-user, and enterprise licenses priced at USD 4750, USD 5250, and USD 8750 respectively.
10. Is the market size provided in terms of value or volume?
The market size is provided in terms of value, measured in Million.
11. Are there any specific market keywords associated with the report?
Yes, the market keyword associated with the report is "VCS Industry," which aids in identifying and referencing the specific market segment covered.
12. How do I determine which pricing option suits my needs best?
The pricing options vary based on user requirements and access needs. Individual users may opt for single-user licenses, while businesses requiring broader access may choose multi-user or enterprise licenses for cost-effective access to the report.
13. Are there any additional resources or data provided in the VCS Industry report?
While the report offers comprehensive insights, it's advisable to review the specific contents or supplementary materials provided to ascertain if additional resources or data are available.
14. How can I stay updated on further developments or reports in the VCS Industry?
To stay informed about further developments, trends, and reports in the VCS Industry, consider subscribing to industry newsletters, following relevant companies and organizations, or regularly checking reputable industry news sources and publications.
Methodology
Step 1 - Identification of Relevant Samples Size from Population Database


Step 2 - Approaches for Defining Global Market Size (Value, Volume* & Price*)

Note*: In applicable scenarios
Step 3 - Data Sources
Primary Research
- Web Analytics
- Survey Reports
- Research Institute
- Latest Research Reports
- Opinion Leaders
Secondary Research
- Annual Reports
- White Paper
- Latest Press Release
- Industry Association
- Paid Database
- Investor Presentations

Step 4 - Data Triangulation
Involves using different sources of information in order to increase the validity of a study
These sources are likely to be stakeholders in a program - participants, other researchers, program staff, other community members, and so on.
Then we put all data in single framework & apply various statistical tools to find out the dynamic on the market.
During the analysis stage, feedback from the stakeholder groups would be compared to determine areas of agreement as well as areas of divergence
