

Key Insights
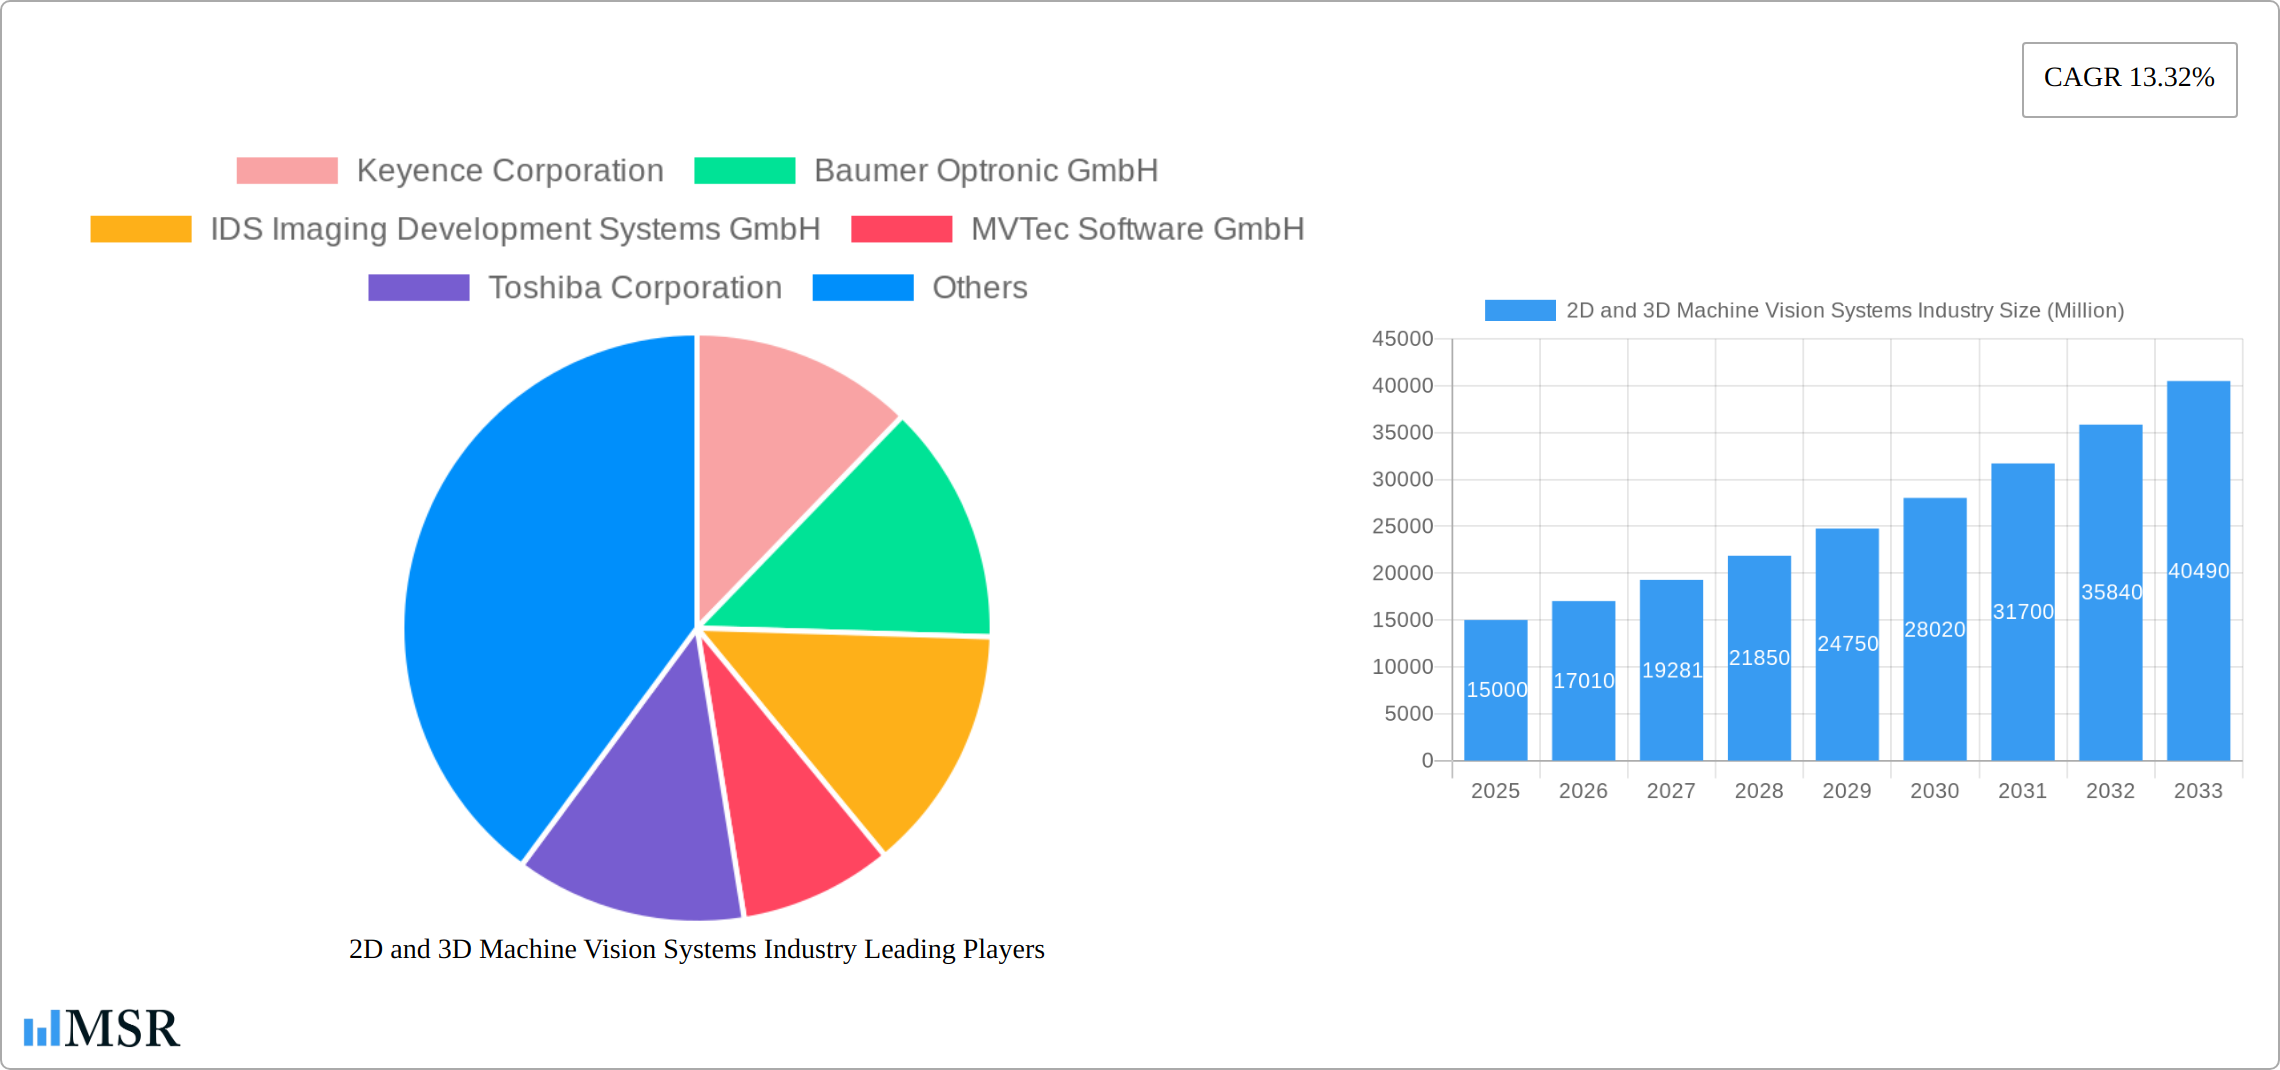
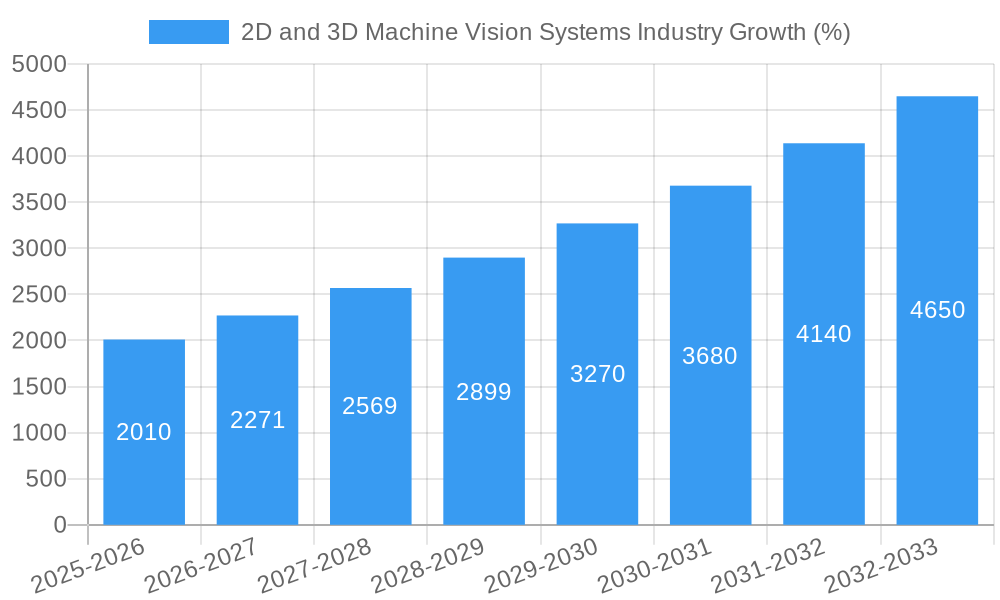
The 2D and 3D machine vision systems market is experiencing robust growth, driven by increasing automation across various industries and advancements in imaging technologies. The market's Compound Annual Growth Rate (CAGR) of 13.32% from 2019 to 2024 indicates a significant expansion, projected to continue throughout the forecast period (2025-2033). Key drivers include the rising demand for quality control and inspection in manufacturing, particularly within sectors like automotive, electronics, and pharmaceuticals. The integration of machine vision systems into smart factories and Industry 4.0 initiatives further fuels this growth. Advancements in artificial intelligence (AI) and deep learning are enhancing the capabilities of these systems, enabling more complex tasks like object recognition and defect detection. The market is segmented by component (hardware and software), product type (PC-based and smart camera-based), and end-user industry, reflecting the diverse applications of machine vision across various sectors. While the initial investment in these systems can be a restraint for some businesses, the long-term return on investment (ROI) through improved efficiency, reduced waste, and enhanced product quality is proving to be a compelling incentive. The geographical distribution of the market reveals strong growth in North America and Asia Pacific, driven by the presence of significant manufacturing hubs and technological advancements.
The competitive landscape is characterized by the presence of both established players and emerging technology companies. Key players like Keyence, Cognex, and Omron are leveraging their experience and expertise to expand their market share, while innovative startups are introducing cutting-edge solutions. The ongoing trend towards miniaturization and the development of more cost-effective systems are democratizing access to machine vision technology, fostering further expansion across a wider range of industries and applications. The continued integration of AI and the rise of sophisticated 3D vision systems will be pivotal in shaping the future of this dynamic market, further enhancing its capabilities and expanding its applications across various industries, driving continued growth in the coming years. The increasing adoption of robotics and automation in diverse sectors will further fuel the demand for these systems.
2D and 3D Machine Vision Systems Market Report: 2019-2033
This comprehensive report provides a detailed analysis of the 2D and 3D machine vision systems market, covering the period from 2019 to 2033. It offers actionable insights into market dynamics, growth drivers, key players, and emerging trends, enabling stakeholders to make informed strategic decisions. The report incorporates detailed analysis of the market size (in Millions USD), Compound Annual Growth Rate (CAGR), and market segmentation across various components, products, and end-user industries. The base year for this analysis is 2025, with estimations for 2025 and forecasts spanning 2025-2033. The historical period covered is 2019-2024.
2D and 3D Machine Vision Systems Industry Market Concentration & Dynamics
The global 2D and 3D machine vision systems market exhibits a moderately concentrated landscape, with several key players holding significant market share. Keyence Corporation, Cognex Corporation, and Omron Corporation are among the leading companies, collectively accounting for an estimated xx% of the market in 2025. However, the presence of numerous smaller, specialized companies indicates a dynamic competitive environment.
Market Dynamics:
- Innovation Ecosystems: Rapid technological advancements, particularly in AI and deep learning, are driving innovation within the industry, leading to more sophisticated and versatile systems.
- Regulatory Frameworks: Industry regulations related to safety and data privacy are influencing system design and implementation, particularly within sensitive sectors like medical devices and pharmaceuticals.
- Substitute Products: While few direct substitutes exist, alternative quality control methods, such as manual inspection, pose a competitive challenge, especially in low-volume applications.
- End-User Trends: Increasing automation across diverse industries, coupled with growing demand for higher precision and efficiency, fuels market growth.
- M&A Activities: The market has witnessed a moderate level of M&A activity in recent years (xx deals between 2019-2024), primarily focused on expanding product portfolios and geographical reach. This trend is expected to continue, consolidating market share among larger players.
2D and 3D Machine Vision Systems Industry Industry Insights & Trends
The global 2D and 3D machine vision systems market is experiencing robust growth, driven by several factors. The market size was valued at $xx Million in 2024 and is projected to reach $xx Million by 2033, exhibiting a CAGR of xx% during the forecast period (2025-2033).
This growth is primarily fueled by the increasing adoption of automation across various industries, particularly automotive, electronics, and pharmaceuticals. Technological advancements, such as the integration of artificial intelligence (AI) and deep learning algorithms, are enhancing the capabilities of machine vision systems, allowing for more complex tasks and improved accuracy. Consumer demand for higher quality and consistency in products is also driving adoption. Furthermore, the declining cost of hardware components and software solutions is making machine vision technology more accessible to a broader range of businesses.
Key Markets & Segments Leading 2D and 3D Machine Vision Systems Industry
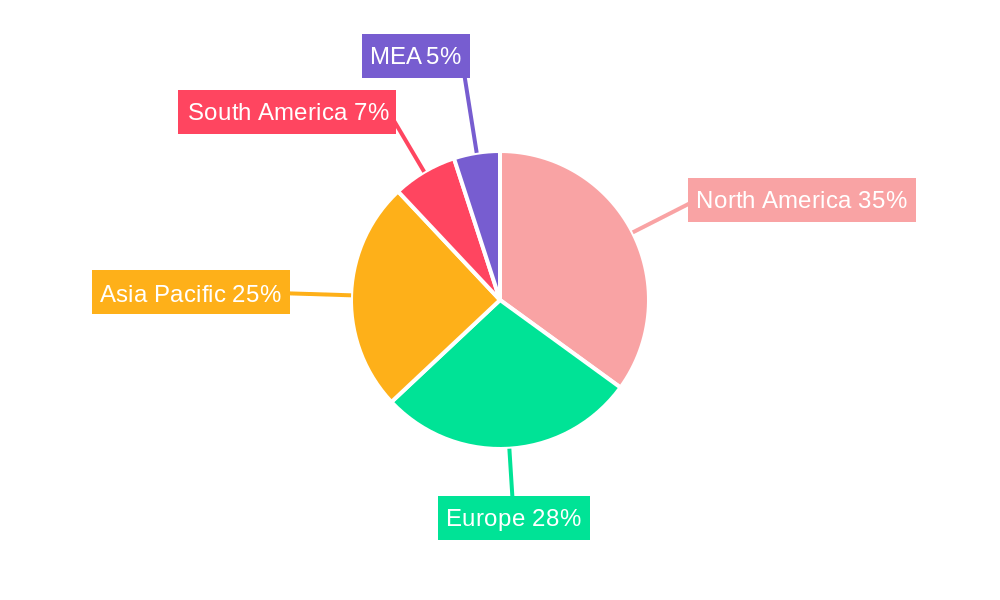
The automotive industry represents the largest end-user segment for 2D and 3D machine vision systems, followed closely by the electronics and semiconductors sector. Geographically, North America and Europe currently dominate the market, driven by high levels of automation and technological advancements. However, Asia-Pacific is experiencing the fastest growth, fueled by rapid industrialization and increasing investment in automation technologies.
Segment Dominance Analysis:
- Hardware: This segment holds the largest market share, driven by the continuous demand for advanced cameras, sensors, and lighting systems.
- Software: The software segment is experiencing rapid growth, propelled by the increasing adoption of AI-powered vision systems requiring sophisticated algorithms.
- PC-based Systems: These systems continue to hold a significant market share due to their flexibility and scalability.
- Smart Camera-based Systems: This segment is witnessing rapid growth due to their ease of use, compact size, and cost-effectiveness.
Key Drivers:
- Economic Growth: Strong economic growth in key regions fuels investment in automation technologies.
- Infrastructure Development: Investments in advanced manufacturing infrastructure support the wider adoption of machine vision systems.
- Technological Advancements: Ongoing innovations in sensor technology, processing power, and AI are expanding the capabilities of machine vision systems.
2D and 3D Machine Vision Systems Industry Product Developments
Recent product developments include the integration of AI and deep learning for improved object recognition and classification, high-resolution 3D imaging technologies for enhanced accuracy, and miniaturized smart cameras for increased flexibility in application deployment. These advancements provide manufacturers with greater accuracy, speed, and efficiency in various applications, ultimately leading to improved product quality and reduced production costs. The development of user-friendly software interfaces is also simplifying the integration and operation of these systems.
Challenges in the 2D and 3D Machine Vision Systems Industry Market
The industry faces challenges such as high initial investment costs, the need for specialized expertise for system integration and maintenance, and potential supply chain disruptions affecting the availability of key components. Furthermore, intense competition among established players and emerging entrants necessitates continuous innovation to maintain a competitive edge. Regulatory compliance requirements also add complexity to the market. These factors collectively impact market growth and profitability.
Forces Driving 2D and 3D Machine Vision Systems Industry Growth
Key growth drivers include the increasing demand for automation in various industries, the continuous development of more advanced and versatile systems, declining hardware and software costs, and supportive government policies promoting automation. The growing need for improved product quality and consistency in various sectors further fuels market expansion.
Challenges in the 2D and 3D Machine Vision Systems Industry Market
Long-term growth catalysts include strategic partnerships between machine vision system providers and end-users to develop customized solutions, expansion into emerging markets with significant growth potential, and continued innovation in areas such as 3D sensing and AI-powered image processing.
Emerging Opportunities in 2D and 3D Machine Vision Systems Industry
Emerging opportunities exist in the integration of machine vision systems with robotics and automation technologies, the expansion into new applications such as augmented reality and virtual reality, and the development of more user-friendly and accessible solutions for small and medium-sized enterprises (SMEs).
Leading Players in the 2D and 3D Machine Vision Systems Industry Sector
- Keyence Corporation
- Baumer Optronic GmbH
- IDS Imaging Development Systems GmbH
- MVTec Software GmbH
- Toshiba Corporation
- National Instruments Corporation
- Cognex Corporation
- Canon USA Inc
- Datalogic S p A
- Omron Corporation
- Sick AG
- ISRA Vision AG
- Allied Vision Technologies Gmb
- Teledyne DALSA
- Adimec Advanced Image Systems B V
- Sony Corporation
Key Milestones in 2D and 3D Machine Vision Systems Industry Industry
- 2020: Increased adoption of AI-powered vision systems across various industries.
- 2021: Several key players launched new high-resolution 3D imaging solutions.
- 2022: Significant increase in M&A activity within the industry.
- 2023: Focus on developing user-friendly software interfaces and cloud-based solutions.
- 2024: Growing integration of machine vision with robotic automation.
Strategic Outlook for 2D and 3D Machine Vision Systems Industry Market
The future of the 2D and 3D machine vision systems market is bright, with substantial growth potential driven by ongoing technological advancements, increasing automation demands, and expansion into new application areas. Strategic opportunities exist for companies focusing on innovation, strategic partnerships, and expanding their geographical reach into emerging markets. The integration of AI and the development of user-friendly solutions will be critical factors in shaping future market leadership.
2D and 3D Machine Vision Systems Industry Segmentation
-
1. Component
-
1.1. Hardware
- 1.1.1. Vision Systems
- 1.1.2. Cameras
- 1.1.3. Optics and Illumination Systems
- 1.1.4. Frame Grabber
- 1.1.5. Other Types of Hardware
- 1.2. Software
-
1.1. Hardware
-
2. Product
- 2.1. PC-based
- 2.2. Smart Camera-based
-
3. End user Industry
- 3.1. Food and Beverage
- 3.2. Medical Devices
- 3.3. Pharmaceutical
- 3.4. Automotive
- 3.5. Electronics and Semiconductors
- 3.6. Other End user Industries
2D and 3D Machine Vision Systems Industry Segmentation By Geography
- 1. North America
- 2. Europe
- 3. Asia Pacific
- 4. Rest of the World
2D and 3D Machine Vision Systems Industry REPORT HIGHLIGHTS
| Aspects | Details |
|---|---|
| Study Period | 2019-2033 |
| Base Year | 2024 |
| Estimated Year | 2025 |
| Forecast Period | 2025-2033 |
| Historical Period | 2019-2024 |
| Growth Rate | CAGR of 13.32% from 2019-2033 |
| Segmentation |
|
Table of Contents
- 1. Introduction
- 1.1. Research Scope
- 1.2. Market Segmentation
- 1.3. Research Methodology
- 1.4. Definitions and Assumptions
- 2. Executive Summary
- 2.1. Introduction
- 3. Market Dynamics
- 3.1. Introduction
- 3.2. Market Drivers
- 3.2.1. ; Increasing Need for Quality inspection and Automation; Growing Application of the Internet of Things in the Industrial Sector
- 3.3. Market Restrains
- 3.3.1. ; Lack of Efficient System Operators due to Inadequate Training to Hamper the Growth
- 3.4. Market Trends
- 3.4.1. Food and Beverages is Expected to Register a Significant Growth
- 4. Market Factor Analysis
- 4.1. Porters Five Forces
- 4.2. Supply/Value Chain
- 4.3. PESTEL analysis
- 4.4. Market Entropy
- 4.5. Patent/Trademark Analysis
- 5. Global 2D and 3D Machine Vision Systems Industry Analysis, Insights and Forecast, 2019-2031
- 5.1. Market Analysis, Insights and Forecast - by Component
- 5.1.1. Hardware
- 5.1.1.1. Vision Systems
- 5.1.1.2. Cameras
- 5.1.1.3. Optics and Illumination Systems
- 5.1.1.4. Frame Grabber
- 5.1.1.5. Other Types of Hardware
- 5.1.2. Software
- 5.1.1. Hardware
- 5.2. Market Analysis, Insights and Forecast - by Product
- 5.2.1. PC-based
- 5.2.2. Smart Camera-based
- 5.3. Market Analysis, Insights and Forecast - by End user Industry
- 5.3.1. Food and Beverage
- 5.3.2. Medical Devices
- 5.3.3. Pharmaceutical
- 5.3.4. Automotive
- 5.3.5. Electronics and Semiconductors
- 5.3.6. Other End user Industries
- 5.4. Market Analysis, Insights and Forecast - by Region
- 5.4.1. North America
- 5.4.2. Europe
- 5.4.3. Asia Pacific
- 5.4.4. Rest of the World
- 5.1. Market Analysis, Insights and Forecast - by Component
- 6. North America 2D and 3D Machine Vision Systems Industry Analysis, Insights and Forecast, 2019-2031
- 6.1. Market Analysis, Insights and Forecast - by Component
- 6.1.1. Hardware
- 6.1.1.1. Vision Systems
- 6.1.1.2. Cameras
- 6.1.1.3. Optics and Illumination Systems
- 6.1.1.4. Frame Grabber
- 6.1.1.5. Other Types of Hardware
- 6.1.2. Software
- 6.1.1. Hardware
- 6.2. Market Analysis, Insights and Forecast - by Product
- 6.2.1. PC-based
- 6.2.2. Smart Camera-based
- 6.3. Market Analysis, Insights and Forecast - by End user Industry
- 6.3.1. Food and Beverage
- 6.3.2. Medical Devices
- 6.3.3. Pharmaceutical
- 6.3.4. Automotive
- 6.3.5. Electronics and Semiconductors
- 6.3.6. Other End user Industries
- 6.1. Market Analysis, Insights and Forecast - by Component
- 7. Europe 2D and 3D Machine Vision Systems Industry Analysis, Insights and Forecast, 2019-2031
- 7.1. Market Analysis, Insights and Forecast - by Component
- 7.1.1. Hardware
- 7.1.1.1. Vision Systems
- 7.1.1.2. Cameras
- 7.1.1.3. Optics and Illumination Systems
- 7.1.1.4. Frame Grabber
- 7.1.1.5. Other Types of Hardware
- 7.1.2. Software
- 7.1.1. Hardware
- 7.2. Market Analysis, Insights and Forecast - by Product
- 7.2.1. PC-based
- 7.2.2. Smart Camera-based
- 7.3. Market Analysis, Insights and Forecast - by End user Industry
- 7.3.1. Food and Beverage
- 7.3.2. Medical Devices
- 7.3.3. Pharmaceutical
- 7.3.4. Automotive
- 7.3.5. Electronics and Semiconductors
- 7.3.6. Other End user Industries
- 7.1. Market Analysis, Insights and Forecast - by Component
- 8. Asia Pacific 2D and 3D Machine Vision Systems Industry Analysis, Insights and Forecast, 2019-2031
- 8.1. Market Analysis, Insights and Forecast - by Component
- 8.1.1. Hardware
- 8.1.1.1. Vision Systems
- 8.1.1.2. Cameras
- 8.1.1.3. Optics and Illumination Systems
- 8.1.1.4. Frame Grabber
- 8.1.1.5. Other Types of Hardware
- 8.1.2. Software
- 8.1.1. Hardware
- 8.2. Market Analysis, Insights and Forecast - by Product
- 8.2.1. PC-based
- 8.2.2. Smart Camera-based
- 8.3. Market Analysis, Insights and Forecast - by End user Industry
- 8.3.1. Food and Beverage
- 8.3.2. Medical Devices
- 8.3.3. Pharmaceutical
- 8.3.4. Automotive
- 8.3.5. Electronics and Semiconductors
- 8.3.6. Other End user Industries
- 8.1. Market Analysis, Insights and Forecast - by Component
- 9. Rest of the World 2D and 3D Machine Vision Systems Industry Analysis, Insights and Forecast, 2019-2031
- 9.1. Market Analysis, Insights and Forecast - by Component
- 9.1.1. Hardware
- 9.1.1.1. Vision Systems
- 9.1.1.2. Cameras
- 9.1.1.3. Optics and Illumination Systems
- 9.1.1.4. Frame Grabber
- 9.1.1.5. Other Types of Hardware
- 9.1.2. Software
- 9.1.1. Hardware
- 9.2. Market Analysis, Insights and Forecast - by Product
- 9.2.1. PC-based
- 9.2.2. Smart Camera-based
- 9.3. Market Analysis, Insights and Forecast - by End user Industry
- 9.3.1. Food and Beverage
- 9.3.2. Medical Devices
- 9.3.3. Pharmaceutical
- 9.3.4. Automotive
- 9.3.5. Electronics and Semiconductors
- 9.3.6. Other End user Industries
- 9.1. Market Analysis, Insights and Forecast - by Component
- 10. North America 2D and 3D Machine Vision Systems Industry Analysis, Insights and Forecast, 2019-2031
- 10.1. Market Analysis, Insights and Forecast - By Country/Sub-region
- 10.1.1 United States
- 10.1.2 Canada
- 10.1.3 Mexico
- 11. Europe 2D and 3D Machine Vision Systems Industry Analysis, Insights and Forecast, 2019-2031
- 11.1. Market Analysis, Insights and Forecast - By Country/Sub-region
- 11.1.1 Germany
- 11.1.2 United Kingdom
- 11.1.3 France
- 11.1.4 Spain
- 11.1.5 Italy
- 11.1.6 Spain
- 11.1.7 Belgium
- 11.1.8 Netherland
- 11.1.9 Nordics
- 11.1.10 Rest of Europe
- 12. Asia Pacific 2D and 3D Machine Vision Systems Industry Analysis, Insights and Forecast, 2019-2031
- 12.1. Market Analysis, Insights and Forecast - By Country/Sub-region
- 12.1.1 China
- 12.1.2 Japan
- 12.1.3 India
- 12.1.4 South Korea
- 12.1.5 Southeast Asia
- 12.1.6 Australia
- 12.1.7 Indonesia
- 12.1.8 Phillipes
- 12.1.9 Singapore
- 12.1.10 Thailandc
- 12.1.11 Rest of Asia Pacific
- 13. South America 2D and 3D Machine Vision Systems Industry Analysis, Insights and Forecast, 2019-2031
- 13.1. Market Analysis, Insights and Forecast - By Country/Sub-region
- 13.1.1 Brazil
- 13.1.2 Argentina
- 13.1.3 Peru
- 13.1.4 Chile
- 13.1.5 Colombia
- 13.1.6 Ecuador
- 13.1.7 Venezuela
- 13.1.8 Rest of South America
- 14. North America 2D and 3D Machine Vision Systems Industry Analysis, Insights and Forecast, 2019-2031
- 14.1. Market Analysis, Insights and Forecast - By Country/Sub-region
- 14.1.1 United States
- 14.1.2 Canada
- 14.1.3 Mexico
- 15. MEA 2D and 3D Machine Vision Systems Industry Analysis, Insights and Forecast, 2019-2031
- 15.1. Market Analysis, Insights and Forecast - By Country/Sub-region
- 15.1.1 United Arab Emirates
- 15.1.2 Saudi Arabia
- 15.1.3 South Africa
- 15.1.4 Rest of Middle East and Africa
- 16. Competitive Analysis
- 16.1. Global Market Share Analysis 2024
- 16.2. Company Profiles
- 16.2.1 Keyence Corporation
- 16.2.1.1. Overview
- 16.2.1.2. Products
- 16.2.1.3. SWOT Analysis
- 16.2.1.4. Recent Developments
- 16.2.1.5. Financials (Based on Availability)
- 16.2.2 Baumer Optronic GmbH
- 16.2.2.1. Overview
- 16.2.2.2. Products
- 16.2.2.3. SWOT Analysis
- 16.2.2.4. Recent Developments
- 16.2.2.5. Financials (Based on Availability)
- 16.2.3 IDS Imaging Development Systems GmbH
- 16.2.3.1. Overview
- 16.2.3.2. Products
- 16.2.3.3. SWOT Analysis
- 16.2.3.4. Recent Developments
- 16.2.3.5. Financials (Based on Availability)
- 16.2.4 MVTec Software GmbH
- 16.2.4.1. Overview
- 16.2.4.2. Products
- 16.2.4.3. SWOT Analysis
- 16.2.4.4. Recent Developments
- 16.2.4.5. Financials (Based on Availability)
- 16.2.5 Toshiba Corporation
- 16.2.5.1. Overview
- 16.2.5.2. Products
- 16.2.5.3. SWOT Analysis
- 16.2.5.4. Recent Developments
- 16.2.5.5. Financials (Based on Availability)
- 16.2.6 National Instruments Corporation
- 16.2.6.1. Overview
- 16.2.6.2. Products
- 16.2.6.3. SWOT Analysis
- 16.2.6.4. Recent Developments
- 16.2.6.5. Financials (Based on Availability)
- 16.2.7 Cognex Corporation
- 16.2.7.1. Overview
- 16.2.7.2. Products
- 16.2.7.3. SWOT Analysis
- 16.2.7.4. Recent Developments
- 16.2.7.5. Financials (Based on Availability)
- 16.2.8 Canon USA Inc
- 16.2.8.1. Overview
- 16.2.8.2. Products
- 16.2.8.3. SWOT Analysis
- 16.2.8.4. Recent Developments
- 16.2.8.5. Financials (Based on Availability)
- 16.2.9 Datalogic S p A
- 16.2.9.1. Overview
- 16.2.9.2. Products
- 16.2.9.3. SWOT Analysis
- 16.2.9.4. Recent Developments
- 16.2.9.5. Financials (Based on Availability)
- 16.2.10 Omron Corporation
- 16.2.10.1. Overview
- 16.2.10.2. Products
- 16.2.10.3. SWOT Analysis
- 16.2.10.4. Recent Developments
- 16.2.10.5. Financials (Based on Availability)
- 16.2.11 Sick AG
- 16.2.11.1. Overview
- 16.2.11.2. Products
- 16.2.11.3. SWOT Analysis
- 16.2.11.4. Recent Developments
- 16.2.11.5. Financials (Based on Availability)
- 16.2.12 ISRA Vision AG
- 16.2.12.1. Overview
- 16.2.12.2. Products
- 16.2.12.3. SWOT Analysis
- 16.2.12.4. Recent Developments
- 16.2.12.5. Financials (Based on Availability)
- 16.2.13 Allied Vision Technologies Gmb
- 16.2.13.1. Overview
- 16.2.13.2. Products
- 16.2.13.3. SWOT Analysis
- 16.2.13.4. Recent Developments
- 16.2.13.5. Financials (Based on Availability)
- 16.2.14 Teledyne DALSA
- 16.2.14.1. Overview
- 16.2.14.2. Products
- 16.2.14.3. SWOT Analysis
- 16.2.14.4. Recent Developments
- 16.2.14.5. Financials (Based on Availability)
- 16.2.15 Adimec Advanced Image Systems B V
- 16.2.15.1. Overview
- 16.2.15.2. Products
- 16.2.15.3. SWOT Analysis
- 16.2.15.4. Recent Developments
- 16.2.15.5. Financials (Based on Availability)
- 16.2.16 Sony Corporation
- 16.2.16.1. Overview
- 16.2.16.2. Products
- 16.2.16.3. SWOT Analysis
- 16.2.16.4. Recent Developments
- 16.2.16.5. Financials (Based on Availability)
- 16.2.1 Keyence Corporation
List of Figures
- Figure 1: Global 2D and 3D Machine Vision Systems Industry Revenue Breakdown (Million, %) by Region 2024 & 2032
- Figure 2: Global 2D and 3D Machine Vision Systems Industry Volume Breakdown (K Unit, %) by Region 2024 & 2032
- Figure 3: North America 2D and 3D Machine Vision Systems Industry Revenue (Million), by Country 2024 & 2032
- Figure 4: North America 2D and 3D Machine Vision Systems Industry Volume (K Unit), by Country 2024 & 2032
- Figure 5: North America 2D and 3D Machine Vision Systems Industry Revenue Share (%), by Country 2024 & 2032
- Figure 6: North America 2D and 3D Machine Vision Systems Industry Volume Share (%), by Country 2024 & 2032
- Figure 7: Europe 2D and 3D Machine Vision Systems Industry Revenue (Million), by Country 2024 & 2032
- Figure 8: Europe 2D and 3D Machine Vision Systems Industry Volume (K Unit), by Country 2024 & 2032
- Figure 9: Europe 2D and 3D Machine Vision Systems Industry Revenue Share (%), by Country 2024 & 2032
- Figure 10: Europe 2D and 3D Machine Vision Systems Industry Volume Share (%), by Country 2024 & 2032
- Figure 11: Asia Pacific 2D and 3D Machine Vision Systems Industry Revenue (Million), by Country 2024 & 2032
- Figure 12: Asia Pacific 2D and 3D Machine Vision Systems Industry Volume (K Unit), by Country 2024 & 2032
- Figure 13: Asia Pacific 2D and 3D Machine Vision Systems Industry Revenue Share (%), by Country 2024 & 2032
- Figure 14: Asia Pacific 2D and 3D Machine Vision Systems Industry Volume Share (%), by Country 2024 & 2032
- Figure 15: South America 2D and 3D Machine Vision Systems Industry Revenue (Million), by Country 2024 & 2032
- Figure 16: South America 2D and 3D Machine Vision Systems Industry Volume (K Unit), by Country 2024 & 2032
- Figure 17: South America 2D and 3D Machine Vision Systems Industry Revenue Share (%), by Country 2024 & 2032
- Figure 18: South America 2D and 3D Machine Vision Systems Industry Volume Share (%), by Country 2024 & 2032
- Figure 19: North America 2D and 3D Machine Vision Systems Industry Revenue (Million), by Country 2024 & 2032
- Figure 20: North America 2D and 3D Machine Vision Systems Industry Volume (K Unit), by Country 2024 & 2032
- Figure 21: North America 2D and 3D Machine Vision Systems Industry Revenue Share (%), by Country 2024 & 2032
- Figure 22: North America 2D and 3D Machine Vision Systems Industry Volume Share (%), by Country 2024 & 2032
- Figure 23: MEA 2D and 3D Machine Vision Systems Industry Revenue (Million), by Country 2024 & 2032
- Figure 24: MEA 2D and 3D Machine Vision Systems Industry Volume (K Unit), by Country 2024 & 2032
- Figure 25: MEA 2D and 3D Machine Vision Systems Industry Revenue Share (%), by Country 2024 & 2032
- Figure 26: MEA 2D and 3D Machine Vision Systems Industry Volume Share (%), by Country 2024 & 2032
- Figure 27: North America 2D and 3D Machine Vision Systems Industry Revenue (Million), by Component 2024 & 2032
- Figure 28: North America 2D and 3D Machine Vision Systems Industry Volume (K Unit), by Component 2024 & 2032
- Figure 29: North America 2D and 3D Machine Vision Systems Industry Revenue Share (%), by Component 2024 & 2032
- Figure 30: North America 2D and 3D Machine Vision Systems Industry Volume Share (%), by Component 2024 & 2032
- Figure 31: North America 2D and 3D Machine Vision Systems Industry Revenue (Million), by Product 2024 & 2032
- Figure 32: North America 2D and 3D Machine Vision Systems Industry Volume (K Unit), by Product 2024 & 2032
- Figure 33: North America 2D and 3D Machine Vision Systems Industry Revenue Share (%), by Product 2024 & 2032
- Figure 34: North America 2D and 3D Machine Vision Systems Industry Volume Share (%), by Product 2024 & 2032
- Figure 35: North America 2D and 3D Machine Vision Systems Industry Revenue (Million), by End user Industry 2024 & 2032
- Figure 36: North America 2D and 3D Machine Vision Systems Industry Volume (K Unit), by End user Industry 2024 & 2032
- Figure 37: North America 2D and 3D Machine Vision Systems Industry Revenue Share (%), by End user Industry 2024 & 2032
- Figure 38: North America 2D and 3D Machine Vision Systems Industry Volume Share (%), by End user Industry 2024 & 2032
- Figure 39: North America 2D and 3D Machine Vision Systems Industry Revenue (Million), by Country 2024 & 2032
- Figure 40: North America 2D and 3D Machine Vision Systems Industry Volume (K Unit), by Country 2024 & 2032
- Figure 41: North America 2D and 3D Machine Vision Systems Industry Revenue Share (%), by Country 2024 & 2032
- Figure 42: North America 2D and 3D Machine Vision Systems Industry Volume Share (%), by Country 2024 & 2032
- Figure 43: Europe 2D and 3D Machine Vision Systems Industry Revenue (Million), by Component 2024 & 2032
- Figure 44: Europe 2D and 3D Machine Vision Systems Industry Volume (K Unit), by Component 2024 & 2032
- Figure 45: Europe 2D and 3D Machine Vision Systems Industry Revenue Share (%), by Component 2024 & 2032
- Figure 46: Europe 2D and 3D Machine Vision Systems Industry Volume Share (%), by Component 2024 & 2032
- Figure 47: Europe 2D and 3D Machine Vision Systems Industry Revenue (Million), by Product 2024 & 2032
- Figure 48: Europe 2D and 3D Machine Vision Systems Industry Volume (K Unit), by Product 2024 & 2032
- Figure 49: Europe 2D and 3D Machine Vision Systems Industry Revenue Share (%), by Product 2024 & 2032
- Figure 50: Europe 2D and 3D Machine Vision Systems Industry Volume Share (%), by Product 2024 & 2032
- Figure 51: Europe 2D and 3D Machine Vision Systems Industry Revenue (Million), by End user Industry 2024 & 2032
- Figure 52: Europe 2D and 3D Machine Vision Systems Industry Volume (K Unit), by End user Industry 2024 & 2032
- Figure 53: Europe 2D and 3D Machine Vision Systems Industry Revenue Share (%), by End user Industry 2024 & 2032
- Figure 54: Europe 2D and 3D Machine Vision Systems Industry Volume Share (%), by End user Industry 2024 & 2032
- Figure 55: Europe 2D and 3D Machine Vision Systems Industry Revenue (Million), by Country 2024 & 2032
- Figure 56: Europe 2D and 3D Machine Vision Systems Industry Volume (K Unit), by Country 2024 & 2032
- Figure 57: Europe 2D and 3D Machine Vision Systems Industry Revenue Share (%), by Country 2024 & 2032
- Figure 58: Europe 2D and 3D Machine Vision Systems Industry Volume Share (%), by Country 2024 & 2032
- Figure 59: Asia Pacific 2D and 3D Machine Vision Systems Industry Revenue (Million), by Component 2024 & 2032
- Figure 60: Asia Pacific 2D and 3D Machine Vision Systems Industry Volume (K Unit), by Component 2024 & 2032
- Figure 61: Asia Pacific 2D and 3D Machine Vision Systems Industry Revenue Share (%), by Component 2024 & 2032
- Figure 62: Asia Pacific 2D and 3D Machine Vision Systems Industry Volume Share (%), by Component 2024 & 2032
- Figure 63: Asia Pacific 2D and 3D Machine Vision Systems Industry Revenue (Million), by Product 2024 & 2032
- Figure 64: Asia Pacific 2D and 3D Machine Vision Systems Industry Volume (K Unit), by Product 2024 & 2032
- Figure 65: Asia Pacific 2D and 3D Machine Vision Systems Industry Revenue Share (%), by Product 2024 & 2032
- Figure 66: Asia Pacific 2D and 3D Machine Vision Systems Industry Volume Share (%), by Product 2024 & 2032
- Figure 67: Asia Pacific 2D and 3D Machine Vision Systems Industry Revenue (Million), by End user Industry 2024 & 2032
- Figure 68: Asia Pacific 2D and 3D Machine Vision Systems Industry Volume (K Unit), by End user Industry 2024 & 2032
- Figure 69: Asia Pacific 2D and 3D Machine Vision Systems Industry Revenue Share (%), by End user Industry 2024 & 2032
- Figure 70: Asia Pacific 2D and 3D Machine Vision Systems Industry Volume Share (%), by End user Industry 2024 & 2032
- Figure 71: Asia Pacific 2D and 3D Machine Vision Systems Industry Revenue (Million), by Country 2024 & 2032
- Figure 72: Asia Pacific 2D and 3D Machine Vision Systems Industry Volume (K Unit), by Country 2024 & 2032
- Figure 73: Asia Pacific 2D and 3D Machine Vision Systems Industry Revenue Share (%), by Country 2024 & 2032
- Figure 74: Asia Pacific 2D and 3D Machine Vision Systems Industry Volume Share (%), by Country 2024 & 2032
- Figure 75: Rest of the World 2D and 3D Machine Vision Systems Industry Revenue (Million), by Component 2024 & 2032
- Figure 76: Rest of the World 2D and 3D Machine Vision Systems Industry Volume (K Unit), by Component 2024 & 2032
- Figure 77: Rest of the World 2D and 3D Machine Vision Systems Industry Revenue Share (%), by Component 2024 & 2032
- Figure 78: Rest of the World 2D and 3D Machine Vision Systems Industry Volume Share (%), by Component 2024 & 2032
- Figure 79: Rest of the World 2D and 3D Machine Vision Systems Industry Revenue (Million), by Product 2024 & 2032
- Figure 80: Rest of the World 2D and 3D Machine Vision Systems Industry Volume (K Unit), by Product 2024 & 2032
- Figure 81: Rest of the World 2D and 3D Machine Vision Systems Industry Revenue Share (%), by Product 2024 & 2032
- Figure 82: Rest of the World 2D and 3D Machine Vision Systems Industry Volume Share (%), by Product 2024 & 2032
- Figure 83: Rest of the World 2D and 3D Machine Vision Systems Industry Revenue (Million), by End user Industry 2024 & 2032
- Figure 84: Rest of the World 2D and 3D Machine Vision Systems Industry Volume (K Unit), by End user Industry 2024 & 2032
- Figure 85: Rest of the World 2D and 3D Machine Vision Systems Industry Revenue Share (%), by End user Industry 2024 & 2032
- Figure 86: Rest of the World 2D and 3D Machine Vision Systems Industry Volume Share (%), by End user Industry 2024 & 2032
- Figure 87: Rest of the World 2D and 3D Machine Vision Systems Industry Revenue (Million), by Country 2024 & 2032
- Figure 88: Rest of the World 2D and 3D Machine Vision Systems Industry Volume (K Unit), by Country 2024 & 2032
- Figure 89: Rest of the World 2D and 3D Machine Vision Systems Industry Revenue Share (%), by Country 2024 & 2032
- Figure 90: Rest of the World 2D and 3D Machine Vision Systems Industry Volume Share (%), by Country 2024 & 2032
List of Tables
- Table 1: Global 2D and 3D Machine Vision Systems Industry Revenue Million Forecast, by Region 2019 & 2032
- Table 2: Global 2D and 3D Machine Vision Systems Industry Volume K Unit Forecast, by Region 2019 & 2032
- Table 3: Global 2D and 3D Machine Vision Systems Industry Revenue Million Forecast, by Component 2019 & 2032
- Table 4: Global 2D and 3D Machine Vision Systems Industry Volume K Unit Forecast, by Component 2019 & 2032
- Table 5: Global 2D and 3D Machine Vision Systems Industry Revenue Million Forecast, by Product 2019 & 2032
- Table 6: Global 2D and 3D Machine Vision Systems Industry Volume K Unit Forecast, by Product 2019 & 2032
- Table 7: Global 2D and 3D Machine Vision Systems Industry Revenue Million Forecast, by End user Industry 2019 & 2032
- Table 8: Global 2D and 3D Machine Vision Systems Industry Volume K Unit Forecast, by End user Industry 2019 & 2032
- Table 9: Global 2D and 3D Machine Vision Systems Industry Revenue Million Forecast, by Region 2019 & 2032
- Table 10: Global 2D and 3D Machine Vision Systems Industry Volume K Unit Forecast, by Region 2019 & 2032
- Table 11: Global 2D and 3D Machine Vision Systems Industry Revenue Million Forecast, by Country 2019 & 2032
- Table 12: Global 2D and 3D Machine Vision Systems Industry Volume K Unit Forecast, by Country 2019 & 2032
- Table 13: United States 2D and 3D Machine Vision Systems Industry Revenue (Million) Forecast, by Application 2019 & 2032
- Table 14: United States 2D and 3D Machine Vision Systems Industry Volume (K Unit) Forecast, by Application 2019 & 2032
- Table 15: Canada 2D and 3D Machine Vision Systems Industry Revenue (Million) Forecast, by Application 2019 & 2032
- Table 16: Canada 2D and 3D Machine Vision Systems Industry Volume (K Unit) Forecast, by Application 2019 & 2032
- Table 17: Mexico 2D and 3D Machine Vision Systems Industry Revenue (Million) Forecast, by Application 2019 & 2032
- Table 18: Mexico 2D and 3D Machine Vision Systems Industry Volume (K Unit) Forecast, by Application 2019 & 2032
- Table 19: Global 2D and 3D Machine Vision Systems Industry Revenue Million Forecast, by Country 2019 & 2032
- Table 20: Global 2D and 3D Machine Vision Systems Industry Volume K Unit Forecast, by Country 2019 & 2032
- Table 21: Germany 2D and 3D Machine Vision Systems Industry Revenue (Million) Forecast, by Application 2019 & 2032
- Table 22: Germany 2D and 3D Machine Vision Systems Industry Volume (K Unit) Forecast, by Application 2019 & 2032
- Table 23: United Kingdom 2D and 3D Machine Vision Systems Industry Revenue (Million) Forecast, by Application 2019 & 2032
- Table 24: United Kingdom 2D and 3D Machine Vision Systems Industry Volume (K Unit) Forecast, by Application 2019 & 2032
- Table 25: France 2D and 3D Machine Vision Systems Industry Revenue (Million) Forecast, by Application 2019 & 2032
- Table 26: France 2D and 3D Machine Vision Systems Industry Volume (K Unit) Forecast, by Application 2019 & 2032
- Table 27: Spain 2D and 3D Machine Vision Systems Industry Revenue (Million) Forecast, by Application 2019 & 2032
- Table 28: Spain 2D and 3D Machine Vision Systems Industry Volume (K Unit) Forecast, by Application 2019 & 2032
- Table 29: Italy 2D and 3D Machine Vision Systems Industry Revenue (Million) Forecast, by Application 2019 & 2032
- Table 30: Italy 2D and 3D Machine Vision Systems Industry Volume (K Unit) Forecast, by Application 2019 & 2032
- Table 31: Spain 2D and 3D Machine Vision Systems Industry Revenue (Million) Forecast, by Application 2019 & 2032
- Table 32: Spain 2D and 3D Machine Vision Systems Industry Volume (K Unit) Forecast, by Application 2019 & 2032
- Table 33: Belgium 2D and 3D Machine Vision Systems Industry Revenue (Million) Forecast, by Application 2019 & 2032
- Table 34: Belgium 2D and 3D Machine Vision Systems Industry Volume (K Unit) Forecast, by Application 2019 & 2032
- Table 35: Netherland 2D and 3D Machine Vision Systems Industry Revenue (Million) Forecast, by Application 2019 & 2032
- Table 36: Netherland 2D and 3D Machine Vision Systems Industry Volume (K Unit) Forecast, by Application 2019 & 2032
- Table 37: Nordics 2D and 3D Machine Vision Systems Industry Revenue (Million) Forecast, by Application 2019 & 2032
- Table 38: Nordics 2D and 3D Machine Vision Systems Industry Volume (K Unit) Forecast, by Application 2019 & 2032
- Table 39: Rest of Europe 2D and 3D Machine Vision Systems Industry Revenue (Million) Forecast, by Application 2019 & 2032
- Table 40: Rest of Europe 2D and 3D Machine Vision Systems Industry Volume (K Unit) Forecast, by Application 2019 & 2032
- Table 41: Global 2D and 3D Machine Vision Systems Industry Revenue Million Forecast, by Country 2019 & 2032
- Table 42: Global 2D and 3D Machine Vision Systems Industry Volume K Unit Forecast, by Country 2019 & 2032
- Table 43: China 2D and 3D Machine Vision Systems Industry Revenue (Million) Forecast, by Application 2019 & 2032
- Table 44: China 2D and 3D Machine Vision Systems Industry Volume (K Unit) Forecast, by Application 2019 & 2032
- Table 45: Japan 2D and 3D Machine Vision Systems Industry Revenue (Million) Forecast, by Application 2019 & 2032
- Table 46: Japan 2D and 3D Machine Vision Systems Industry Volume (K Unit) Forecast, by Application 2019 & 2032
- Table 47: India 2D and 3D Machine Vision Systems Industry Revenue (Million) Forecast, by Application 2019 & 2032
- Table 48: India 2D and 3D Machine Vision Systems Industry Volume (K Unit) Forecast, by Application 2019 & 2032
- Table 49: South Korea 2D and 3D Machine Vision Systems Industry Revenue (Million) Forecast, by Application 2019 & 2032
- Table 50: South Korea 2D and 3D Machine Vision Systems Industry Volume (K Unit) Forecast, by Application 2019 & 2032
- Table 51: Southeast Asia 2D and 3D Machine Vision Systems Industry Revenue (Million) Forecast, by Application 2019 & 2032
- Table 52: Southeast Asia 2D and 3D Machine Vision Systems Industry Volume (K Unit) Forecast, by Application 2019 & 2032
- Table 53: Australia 2D and 3D Machine Vision Systems Industry Revenue (Million) Forecast, by Application 2019 & 2032
- Table 54: Australia 2D and 3D Machine Vision Systems Industry Volume (K Unit) Forecast, by Application 2019 & 2032
- Table 55: Indonesia 2D and 3D Machine Vision Systems Industry Revenue (Million) Forecast, by Application 2019 & 2032
- Table 56: Indonesia 2D and 3D Machine Vision Systems Industry Volume (K Unit) Forecast, by Application 2019 & 2032
- Table 57: Phillipes 2D and 3D Machine Vision Systems Industry Revenue (Million) Forecast, by Application 2019 & 2032
- Table 58: Phillipes 2D and 3D Machine Vision Systems Industry Volume (K Unit) Forecast, by Application 2019 & 2032
- Table 59: Singapore 2D and 3D Machine Vision Systems Industry Revenue (Million) Forecast, by Application 2019 & 2032
- Table 60: Singapore 2D and 3D Machine Vision Systems Industry Volume (K Unit) Forecast, by Application 2019 & 2032
- Table 61: Thailandc 2D and 3D Machine Vision Systems Industry Revenue (Million) Forecast, by Application 2019 & 2032
- Table 62: Thailandc 2D and 3D Machine Vision Systems Industry Volume (K Unit) Forecast, by Application 2019 & 2032
- Table 63: Rest of Asia Pacific 2D and 3D Machine Vision Systems Industry Revenue (Million) Forecast, by Application 2019 & 2032
- Table 64: Rest of Asia Pacific 2D and 3D Machine Vision Systems Industry Volume (K Unit) Forecast, by Application 2019 & 2032
- Table 65: Global 2D and 3D Machine Vision Systems Industry Revenue Million Forecast, by Country 2019 & 2032
- Table 66: Global 2D and 3D Machine Vision Systems Industry Volume K Unit Forecast, by Country 2019 & 2032
- Table 67: Brazil 2D and 3D Machine Vision Systems Industry Revenue (Million) Forecast, by Application 2019 & 2032
- Table 68: Brazil 2D and 3D Machine Vision Systems Industry Volume (K Unit) Forecast, by Application 2019 & 2032
- Table 69: Argentina 2D and 3D Machine Vision Systems Industry Revenue (Million) Forecast, by Application 2019 & 2032
- Table 70: Argentina 2D and 3D Machine Vision Systems Industry Volume (K Unit) Forecast, by Application 2019 & 2032
- Table 71: Peru 2D and 3D Machine Vision Systems Industry Revenue (Million) Forecast, by Application 2019 & 2032
- Table 72: Peru 2D and 3D Machine Vision Systems Industry Volume (K Unit) Forecast, by Application 2019 & 2032
- Table 73: Chile 2D and 3D Machine Vision Systems Industry Revenue (Million) Forecast, by Application 2019 & 2032
- Table 74: Chile 2D and 3D Machine Vision Systems Industry Volume (K Unit) Forecast, by Application 2019 & 2032
- Table 75: Colombia 2D and 3D Machine Vision Systems Industry Revenue (Million) Forecast, by Application 2019 & 2032
- Table 76: Colombia 2D and 3D Machine Vision Systems Industry Volume (K Unit) Forecast, by Application 2019 & 2032
- Table 77: Ecuador 2D and 3D Machine Vision Systems Industry Revenue (Million) Forecast, by Application 2019 & 2032
- Table 78: Ecuador 2D and 3D Machine Vision Systems Industry Volume (K Unit) Forecast, by Application 2019 & 2032
- Table 79: Venezuela 2D and 3D Machine Vision Systems Industry Revenue (Million) Forecast, by Application 2019 & 2032
- Table 80: Venezuela 2D and 3D Machine Vision Systems Industry Volume (K Unit) Forecast, by Application 2019 & 2032
- Table 81: Rest of South America 2D and 3D Machine Vision Systems Industry Revenue (Million) Forecast, by Application 2019 & 2032
- Table 82: Rest of South America 2D and 3D Machine Vision Systems Industry Volume (K Unit) Forecast, by Application 2019 & 2032
- Table 83: Global 2D and 3D Machine Vision Systems Industry Revenue Million Forecast, by Country 2019 & 2032
- Table 84: Global 2D and 3D Machine Vision Systems Industry Volume K Unit Forecast, by Country 2019 & 2032
- Table 85: United States 2D and 3D Machine Vision Systems Industry Revenue (Million) Forecast, by Application 2019 & 2032
- Table 86: United States 2D and 3D Machine Vision Systems Industry Volume (K Unit) Forecast, by Application 2019 & 2032
- Table 87: Canada 2D and 3D Machine Vision Systems Industry Revenue (Million) Forecast, by Application 2019 & 2032
- Table 88: Canada 2D and 3D Machine Vision Systems Industry Volume (K Unit) Forecast, by Application 2019 & 2032
- Table 89: Mexico 2D and 3D Machine Vision Systems Industry Revenue (Million) Forecast, by Application 2019 & 2032
- Table 90: Mexico 2D and 3D Machine Vision Systems Industry Volume (K Unit) Forecast, by Application 2019 & 2032
- Table 91: Global 2D and 3D Machine Vision Systems Industry Revenue Million Forecast, by Country 2019 & 2032
- Table 92: Global 2D and 3D Machine Vision Systems Industry Volume K Unit Forecast, by Country 2019 & 2032
- Table 93: United Arab Emirates 2D and 3D Machine Vision Systems Industry Revenue (Million) Forecast, by Application 2019 & 2032
- Table 94: United Arab Emirates 2D and 3D Machine Vision Systems Industry Volume (K Unit) Forecast, by Application 2019 & 2032
- Table 95: Saudi Arabia 2D and 3D Machine Vision Systems Industry Revenue (Million) Forecast, by Application 2019 & 2032
- Table 96: Saudi Arabia 2D and 3D Machine Vision Systems Industry Volume (K Unit) Forecast, by Application 2019 & 2032
- Table 97: South Africa 2D and 3D Machine Vision Systems Industry Revenue (Million) Forecast, by Application 2019 & 2032
- Table 98: South Africa 2D and 3D Machine Vision Systems Industry Volume (K Unit) Forecast, by Application 2019 & 2032
- Table 99: Rest of Middle East and Africa 2D and 3D Machine Vision Systems Industry Revenue (Million) Forecast, by Application 2019 & 2032
- Table 100: Rest of Middle East and Africa 2D and 3D Machine Vision Systems Industry Volume (K Unit) Forecast, by Application 2019 & 2032
- Table 101: Global 2D and 3D Machine Vision Systems Industry Revenue Million Forecast, by Component 2019 & 2032
- Table 102: Global 2D and 3D Machine Vision Systems Industry Volume K Unit Forecast, by Component 2019 & 2032
- Table 103: Global 2D and 3D Machine Vision Systems Industry Revenue Million Forecast, by Product 2019 & 2032
- Table 104: Global 2D and 3D Machine Vision Systems Industry Volume K Unit Forecast, by Product 2019 & 2032
- Table 105: Global 2D and 3D Machine Vision Systems Industry Revenue Million Forecast, by End user Industry 2019 & 2032
- Table 106: Global 2D and 3D Machine Vision Systems Industry Volume K Unit Forecast, by End user Industry 2019 & 2032
- Table 107: Global 2D and 3D Machine Vision Systems Industry Revenue Million Forecast, by Country 2019 & 2032
- Table 108: Global 2D and 3D Machine Vision Systems Industry Volume K Unit Forecast, by Country 2019 & 2032
- Table 109: Global 2D and 3D Machine Vision Systems Industry Revenue Million Forecast, by Component 2019 & 2032
- Table 110: Global 2D and 3D Machine Vision Systems Industry Volume K Unit Forecast, by Component 2019 & 2032
- Table 111: Global 2D and 3D Machine Vision Systems Industry Revenue Million Forecast, by Product 2019 & 2032
- Table 112: Global 2D and 3D Machine Vision Systems Industry Volume K Unit Forecast, by Product 2019 & 2032
- Table 113: Global 2D and 3D Machine Vision Systems Industry Revenue Million Forecast, by End user Industry 2019 & 2032
- Table 114: Global 2D and 3D Machine Vision Systems Industry Volume K Unit Forecast, by End user Industry 2019 & 2032
- Table 115: Global 2D and 3D Machine Vision Systems Industry Revenue Million Forecast, by Country 2019 & 2032
- Table 116: Global 2D and 3D Machine Vision Systems Industry Volume K Unit Forecast, by Country 2019 & 2032
- Table 117: Global 2D and 3D Machine Vision Systems Industry Revenue Million Forecast, by Component 2019 & 2032
- Table 118: Global 2D and 3D Machine Vision Systems Industry Volume K Unit Forecast, by Component 2019 & 2032
- Table 119: Global 2D and 3D Machine Vision Systems Industry Revenue Million Forecast, by Product 2019 & 2032
- Table 120: Global 2D and 3D Machine Vision Systems Industry Volume K Unit Forecast, by Product 2019 & 2032
- Table 121: Global 2D and 3D Machine Vision Systems Industry Revenue Million Forecast, by End user Industry 2019 & 2032
- Table 122: Global 2D and 3D Machine Vision Systems Industry Volume K Unit Forecast, by End user Industry 2019 & 2032
- Table 123: Global 2D and 3D Machine Vision Systems Industry Revenue Million Forecast, by Country 2019 & 2032
- Table 124: Global 2D and 3D Machine Vision Systems Industry Volume K Unit Forecast, by Country 2019 & 2032
- Table 125: Global 2D and 3D Machine Vision Systems Industry Revenue Million Forecast, by Component 2019 & 2032
- Table 126: Global 2D and 3D Machine Vision Systems Industry Volume K Unit Forecast, by Component 2019 & 2032
- Table 127: Global 2D and 3D Machine Vision Systems Industry Revenue Million Forecast, by Product 2019 & 2032
- Table 128: Global 2D and 3D Machine Vision Systems Industry Volume K Unit Forecast, by Product 2019 & 2032
- Table 129: Global 2D and 3D Machine Vision Systems Industry Revenue Million Forecast, by End user Industry 2019 & 2032
- Table 130: Global 2D and 3D Machine Vision Systems Industry Volume K Unit Forecast, by End user Industry 2019 & 2032
- Table 131: Global 2D and 3D Machine Vision Systems Industry Revenue Million Forecast, by Country 2019 & 2032
- Table 132: Global 2D and 3D Machine Vision Systems Industry Volume K Unit Forecast, by Country 2019 & 2032
Frequently Asked Questions
1. What is the projected Compound Annual Growth Rate (CAGR) of the 2D and 3D Machine Vision Systems Industry?
The projected CAGR is approximately 13.32%.
2. Which companies are prominent players in the 2D and 3D Machine Vision Systems Industry?
Key companies in the market include Keyence Corporation, Baumer Optronic GmbH, IDS Imaging Development Systems GmbH, MVTec Software GmbH, Toshiba Corporation, National Instruments Corporation, Cognex Corporation, Canon USA Inc, Datalogic S p A, Omron Corporation, Sick AG, ISRA Vision AG, Allied Vision Technologies Gmb, Teledyne DALSA, Adimec Advanced Image Systems B V, Sony Corporation.
3. What are the main segments of the 2D and 3D Machine Vision Systems Industry?
The market segments include Component, Product, End user Industry.
4. Can you provide details about the market size?
The market size is estimated to be USD XX Million as of 2022.
5. What are some drivers contributing to market growth?
; Increasing Need for Quality inspection and Automation; Growing Application of the Internet of Things in the Industrial Sector.
6. What are the notable trends driving market growth?
Food and Beverages is Expected to Register a Significant Growth.
7. Are there any restraints impacting market growth?
; Lack of Efficient System Operators due to Inadequate Training to Hamper the Growth.
8. Can you provide examples of recent developments in the market?
N/A
9. What pricing options are available for accessing the report?
Pricing options include single-user, multi-user, and enterprise licenses priced at USD 4750, USD 5250, and USD 8750 respectively.
10. Is the market size provided in terms of value or volume?
The market size is provided in terms of value, measured in Million and volume, measured in K Unit.
11. Are there any specific market keywords associated with the report?
Yes, the market keyword associated with the report is "2D and 3D Machine Vision Systems Industry," which aids in identifying and referencing the specific market segment covered.
12. How do I determine which pricing option suits my needs best?
The pricing options vary based on user requirements and access needs. Individual users may opt for single-user licenses, while businesses requiring broader access may choose multi-user or enterprise licenses for cost-effective access to the report.
13. Are there any additional resources or data provided in the 2D and 3D Machine Vision Systems Industry report?
While the report offers comprehensive insights, it's advisable to review the specific contents or supplementary materials provided to ascertain if additional resources or data are available.
14. How can I stay updated on further developments or reports in the 2D and 3D Machine Vision Systems Industry?
To stay informed about further developments, trends, and reports in the 2D and 3D Machine Vision Systems Industry, consider subscribing to industry newsletters, following relevant companies and organizations, or regularly checking reputable industry news sources and publications.
Methodology
Step 1 - Identification of Relevant Samples Size from Population Database


Step 2 - Approaches for Defining Global Market Size (Value, Volume* & Price*)

Note*: In applicable scenarios
Step 3 - Data Sources
Primary Research
- Web Analytics
- Survey Reports
- Research Institute
- Latest Research Reports
- Opinion Leaders
Secondary Research
- Annual Reports
- White Paper
- Latest Press Release
- Industry Association
- Paid Database
- Investor Presentations

Step 4 - Data Triangulation
Involves using different sources of information in order to increase the validity of a study
These sources are likely to be stakeholders in a program - participants, other researchers, program staff, other community members, and so on.
Then we put all data in single framework & apply various statistical tools to find out the dynamic on the market.
During the analysis stage, feedback from the stakeholder groups would be compared to determine areas of agreement as well as areas of divergence
