

Key Insights
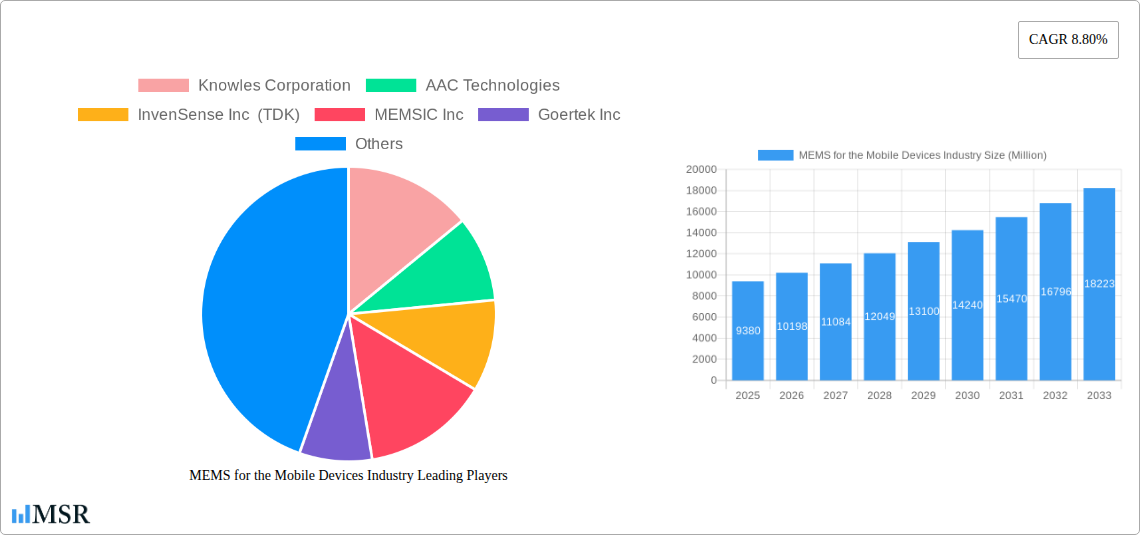
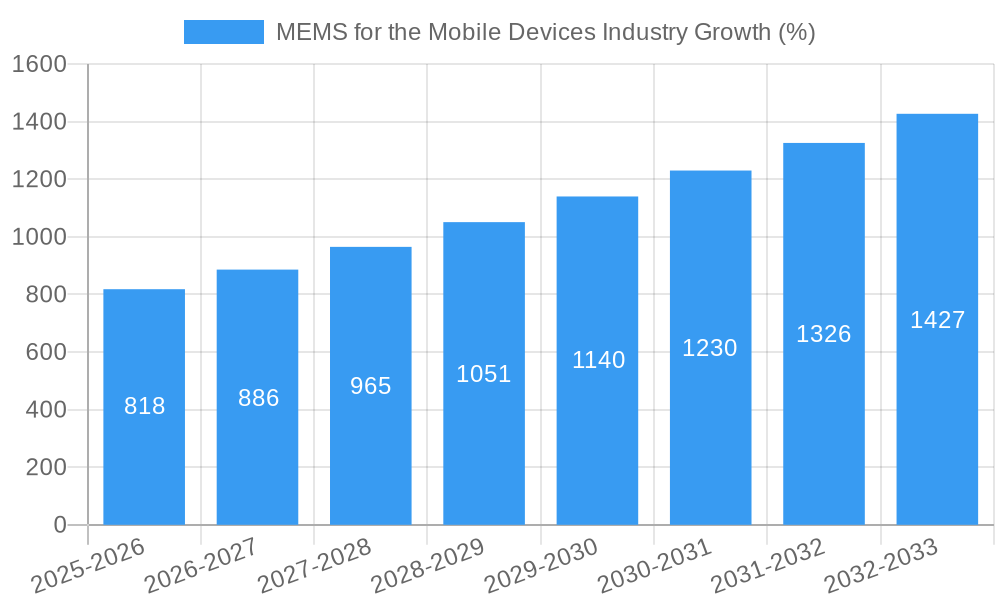
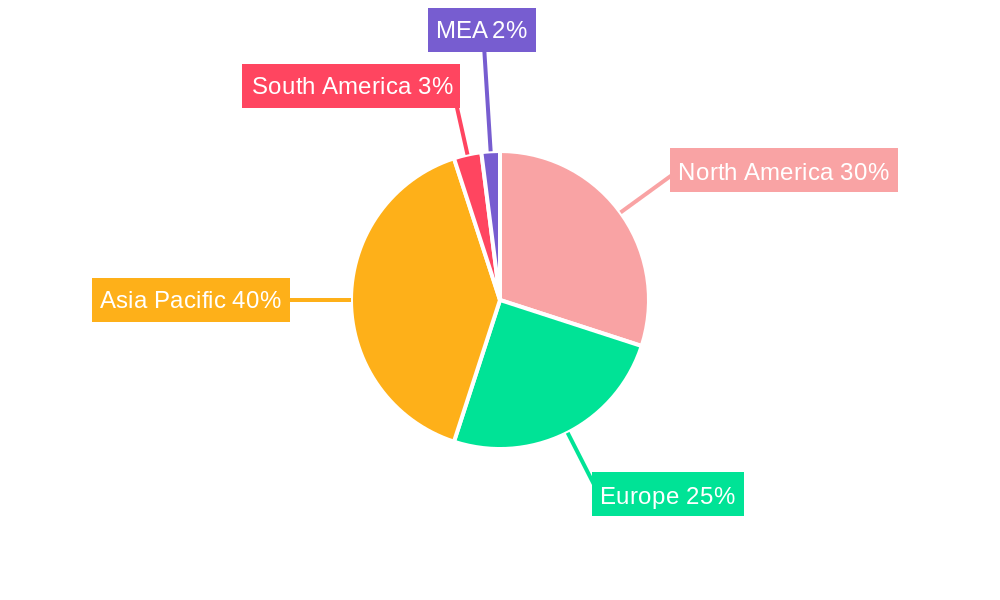
The MEMS (Microelectromechanical Systems) market for mobile devices is experiencing robust growth, projected to reach a market size of $9.38 billion in 2025, expanding at a compound annual growth rate (CAGR) of 8.80% from 2019 to 2033. This significant expansion is driven by several key factors. The increasing demand for advanced functionalities in smartphones, such as improved image stabilization, precise gesture recognition, and enhanced user experience through haptic feedback, fuels the demand for sophisticated MEMS sensors. Furthermore, the proliferation of wearable devices and the Internet of Things (IoT) contributes to this growth. Miniaturization, improved power efficiency, and decreasing costs of MEMS sensors are making them increasingly attractive for integration into various mobile applications. The diverse range of sensor types, including fingerprint sensors, accelerometers, gyroscopes, pressure sensors, and microphones, caters to the diverse needs of the mobile device market. Competition amongst leading players like Knowles Corporation, AAC Technologies, and Bosch Sensortec GmbH is driving innovation and fostering technological advancements. Geographic distribution shows strong market presence in North America and Asia-Pacific, with China and the US representing significant consumer bases. However, the market also faces certain challenges, including stringent regulatory compliance requirements and the potential for supply chain disruptions impacting production.
Looking ahead to the forecast period (2025-2033), consistent growth is anticipated, fueled by continued technological innovation within the MEMS sector, and a growing preference for feature-rich mobile devices across various demographics globally. The increasing adoption of 5G technology and the rise of augmented and virtual reality applications are also projected to further stimulate demand for higher-performance MEMS sensors. The competitive landscape will remain dynamic, with ongoing R&D investments driving improvements in sensor accuracy, miniaturization, and power efficiency. The focus on integration and system-level solutions will likely become increasingly important for MEMS manufacturers to maintain a strong market position. Regionally, Asia-Pacific is expected to maintain its leading position, driven by high smartphone penetration and expanding manufacturing capabilities.
MEMS for the Mobile Devices Industry: A Comprehensive Market Report (2019-2033)
This comprehensive report provides an in-depth analysis of the MEMS (Microelectromechanical Systems) market for mobile devices, offering invaluable insights for industry stakeholders. From market dynamics and leading players to emerging trends and future opportunities, this report covers all key aspects of this rapidly evolving sector. The study period spans from 2019 to 2033, with 2025 serving as both the base and estimated year. The forecast period extends from 2025 to 2033, while the historical period encompasses 2019-2024. The market is projected to reach xx Million by 2033, showcasing substantial growth potential.
MEMS for the Mobile Devices Industry Market Concentration & Dynamics
This section assesses the competitive landscape of the MEMS market for mobile devices, examining market concentration, innovation, regulatory factors, substitute technologies, consumer trends, and mergers & acquisitions (M&A) activity. The market exhibits a moderately concentrated structure, with a few dominant players holding significant market share. Knowles Corporation, AAC Technologies, and Bosch Sensortec GmbH are among the leading players, collectively accounting for approximately xx% of the market in 2024.
- Market Share: The top 5 players command approximately 60% of the global market share, indicating a competitive but not overly fragmented environment.
- M&A Activity: The past five years have witnessed xx M&A deals, primarily focused on expanding product portfolios and technological capabilities. Consolidation is expected to continue, driving further market concentration.
- Innovation Ecosystems: Robust R&D investments fuel continuous innovation in MEMS technologies, particularly in areas like miniaturization, power efficiency, and enhanced sensing capabilities. Collaboration between established players and startups is a prominent feature of the innovation ecosystem.
- Regulatory Frameworks: Stringent regulatory standards regarding data privacy and product safety influence market dynamics, particularly in regions like Europe and North America.
- Substitute Products: While MEMS technology dominates the market, alternative technologies such as optical sensors pose some level of competition in specific applications.
- End-User Trends: The increasing demand for advanced functionalities in smartphones, wearables, and IoT devices drives the growth of the MEMS market.
MEMS for the Mobile Devices Industry Industry Insights & Trends
This section analyzes the key factors shaping the growth trajectory of the MEMS market for mobile devices. The market witnessed robust growth during the historical period (2019-2024), achieving a Compound Annual Growth Rate (CAGR) of xx%. This growth is projected to continue into the forecast period (2025-2033), with a projected CAGR of xx%, driven by several key factors. The global market size was valued at $xx Million in 2024 and is estimated to reach $xx Million by 2025. Technological advancements, particularly in miniaturization and enhanced sensor performance, are a significant driver. The increasing adoption of smartphones, wearables, and IoT devices globally is another key factor fueling the market's expansion. The rising demand for advanced features in these devices, such as improved biometric authentication, motion tracking, and environmental sensing, further stimulates market growth. Changing consumer preferences towards smaller, more powerful, and feature-rich devices create a strong demand for sophisticated MEMS technologies.
Key Markets & Segments Leading MEMS for the Mobile Devices Industry
This section identifies the leading markets and segments within the MEMS industry for mobile devices. Asia Pacific, specifically China, holds the largest market share due to the high volume of smartphone and wearable device production.
Dominant Segments:
- Type of Sensor: Fingerprint sensors and accelerometer sensors currently dominate the market, accounting for approximately xx% of the total market share. However, growth is expected in other segments, such as BAW sensors and pressure sensors, driven by their increasing applications in advanced mobile devices and IoT technologies.
- Application: Smartphones constitute the largest application segment, closely followed by wearable devices. The growth of IoT devices will open up further opportunities for MEMS manufacturers in the coming years.
Drivers:
- Economic Growth: Strong economic growth in emerging markets fuels the demand for smartphones and other mobile devices, thereby driving the growth of the MEMS market.
- Technological Advancements: Continuous improvements in MEMS technology, leading to higher sensitivity, lower power consumption, and smaller form factors, significantly impact market growth.
- Infrastructure Development: Expansion of telecommunication infrastructure in developing countries supports the adoption of mobile devices and their associated MEMS technologies.
MEMS for the Mobile Devices Industry Product Developments
Recent years have witnessed significant advancements in MEMS technology, leading to the development of smaller, more energy-efficient, and higher-performing sensors. Companies are focusing on integrating multiple sensor functionalities into a single chip, reducing costs and enhancing performance. The introduction of new materials and fabrication techniques is also driving innovation. For example, Knowles Corporation's release of new MEMS microphones for hearing aids demonstrates the focus on expanding applications for MEMS technology beyond traditional mobile devices.
Challenges in the MEMS for the Mobile Devices Industry Market
The MEMS market faces several challenges, including intense competition, supply chain disruptions, and the need for continuous innovation to meet evolving consumer demands. High manufacturing costs, the need for sophisticated testing and quality control processes, and the potential impact of geopolitical uncertainties pose further challenges. Supply chain constraints can lead to production delays and impact profit margins. The emergence of alternative technologies also adds to the competitive pressure.
Forces Driving MEMS for the Mobile Devices Industry Growth
The MEMS market benefits from several growth drivers, including the proliferation of smartphones, wearables, and IoT devices; increasing demand for enhanced functionalities in mobile devices, like improved biometric authentication and motion tracking; technological advancements leading to smaller, more energy-efficient, and higher-performing sensors; and increasing investment in R&D and partnerships to fuel innovation.
Challenges in the MEMS for the Mobile Devices Industry Market
Sustained long-term growth hinges on continued innovation, strategic partnerships, and expansion into new markets. Investing in advanced research and development, developing innovative applications for MEMS technology, and fostering strategic collaborations will be crucial for maintaining growth momentum. Furthermore, diversification into new markets and applications beyond traditional mobile devices will unlock further growth opportunities.
Emerging Opportunities in the MEMS for the Mobile Devices Industry
Emerging opportunities lie in the growing adoption of 5G technology, advancements in artificial intelligence and machine learning, the expansion of the automotive and healthcare sectors, and the rise of new applications in areas such as augmented reality and virtual reality. The development of miniaturized sensors with enhanced functionalities will continue to drive demand.
Leading Players in the MEMS for the Mobile Devices Industry Sector
- Knowles Corporation
- AAC Technologies
- InvenSense Inc (TDK)
- MEMSIC Inc
- Goertek Inc
- Bosch Sensortec GmbH
- Murata Manufacturing
- STMicroelectronics NV
- Analog Devices Inc
- BSE Co Ltd
Key Milestones in MEMS for the Mobile Devices Industry Industry
- December 2022: Knowles Corporation introduced new balanced armatures and MEMS microphones for over-the-counter hearing aids, expanding the application of MEMS technology beyond traditional mobile devices. This signifies a strategic move to diversify into new high-growth market segments.
- November 2022: Bosch Sensortec GmbH partnered with Hahn-Schickard to develop MEMS micro speakers, strengthening its position in the audio market and further diversifying its product portfolio. This highlights the importance of collaborations in driving innovation and market expansion.
Strategic Outlook for MEMS for the Mobile Devices Industry Market
The future of the MEMS market for mobile devices is bright, driven by continued technological advancements, the proliferation of smart devices, and the emergence of new applications in diverse sectors. Strategic opportunities exist for companies to invest in R&D, forge strategic partnerships, and expand into new, high-growth market segments. Focusing on miniaturization, improved power efficiency, and enhanced sensor functionalities will be key to maintaining a competitive edge.
MEMS for the Mobile Devices Industry Segmentation
-
1. Type of Sensor
- 1.1. Fingerprint Sensor
- 1.2. Accelerometer Sensor
- 1.3. Gyroscope
- 1.4. Pressure Sensor
- 1.5. BAW Sensor
- 1.6. Microphones
- 1.7. Other Types of Sensors
MEMS for the Mobile Devices Industry Segmentation By Geography
- 1. North America
- 2. Europe
- 3. Asia Pacific
- 4. Latin America
- 5. Middle East and Africa
MEMS for the Mobile Devices Industry REPORT HIGHLIGHTS
| Aspects | Details |
|---|---|
| Study Period | 2019-2033 |
| Base Year | 2024 |
| Estimated Year | 2025 |
| Forecast Period | 2025-2033 |
| Historical Period | 2019-2024 |
| Growth Rate | CAGR of 8.80% from 2019-2033 |
| Segmentation |
|
Table of Contents
- 1. Introduction
- 1.1. Research Scope
- 1.2. Market Segmentation
- 1.3. Research Methodology
- 1.4. Definitions and Assumptions
- 2. Executive Summary
- 2.1. Introduction
- 3. Market Dynamics
- 3.1. Introduction
- 3.2. Market Drivers
- 3.2.1. Increasing Acceptance of Miniaturization Trend; Increasing Demand for High-Performance Devices
- 3.3. Market Restrains
- 3.3.1. Highly Complex Manufacturing Process and Demanding Cycle Time; Lack of Standardized Fabrication Process
- 3.4. Market Trends
- 3.4.1. Increasing Acceptance of Miniaturization Trend to Drive the Market
- 4. Market Factor Analysis
- 4.1. Porters Five Forces
- 4.2. Supply/Value Chain
- 4.3. PESTEL analysis
- 4.4. Market Entropy
- 4.5. Patent/Trademark Analysis
- 5. Global MEMS for the Mobile Devices Industry Analysis, Insights and Forecast, 2019-2031
- 5.1. Market Analysis, Insights and Forecast - by Type of Sensor
- 5.1.1. Fingerprint Sensor
- 5.1.2. Accelerometer Sensor
- 5.1.3. Gyroscope
- 5.1.4. Pressure Sensor
- 5.1.5. BAW Sensor
- 5.1.6. Microphones
- 5.1.7. Other Types of Sensors
- 5.2. Market Analysis, Insights and Forecast - by Region
- 5.2.1. North America
- 5.2.2. Europe
- 5.2.3. Asia Pacific
- 5.2.4. Latin America
- 5.2.5. Middle East and Africa
- 5.1. Market Analysis, Insights and Forecast - by Type of Sensor
- 6. North America MEMS for the Mobile Devices Industry Analysis, Insights and Forecast, 2019-2031
- 6.1. Market Analysis, Insights and Forecast - by Type of Sensor
- 6.1.1. Fingerprint Sensor
- 6.1.2. Accelerometer Sensor
- 6.1.3. Gyroscope
- 6.1.4. Pressure Sensor
- 6.1.5. BAW Sensor
- 6.1.6. Microphones
- 6.1.7. Other Types of Sensors
- 6.1. Market Analysis, Insights and Forecast - by Type of Sensor
- 7. Europe MEMS for the Mobile Devices Industry Analysis, Insights and Forecast, 2019-2031
- 7.1. Market Analysis, Insights and Forecast - by Type of Sensor
- 7.1.1. Fingerprint Sensor
- 7.1.2. Accelerometer Sensor
- 7.1.3. Gyroscope
- 7.1.4. Pressure Sensor
- 7.1.5. BAW Sensor
- 7.1.6. Microphones
- 7.1.7. Other Types of Sensors
- 7.1. Market Analysis, Insights and Forecast - by Type of Sensor
- 8. Asia Pacific MEMS for the Mobile Devices Industry Analysis, Insights and Forecast, 2019-2031
- 8.1. Market Analysis, Insights and Forecast - by Type of Sensor
- 8.1.1. Fingerprint Sensor
- 8.1.2. Accelerometer Sensor
- 8.1.3. Gyroscope
- 8.1.4. Pressure Sensor
- 8.1.5. BAW Sensor
- 8.1.6. Microphones
- 8.1.7. Other Types of Sensors
- 8.1. Market Analysis, Insights and Forecast - by Type of Sensor
- 9. Latin America MEMS for the Mobile Devices Industry Analysis, Insights and Forecast, 2019-2031
- 9.1. Market Analysis, Insights and Forecast - by Type of Sensor
- 9.1.1. Fingerprint Sensor
- 9.1.2. Accelerometer Sensor
- 9.1.3. Gyroscope
- 9.1.4. Pressure Sensor
- 9.1.5. BAW Sensor
- 9.1.6. Microphones
- 9.1.7. Other Types of Sensors
- 9.1. Market Analysis, Insights and Forecast - by Type of Sensor
- 10. Middle East and Africa MEMS for the Mobile Devices Industry Analysis, Insights and Forecast, 2019-2031
- 10.1. Market Analysis, Insights and Forecast - by Type of Sensor
- 10.1.1. Fingerprint Sensor
- 10.1.2. Accelerometer Sensor
- 10.1.3. Gyroscope
- 10.1.4. Pressure Sensor
- 10.1.5. BAW Sensor
- 10.1.6. Microphones
- 10.1.7. Other Types of Sensors
- 10.1. Market Analysis, Insights and Forecast - by Type of Sensor
- 11. North America MEMS for the Mobile Devices Industry Analysis, Insights and Forecast, 2019-2031
- 11.1. Market Analysis, Insights and Forecast - By Country/Sub-region
- 11.1.1 United States
- 11.1.2 Canada
- 11.1.3 Mexico
- 12. Europe MEMS for the Mobile Devices Industry Analysis, Insights and Forecast, 2019-2031
- 12.1. Market Analysis, Insights and Forecast - By Country/Sub-region
- 12.1.1 Germany
- 12.1.2 United Kingdom
- 12.1.3 France
- 12.1.4 Spain
- 12.1.5 Italy
- 12.1.6 Spain
- 12.1.7 Belgium
- 12.1.8 Netherland
- 12.1.9 Nordics
- 12.1.10 Rest of Europe
- 13. Asia Pacific MEMS for the Mobile Devices Industry Analysis, Insights and Forecast, 2019-2031
- 13.1. Market Analysis, Insights and Forecast - By Country/Sub-region
- 13.1.1 China
- 13.1.2 Japan
- 13.1.3 India
- 13.1.4 South Korea
- 13.1.5 Southeast Asia
- 13.1.6 Australia
- 13.1.7 Indonesia
- 13.1.8 Phillipes
- 13.1.9 Singapore
- 13.1.10 Thailandc
- 13.1.11 Rest of Asia Pacific
- 14. South America MEMS for the Mobile Devices Industry Analysis, Insights and Forecast, 2019-2031
- 14.1. Market Analysis, Insights and Forecast - By Country/Sub-region
- 14.1.1 Brazil
- 14.1.2 Argentina
- 14.1.3 Peru
- 14.1.4 Chile
- 14.1.5 Colombia
- 14.1.6 Ecuador
- 14.1.7 Venezuela
- 14.1.8 Rest of South America
- 15. MEA MEMS for the Mobile Devices Industry Analysis, Insights and Forecast, 2019-2031
- 15.1. Market Analysis, Insights and Forecast - By Country/Sub-region
- 15.1.1 United Arab Emirates
- 15.1.2 Saudi Arabia
- 15.1.3 South Africa
- 15.1.4 Rest of Middle East and Africa
- 16. Competitive Analysis
- 16.1. Global Market Share Analysis 2024
- 16.2. Company Profiles
- 16.2.1 Knowles Corporation
- 16.2.1.1. Overview
- 16.2.1.2. Products
- 16.2.1.3. SWOT Analysis
- 16.2.1.4. Recent Developments
- 16.2.1.5. Financials (Based on Availability)
- 16.2.2 AAC Technologies
- 16.2.2.1. Overview
- 16.2.2.2. Products
- 16.2.2.3. SWOT Analysis
- 16.2.2.4. Recent Developments
- 16.2.2.5. Financials (Based on Availability)
- 16.2.3 InvenSense Inc (TDK)
- 16.2.3.1. Overview
- 16.2.3.2. Products
- 16.2.3.3. SWOT Analysis
- 16.2.3.4. Recent Developments
- 16.2.3.5. Financials (Based on Availability)
- 16.2.4 MEMSIC Inc
- 16.2.4.1. Overview
- 16.2.4.2. Products
- 16.2.4.3. SWOT Analysis
- 16.2.4.4. Recent Developments
- 16.2.4.5. Financials (Based on Availability)
- 16.2.5 Goertek Inc
- 16.2.5.1. Overview
- 16.2.5.2. Products
- 16.2.5.3. SWOT Analysis
- 16.2.5.4. Recent Developments
- 16.2.5.5. Financials (Based on Availability)
- 16.2.6 Bosch Sensortec GmbH
- 16.2.6.1. Overview
- 16.2.6.2. Products
- 16.2.6.3. SWOT Analysis
- 16.2.6.4. Recent Developments
- 16.2.6.5. Financials (Based on Availability)
- 16.2.7 Murata Manufacturing
- 16.2.7.1. Overview
- 16.2.7.2. Products
- 16.2.7.3. SWOT Analysis
- 16.2.7.4. Recent Developments
- 16.2.7.5. Financials (Based on Availability)
- 16.2.8 STMicroelectronics NV
- 16.2.8.1. Overview
- 16.2.8.2. Products
- 16.2.8.3. SWOT Analysis
- 16.2.8.4. Recent Developments
- 16.2.8.5. Financials (Based on Availability)
- 16.2.9 Analog Devices Inc
- 16.2.9.1. Overview
- 16.2.9.2. Products
- 16.2.9.3. SWOT Analysis
- 16.2.9.4. Recent Developments
- 16.2.9.5. Financials (Based on Availability)
- 16.2.10 BSE Co Ltd
- 16.2.10.1. Overview
- 16.2.10.2. Products
- 16.2.10.3. SWOT Analysis
- 16.2.10.4. Recent Developments
- 16.2.10.5. Financials (Based on Availability)
- 16.2.1 Knowles Corporation
List of Figures
- Figure 1: Global MEMS for the Mobile Devices Industry Revenue Breakdown (Million, %) by Region 2024 & 2032
- Figure 2: Global MEMS for the Mobile Devices Industry Volume Breakdown (K Unit, %) by Region 2024 & 2032
- Figure 3: North America MEMS for the Mobile Devices Industry Revenue (Million), by Country 2024 & 2032
- Figure 4: North America MEMS for the Mobile Devices Industry Volume (K Unit), by Country 2024 & 2032
- Figure 5: North America MEMS for the Mobile Devices Industry Revenue Share (%), by Country 2024 & 2032
- Figure 6: North America MEMS for the Mobile Devices Industry Volume Share (%), by Country 2024 & 2032
- Figure 7: Europe MEMS for the Mobile Devices Industry Revenue (Million), by Country 2024 & 2032
- Figure 8: Europe MEMS for the Mobile Devices Industry Volume (K Unit), by Country 2024 & 2032
- Figure 9: Europe MEMS for the Mobile Devices Industry Revenue Share (%), by Country 2024 & 2032
- Figure 10: Europe MEMS for the Mobile Devices Industry Volume Share (%), by Country 2024 & 2032
- Figure 11: Asia Pacific MEMS for the Mobile Devices Industry Revenue (Million), by Country 2024 & 2032
- Figure 12: Asia Pacific MEMS for the Mobile Devices Industry Volume (K Unit), by Country 2024 & 2032
- Figure 13: Asia Pacific MEMS for the Mobile Devices Industry Revenue Share (%), by Country 2024 & 2032
- Figure 14: Asia Pacific MEMS for the Mobile Devices Industry Volume Share (%), by Country 2024 & 2032
- Figure 15: South America MEMS for the Mobile Devices Industry Revenue (Million), by Country 2024 & 2032
- Figure 16: South America MEMS for the Mobile Devices Industry Volume (K Unit), by Country 2024 & 2032
- Figure 17: South America MEMS for the Mobile Devices Industry Revenue Share (%), by Country 2024 & 2032
- Figure 18: South America MEMS for the Mobile Devices Industry Volume Share (%), by Country 2024 & 2032
- Figure 19: MEA MEMS for the Mobile Devices Industry Revenue (Million), by Country 2024 & 2032
- Figure 20: MEA MEMS for the Mobile Devices Industry Volume (K Unit), by Country 2024 & 2032
- Figure 21: MEA MEMS for the Mobile Devices Industry Revenue Share (%), by Country 2024 & 2032
- Figure 22: MEA MEMS for the Mobile Devices Industry Volume Share (%), by Country 2024 & 2032
- Figure 23: North America MEMS for the Mobile Devices Industry Revenue (Million), by Type of Sensor 2024 & 2032
- Figure 24: North America MEMS for the Mobile Devices Industry Volume (K Unit), by Type of Sensor 2024 & 2032
- Figure 25: North America MEMS for the Mobile Devices Industry Revenue Share (%), by Type of Sensor 2024 & 2032
- Figure 26: North America MEMS for the Mobile Devices Industry Volume Share (%), by Type of Sensor 2024 & 2032
- Figure 27: North America MEMS for the Mobile Devices Industry Revenue (Million), by Country 2024 & 2032
- Figure 28: North America MEMS for the Mobile Devices Industry Volume (K Unit), by Country 2024 & 2032
- Figure 29: North America MEMS for the Mobile Devices Industry Revenue Share (%), by Country 2024 & 2032
- Figure 30: North America MEMS for the Mobile Devices Industry Volume Share (%), by Country 2024 & 2032
- Figure 31: Europe MEMS for the Mobile Devices Industry Revenue (Million), by Type of Sensor 2024 & 2032
- Figure 32: Europe MEMS for the Mobile Devices Industry Volume (K Unit), by Type of Sensor 2024 & 2032
- Figure 33: Europe MEMS for the Mobile Devices Industry Revenue Share (%), by Type of Sensor 2024 & 2032
- Figure 34: Europe MEMS for the Mobile Devices Industry Volume Share (%), by Type of Sensor 2024 & 2032
- Figure 35: Europe MEMS for the Mobile Devices Industry Revenue (Million), by Country 2024 & 2032
- Figure 36: Europe MEMS for the Mobile Devices Industry Volume (K Unit), by Country 2024 & 2032
- Figure 37: Europe MEMS for the Mobile Devices Industry Revenue Share (%), by Country 2024 & 2032
- Figure 38: Europe MEMS for the Mobile Devices Industry Volume Share (%), by Country 2024 & 2032
- Figure 39: Asia Pacific MEMS for the Mobile Devices Industry Revenue (Million), by Type of Sensor 2024 & 2032
- Figure 40: Asia Pacific MEMS for the Mobile Devices Industry Volume (K Unit), by Type of Sensor 2024 & 2032
- Figure 41: Asia Pacific MEMS for the Mobile Devices Industry Revenue Share (%), by Type of Sensor 2024 & 2032
- Figure 42: Asia Pacific MEMS for the Mobile Devices Industry Volume Share (%), by Type of Sensor 2024 & 2032
- Figure 43: Asia Pacific MEMS for the Mobile Devices Industry Revenue (Million), by Country 2024 & 2032
- Figure 44: Asia Pacific MEMS for the Mobile Devices Industry Volume (K Unit), by Country 2024 & 2032
- Figure 45: Asia Pacific MEMS for the Mobile Devices Industry Revenue Share (%), by Country 2024 & 2032
- Figure 46: Asia Pacific MEMS for the Mobile Devices Industry Volume Share (%), by Country 2024 & 2032
- Figure 47: Latin America MEMS for the Mobile Devices Industry Revenue (Million), by Type of Sensor 2024 & 2032
- Figure 48: Latin America MEMS for the Mobile Devices Industry Volume (K Unit), by Type of Sensor 2024 & 2032
- Figure 49: Latin America MEMS for the Mobile Devices Industry Revenue Share (%), by Type of Sensor 2024 & 2032
- Figure 50: Latin America MEMS for the Mobile Devices Industry Volume Share (%), by Type of Sensor 2024 & 2032
- Figure 51: Latin America MEMS for the Mobile Devices Industry Revenue (Million), by Country 2024 & 2032
- Figure 52: Latin America MEMS for the Mobile Devices Industry Volume (K Unit), by Country 2024 & 2032
- Figure 53: Latin America MEMS for the Mobile Devices Industry Revenue Share (%), by Country 2024 & 2032
- Figure 54: Latin America MEMS for the Mobile Devices Industry Volume Share (%), by Country 2024 & 2032
- Figure 55: Middle East and Africa MEMS for the Mobile Devices Industry Revenue (Million), by Type of Sensor 2024 & 2032
- Figure 56: Middle East and Africa MEMS for the Mobile Devices Industry Volume (K Unit), by Type of Sensor 2024 & 2032
- Figure 57: Middle East and Africa MEMS for the Mobile Devices Industry Revenue Share (%), by Type of Sensor 2024 & 2032
- Figure 58: Middle East and Africa MEMS for the Mobile Devices Industry Volume Share (%), by Type of Sensor 2024 & 2032
- Figure 59: Middle East and Africa MEMS for the Mobile Devices Industry Revenue (Million), by Country 2024 & 2032
- Figure 60: Middle East and Africa MEMS for the Mobile Devices Industry Volume (K Unit), by Country 2024 & 2032
- Figure 61: Middle East and Africa MEMS for the Mobile Devices Industry Revenue Share (%), by Country 2024 & 2032
- Figure 62: Middle East and Africa MEMS for the Mobile Devices Industry Volume Share (%), by Country 2024 & 2032
List of Tables
- Table 1: Global MEMS for the Mobile Devices Industry Revenue Million Forecast, by Region 2019 & 2032
- Table 2: Global MEMS for the Mobile Devices Industry Volume K Unit Forecast, by Region 2019 & 2032
- Table 3: Global MEMS for the Mobile Devices Industry Revenue Million Forecast, by Type of Sensor 2019 & 2032
- Table 4: Global MEMS for the Mobile Devices Industry Volume K Unit Forecast, by Type of Sensor 2019 & 2032
- Table 5: Global MEMS for the Mobile Devices Industry Revenue Million Forecast, by Region 2019 & 2032
- Table 6: Global MEMS for the Mobile Devices Industry Volume K Unit Forecast, by Region 2019 & 2032
- Table 7: Global MEMS for the Mobile Devices Industry Revenue Million Forecast, by Country 2019 & 2032
- Table 8: Global MEMS for the Mobile Devices Industry Volume K Unit Forecast, by Country 2019 & 2032
- Table 9: United States MEMS for the Mobile Devices Industry Revenue (Million) Forecast, by Application 2019 & 2032
- Table 10: United States MEMS for the Mobile Devices Industry Volume (K Unit) Forecast, by Application 2019 & 2032
- Table 11: Canada MEMS for the Mobile Devices Industry Revenue (Million) Forecast, by Application 2019 & 2032
- Table 12: Canada MEMS for the Mobile Devices Industry Volume (K Unit) Forecast, by Application 2019 & 2032
- Table 13: Mexico MEMS for the Mobile Devices Industry Revenue (Million) Forecast, by Application 2019 & 2032
- Table 14: Mexico MEMS for the Mobile Devices Industry Volume (K Unit) Forecast, by Application 2019 & 2032
- Table 15: Global MEMS for the Mobile Devices Industry Revenue Million Forecast, by Country 2019 & 2032
- Table 16: Global MEMS for the Mobile Devices Industry Volume K Unit Forecast, by Country 2019 & 2032
- Table 17: Germany MEMS for the Mobile Devices Industry Revenue (Million) Forecast, by Application 2019 & 2032
- Table 18: Germany MEMS for the Mobile Devices Industry Volume (K Unit) Forecast, by Application 2019 & 2032
- Table 19: United Kingdom MEMS for the Mobile Devices Industry Revenue (Million) Forecast, by Application 2019 & 2032
- Table 20: United Kingdom MEMS for the Mobile Devices Industry Volume (K Unit) Forecast, by Application 2019 & 2032
- Table 21: France MEMS for the Mobile Devices Industry Revenue (Million) Forecast, by Application 2019 & 2032
- Table 22: France MEMS for the Mobile Devices Industry Volume (K Unit) Forecast, by Application 2019 & 2032
- Table 23: Spain MEMS for the Mobile Devices Industry Revenue (Million) Forecast, by Application 2019 & 2032
- Table 24: Spain MEMS for the Mobile Devices Industry Volume (K Unit) Forecast, by Application 2019 & 2032
- Table 25: Italy MEMS for the Mobile Devices Industry Revenue (Million) Forecast, by Application 2019 & 2032
- Table 26: Italy MEMS for the Mobile Devices Industry Volume (K Unit) Forecast, by Application 2019 & 2032
- Table 27: Spain MEMS for the Mobile Devices Industry Revenue (Million) Forecast, by Application 2019 & 2032
- Table 28: Spain MEMS for the Mobile Devices Industry Volume (K Unit) Forecast, by Application 2019 & 2032
- Table 29: Belgium MEMS for the Mobile Devices Industry Revenue (Million) Forecast, by Application 2019 & 2032
- Table 30: Belgium MEMS for the Mobile Devices Industry Volume (K Unit) Forecast, by Application 2019 & 2032
- Table 31: Netherland MEMS for the Mobile Devices Industry Revenue (Million) Forecast, by Application 2019 & 2032
- Table 32: Netherland MEMS for the Mobile Devices Industry Volume (K Unit) Forecast, by Application 2019 & 2032
- Table 33: Nordics MEMS for the Mobile Devices Industry Revenue (Million) Forecast, by Application 2019 & 2032
- Table 34: Nordics MEMS for the Mobile Devices Industry Volume (K Unit) Forecast, by Application 2019 & 2032
- Table 35: Rest of Europe MEMS for the Mobile Devices Industry Revenue (Million) Forecast, by Application 2019 & 2032
- Table 36: Rest of Europe MEMS for the Mobile Devices Industry Volume (K Unit) Forecast, by Application 2019 & 2032
- Table 37: Global MEMS for the Mobile Devices Industry Revenue Million Forecast, by Country 2019 & 2032
- Table 38: Global MEMS for the Mobile Devices Industry Volume K Unit Forecast, by Country 2019 & 2032
- Table 39: China MEMS for the Mobile Devices Industry Revenue (Million) Forecast, by Application 2019 & 2032
- Table 40: China MEMS for the Mobile Devices Industry Volume (K Unit) Forecast, by Application 2019 & 2032
- Table 41: Japan MEMS for the Mobile Devices Industry Revenue (Million) Forecast, by Application 2019 & 2032
- Table 42: Japan MEMS for the Mobile Devices Industry Volume (K Unit) Forecast, by Application 2019 & 2032
- Table 43: India MEMS for the Mobile Devices Industry Revenue (Million) Forecast, by Application 2019 & 2032
- Table 44: India MEMS for the Mobile Devices Industry Volume (K Unit) Forecast, by Application 2019 & 2032
- Table 45: South Korea MEMS for the Mobile Devices Industry Revenue (Million) Forecast, by Application 2019 & 2032
- Table 46: South Korea MEMS for the Mobile Devices Industry Volume (K Unit) Forecast, by Application 2019 & 2032
- Table 47: Southeast Asia MEMS for the Mobile Devices Industry Revenue (Million) Forecast, by Application 2019 & 2032
- Table 48: Southeast Asia MEMS for the Mobile Devices Industry Volume (K Unit) Forecast, by Application 2019 & 2032
- Table 49: Australia MEMS for the Mobile Devices Industry Revenue (Million) Forecast, by Application 2019 & 2032
- Table 50: Australia MEMS for the Mobile Devices Industry Volume (K Unit) Forecast, by Application 2019 & 2032
- Table 51: Indonesia MEMS for the Mobile Devices Industry Revenue (Million) Forecast, by Application 2019 & 2032
- Table 52: Indonesia MEMS for the Mobile Devices Industry Volume (K Unit) Forecast, by Application 2019 & 2032
- Table 53: Phillipes MEMS for the Mobile Devices Industry Revenue (Million) Forecast, by Application 2019 & 2032
- Table 54: Phillipes MEMS for the Mobile Devices Industry Volume (K Unit) Forecast, by Application 2019 & 2032
- Table 55: Singapore MEMS for the Mobile Devices Industry Revenue (Million) Forecast, by Application 2019 & 2032
- Table 56: Singapore MEMS for the Mobile Devices Industry Volume (K Unit) Forecast, by Application 2019 & 2032
- Table 57: Thailandc MEMS for the Mobile Devices Industry Revenue (Million) Forecast, by Application 2019 & 2032
- Table 58: Thailandc MEMS for the Mobile Devices Industry Volume (K Unit) Forecast, by Application 2019 & 2032
- Table 59: Rest of Asia Pacific MEMS for the Mobile Devices Industry Revenue (Million) Forecast, by Application 2019 & 2032
- Table 60: Rest of Asia Pacific MEMS for the Mobile Devices Industry Volume (K Unit) Forecast, by Application 2019 & 2032
- Table 61: Global MEMS for the Mobile Devices Industry Revenue Million Forecast, by Country 2019 & 2032
- Table 62: Global MEMS for the Mobile Devices Industry Volume K Unit Forecast, by Country 2019 & 2032
- Table 63: Brazil MEMS for the Mobile Devices Industry Revenue (Million) Forecast, by Application 2019 & 2032
- Table 64: Brazil MEMS for the Mobile Devices Industry Volume (K Unit) Forecast, by Application 2019 & 2032
- Table 65: Argentina MEMS for the Mobile Devices Industry Revenue (Million) Forecast, by Application 2019 & 2032
- Table 66: Argentina MEMS for the Mobile Devices Industry Volume (K Unit) Forecast, by Application 2019 & 2032
- Table 67: Peru MEMS for the Mobile Devices Industry Revenue (Million) Forecast, by Application 2019 & 2032
- Table 68: Peru MEMS for the Mobile Devices Industry Volume (K Unit) Forecast, by Application 2019 & 2032
- Table 69: Chile MEMS for the Mobile Devices Industry Revenue (Million) Forecast, by Application 2019 & 2032
- Table 70: Chile MEMS for the Mobile Devices Industry Volume (K Unit) Forecast, by Application 2019 & 2032
- Table 71: Colombia MEMS for the Mobile Devices Industry Revenue (Million) Forecast, by Application 2019 & 2032
- Table 72: Colombia MEMS for the Mobile Devices Industry Volume (K Unit) Forecast, by Application 2019 & 2032
- Table 73: Ecuador MEMS for the Mobile Devices Industry Revenue (Million) Forecast, by Application 2019 & 2032
- Table 74: Ecuador MEMS for the Mobile Devices Industry Volume (K Unit) Forecast, by Application 2019 & 2032
- Table 75: Venezuela MEMS for the Mobile Devices Industry Revenue (Million) Forecast, by Application 2019 & 2032
- Table 76: Venezuela MEMS for the Mobile Devices Industry Volume (K Unit) Forecast, by Application 2019 & 2032
- Table 77: Rest of South America MEMS for the Mobile Devices Industry Revenue (Million) Forecast, by Application 2019 & 2032
- Table 78: Rest of South America MEMS for the Mobile Devices Industry Volume (K Unit) Forecast, by Application 2019 & 2032
- Table 79: Global MEMS for the Mobile Devices Industry Revenue Million Forecast, by Country 2019 & 2032
- Table 80: Global MEMS for the Mobile Devices Industry Volume K Unit Forecast, by Country 2019 & 2032
- Table 81: United Arab Emirates MEMS for the Mobile Devices Industry Revenue (Million) Forecast, by Application 2019 & 2032
- Table 82: United Arab Emirates MEMS for the Mobile Devices Industry Volume (K Unit) Forecast, by Application 2019 & 2032
- Table 83: Saudi Arabia MEMS for the Mobile Devices Industry Revenue (Million) Forecast, by Application 2019 & 2032
- Table 84: Saudi Arabia MEMS for the Mobile Devices Industry Volume (K Unit) Forecast, by Application 2019 & 2032
- Table 85: South Africa MEMS for the Mobile Devices Industry Revenue (Million) Forecast, by Application 2019 & 2032
- Table 86: South Africa MEMS for the Mobile Devices Industry Volume (K Unit) Forecast, by Application 2019 & 2032
- Table 87: Rest of Middle East and Africa MEMS for the Mobile Devices Industry Revenue (Million) Forecast, by Application 2019 & 2032
- Table 88: Rest of Middle East and Africa MEMS for the Mobile Devices Industry Volume (K Unit) Forecast, by Application 2019 & 2032
- Table 89: Global MEMS for the Mobile Devices Industry Revenue Million Forecast, by Type of Sensor 2019 & 2032
- Table 90: Global MEMS for the Mobile Devices Industry Volume K Unit Forecast, by Type of Sensor 2019 & 2032
- Table 91: Global MEMS for the Mobile Devices Industry Revenue Million Forecast, by Country 2019 & 2032
- Table 92: Global MEMS for the Mobile Devices Industry Volume K Unit Forecast, by Country 2019 & 2032
- Table 93: Global MEMS for the Mobile Devices Industry Revenue Million Forecast, by Type of Sensor 2019 & 2032
- Table 94: Global MEMS for the Mobile Devices Industry Volume K Unit Forecast, by Type of Sensor 2019 & 2032
- Table 95: Global MEMS for the Mobile Devices Industry Revenue Million Forecast, by Country 2019 & 2032
- Table 96: Global MEMS for the Mobile Devices Industry Volume K Unit Forecast, by Country 2019 & 2032
- Table 97: Global MEMS for the Mobile Devices Industry Revenue Million Forecast, by Type of Sensor 2019 & 2032
- Table 98: Global MEMS for the Mobile Devices Industry Volume K Unit Forecast, by Type of Sensor 2019 & 2032
- Table 99: Global MEMS for the Mobile Devices Industry Revenue Million Forecast, by Country 2019 & 2032
- Table 100: Global MEMS for the Mobile Devices Industry Volume K Unit Forecast, by Country 2019 & 2032
- Table 101: Global MEMS for the Mobile Devices Industry Revenue Million Forecast, by Type of Sensor 2019 & 2032
- Table 102: Global MEMS for the Mobile Devices Industry Volume K Unit Forecast, by Type of Sensor 2019 & 2032
- Table 103: Global MEMS for the Mobile Devices Industry Revenue Million Forecast, by Country 2019 & 2032
- Table 104: Global MEMS for the Mobile Devices Industry Volume K Unit Forecast, by Country 2019 & 2032
- Table 105: Global MEMS for the Mobile Devices Industry Revenue Million Forecast, by Type of Sensor 2019 & 2032
- Table 106: Global MEMS for the Mobile Devices Industry Volume K Unit Forecast, by Type of Sensor 2019 & 2032
- Table 107: Global MEMS for the Mobile Devices Industry Revenue Million Forecast, by Country 2019 & 2032
- Table 108: Global MEMS for the Mobile Devices Industry Volume K Unit Forecast, by Country 2019 & 2032
Frequently Asked Questions
1. What is the projected Compound Annual Growth Rate (CAGR) of the MEMS for the Mobile Devices Industry?
The projected CAGR is approximately 8.80%.
2. Which companies are prominent players in the MEMS for the Mobile Devices Industry?
Key companies in the market include Knowles Corporation, AAC Technologies, InvenSense Inc (TDK), MEMSIC Inc, Goertek Inc, Bosch Sensortec GmbH, Murata Manufacturing, STMicroelectronics NV, Analog Devices Inc, BSE Co Ltd.
3. What are the main segments of the MEMS for the Mobile Devices Industry?
The market segments include Type of Sensor.
4. Can you provide details about the market size?
The market size is estimated to be USD 9.38 Million as of 2022.
5. What are some drivers contributing to market growth?
Increasing Acceptance of Miniaturization Trend; Increasing Demand for High-Performance Devices.
6. What are the notable trends driving market growth?
Increasing Acceptance of Miniaturization Trend to Drive the Market.
7. Are there any restraints impacting market growth?
Highly Complex Manufacturing Process and Demanding Cycle Time; Lack of Standardized Fabrication Process.
8. Can you provide examples of recent developments in the market?
December 2022: Knowles introduced new balanced armatures and MEMS microphones for over-the-counter hearing aids. The new product released provides performance and design flexibility to help speed up the production of hearing health products. Three full-range balanced armature receivers and two updated MEMS microphones will meet the stringent design and acoustic performance requirements of hearing aids.
9. What pricing options are available for accessing the report?
Pricing options include single-user, multi-user, and enterprise licenses priced at USD 4750, USD 5250, and USD 8750 respectively.
10. Is the market size provided in terms of value or volume?
The market size is provided in terms of value, measured in Million and volume, measured in K Unit.
11. Are there any specific market keywords associated with the report?
Yes, the market keyword associated with the report is "MEMS for the Mobile Devices Industry," which aids in identifying and referencing the specific market segment covered.
12. How do I determine which pricing option suits my needs best?
The pricing options vary based on user requirements and access needs. Individual users may opt for single-user licenses, while businesses requiring broader access may choose multi-user or enterprise licenses for cost-effective access to the report.
13. Are there any additional resources or data provided in the MEMS for the Mobile Devices Industry report?
While the report offers comprehensive insights, it's advisable to review the specific contents or supplementary materials provided to ascertain if additional resources or data are available.
14. How can I stay updated on further developments or reports in the MEMS for the Mobile Devices Industry?
To stay informed about further developments, trends, and reports in the MEMS for the Mobile Devices Industry, consider subscribing to industry newsletters, following relevant companies and organizations, or regularly checking reputable industry news sources and publications.
Methodology
Step 1 - Identification of Relevant Samples Size from Population Database


Step 2 - Approaches for Defining Global Market Size (Value, Volume* & Price*)

Note*: In applicable scenarios
Step 3 - Data Sources
Primary Research
- Web Analytics
- Survey Reports
- Research Institute
- Latest Research Reports
- Opinion Leaders
Secondary Research
- Annual Reports
- White Paper
- Latest Press Release
- Industry Association
- Paid Database
- Investor Presentations

Step 4 - Data Triangulation
Involves using different sources of information in order to increase the validity of a study
These sources are likely to be stakeholders in a program - participants, other researchers, program staff, other community members, and so on.
Then we put all data in single framework & apply various statistical tools to find out the dynamic on the market.
During the analysis stage, feedback from the stakeholder groups would be compared to determine areas of agreement as well as areas of divergence
