

Key Insights
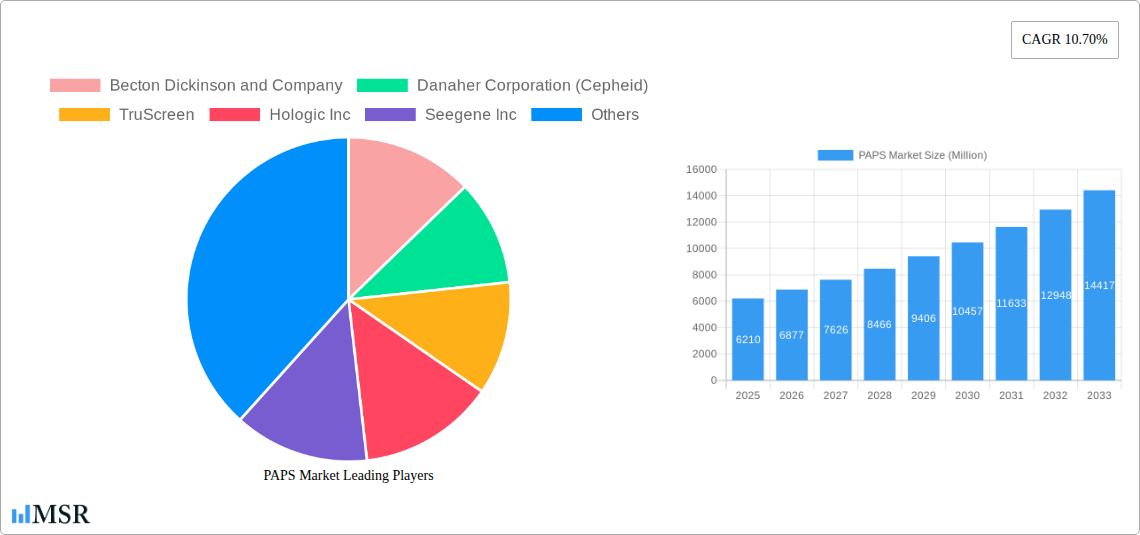
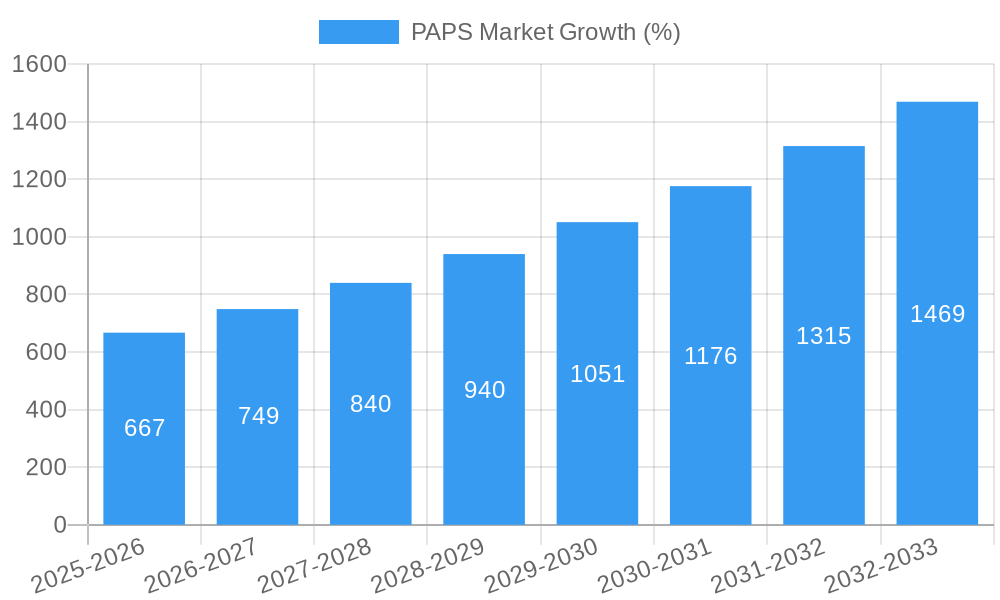
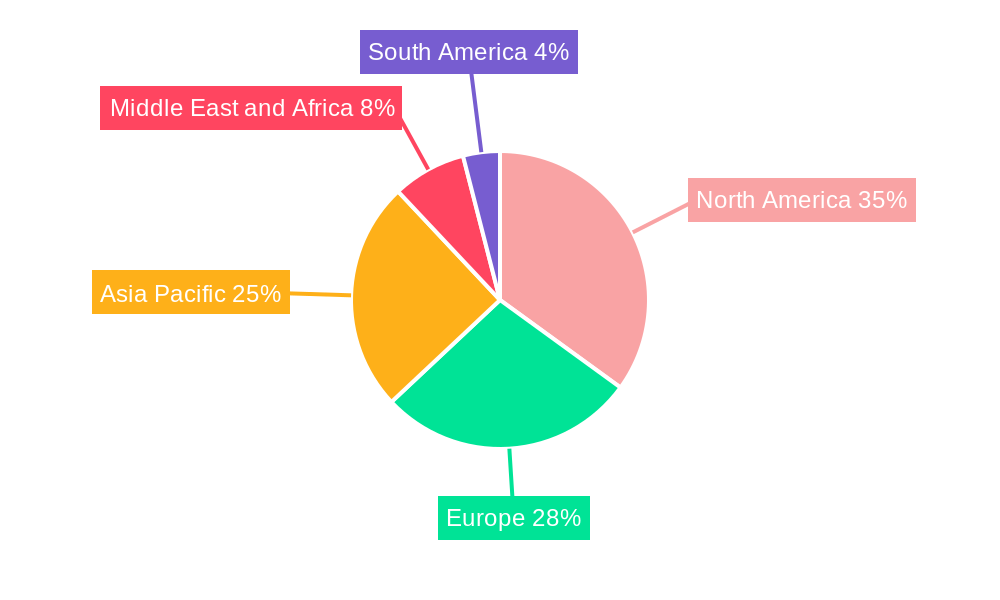
The global PAP smear test market, valued at $6.21 billion in 2025, is projected to experience robust growth, driven by increasing awareness of cervical cancer, expanding screening programs globally, and technological advancements in test accuracy and accessibility. The Compound Annual Growth Rate (CAGR) of 10.70% from 2025 to 2033 indicates significant market expansion. Key growth drivers include rising incidence of HPV infections, particularly in developing nations, coupled with improved healthcare infrastructure and increased access to diagnostic facilities. The market is segmented by test type (HPV test, Pap test, co-testing), application (cervical cancer screening, head and neck cancer screening, other applications), and end-user (hospitals/clinics, diagnostic centers, point-of-care/self-sampling). The high prevalence of cervical cancer, especially in regions with limited access to regular screening, presents a significant opportunity for market expansion. However, factors such as the high cost of advanced testing technologies and potential variations in reimbursement policies across different healthcare systems may pose challenges to market growth. The competitive landscape is characterized by major players like Becton Dickinson, Danaher Corporation, and Hologic, who are continuously investing in research and development to improve testing technologies and expand their market reach. The geographical distribution of the market is diverse, with North America and Europe currently holding significant shares, while the Asia-Pacific region is projected to witness substantial growth due to rising healthcare spending and increased awareness.
Further fueling market growth is the increasing adoption of point-of-care and self-sampling techniques, which offer convenience and accessibility to a wider patient population. These methods are especially beneficial in underserved communities and countries with limited healthcare infrastructure. The integration of artificial intelligence (AI) and machine learning (ML) into PAP smear analysis is another significant development improving diagnostic accuracy and efficiency. However, challenges remain in addressing the disparity in access to screening, particularly in low-income and rural areas. Ongoing efforts to improve healthcare infrastructure and public health awareness campaigns will be crucial in bridging this gap and ensuring equitable access to vital cervical cancer screening. The market is likely to see increased consolidation through mergers and acquisitions, driving innovation and further shaping the competitive landscape.
PAPS Market Report: Comprehensive Analysis and Forecast (2019-2033)
This comprehensive report provides a detailed analysis of the PAPS (Papanicolaou test) market, offering invaluable insights for stakeholders across the healthcare industry. With a focus on market dynamics, key players, and future trends, this report covers the period from 2019 to 2033, with a base year of 2025 and an estimated year of 2025. The study encompasses various segments including test types (HPV Test, Pap Test, Co-testing), applications (Cervical Cancer Screening Tests, Head and Neck Cancer Screening Tests, Other Applications), and end-users (Hospitals/Clinics, Diagnostic Centers, Point-of-care/Self-sampling). The market size is projected to reach xx Million by 2033, exhibiting a CAGR of xx% during the forecast period (2025-2033).
PAPS Market Market Concentration & Dynamics
The PAPS market exhibits a moderately concentrated landscape, with key players like Becton Dickinson and Company, Danaher Corporation (Cepheid), Hologic Inc., and Abbott Laboratories holding significant market share. The market share distribution shows a dynamic interplay of established players and emerging companies. Innovation within the PAPS market is driven by advancements in molecular diagnostics, AI-powered analysis, and point-of-care testing technologies. Regulatory frameworks, particularly FDA approvals, significantly influence market growth and product adoption. Substitute products, such as alternative cancer screening methods, present a degree of competitive pressure. End-user trends show a preference for faster, more accurate, and less invasive testing methods. M&A activity in the sector has been moderate, with xx deals recorded between 2019 and 2024, indicating a strategic focus on consolidation and expansion within the industry.
- Market Concentration: Moderately concentrated, with top 4 players holding approximately xx% market share in 2024.
- Innovation Ecosystem: Strong, driven by advancements in molecular diagnostics and AI.
- Regulatory Frameworks: Significant influence, with FDA approvals shaping product adoption.
- Substitute Products: Presence of alternative cancer screening methods poses moderate competitive pressure.
- End-User Trends: Demand for faster, accurate, and less invasive tests is increasing.
- M&A Activities: Moderate activity, with xx M&A deals recorded between 2019 and 2024.
PAPS Market Industry Insights & Trends
The PAPS market is experiencing significant growth driven by the increasing prevalence of cervical and head and neck cancers, along with rising awareness about preventative healthcare. Technological advancements, particularly in HPV testing and molecular diagnostics, are revolutionizing the accuracy and efficiency of PAPS screenings. The shift towards point-of-care testing and self-sampling is gaining momentum, improving accessibility and reducing costs. Consumer behavior is increasingly influenced by convenience, speed, and early detection capabilities. The global PAPS market size was valued at xx Million in 2024 and is projected to reach xx Million by 2033, registering a CAGR of xx% during the forecast period. This growth is fueled by factors such as increased government initiatives promoting cervical cancer screening, rising disposable incomes in developing economies, and the increasing adoption of advanced diagnostic technologies. However, challenges such as high testing costs and limited access to healthcare in some regions might hinder market growth.
Key Markets & Segments Leading PAPS Market
The North American market currently holds the largest share of the global PAPS market, driven by high healthcare expenditure, advanced infrastructure, and strong regulatory support. Within the segments, the HPV test is the fastest-growing segment due to its superior sensitivity and specificity in detecting high-risk HPV infections. Cervical cancer screening continues to dominate applications, while the head and neck cancer screening segment is showing strong growth potential. Hospitals and clinics remain the primary end-users, although the point-of-care/self-sampling segment is rapidly gaining traction.
- Dominant Region: North America
- Fastest-Growing Segment (Test Type): HPV Test
- Dominant Application: Cervical Cancer Screening Tests
- Primary End-User: Hospitals/Clinics
Drivers for North American Dominance:
- High healthcare expenditure and insurance coverage.
- Well-developed healthcare infrastructure.
- Strong regulatory support for innovative diagnostic technologies.
- High awareness about cervical cancer screening.
PAPS Market Product Developments
Recent product developments focus on improving the accuracy, sensitivity, and speed of PAPS testing. This includes the integration of molecular diagnostics, AI-powered image analysis, and the development of point-of-care testing devices. Companies are also focusing on developing HPV assays that offer more comprehensive genotype reporting, leading to more accurate risk stratification for patients. These innovations aim to enhance early detection rates and improve patient outcomes, driving market competitiveness.
Challenges in the PAPS Market Market
Challenges in the PAPS market include high testing costs, particularly in low- and middle-income countries, limiting access to screening programs. Supply chain disruptions and the availability of skilled healthcare professionals can also affect the market's growth. Stringent regulatory approvals and intense competition from established players and new entrants pose additional hurdles. These factors collectively restrict market penetration and impact the overall growth rate.
Forces Driving PAPS Market Growth
Several factors drive PAPS market growth. Technological advancements, like improved HPV testing and AI-powered analysis, enhance accuracy and efficiency. Government initiatives promoting cervical cancer screening increase awareness and access to testing. Rising disposable incomes in developing economies expand the market's reach. Furthermore, increased awareness of cervical cancer among the general population fuels demand for preventative measures.
Challenges in the PAPS Market Market (Long-Term Growth Catalysts)
Long-term growth will be fueled by continuous innovation in diagnostic technologies, strategic partnerships between healthcare providers and diagnostic companies, and expansion into underserved markets globally. The development of more affordable and accessible testing methods will be crucial in driving broader adoption.
Emerging Opportunities in PAPS Market
Emerging opportunities lie in the development of at-home self-sampling kits, integration of telehealth platforms for remote monitoring, and expansion into the head and neck cancer screening market. Personalized medicine approaches, leveraging genomic data for targeted screening strategies, present significant potential. Focus on improving patient accessibility and affordability remains key to unlocking market growth.
Leading Players in the PAPS Market Sector
- Becton Dickinson and Company
- Danaher Corporation (Cepheid)
- TruScreen
- Hologic Inc
- Seegene Inc
- Abbott Laboratories
- Takara Bio Inc
- Arbor Vita Corporation
- F Hoffmann-La Roche AG
- OncoHealth Corporation
- Promega Corporation
- Qiagen NV
Key Milestones in PAPS Market Industry
- November 2023: Abbott's molecular HPV screening solution received FDA approval, expanding the Alinity m family and providing a valuable cancer screening tool.
- February 2023: The FDA approved BD’s HPV assay for use with a Hologic test, enhancing the capabilities of the BD Onclarity HPV Assay by including reporting on specific HPV genotypes (31, 51, 52, 33/58, 35/39/68, and 56/59/66).
Strategic Outlook for PAPS Market Market
The PAPS market holds significant future potential, driven by technological innovations, expanding applications, and growing awareness of preventative healthcare. Strategic opportunities lie in developing cost-effective, accessible testing solutions for underserved populations and expanding into new markets globally. Partnerships and collaborations will play a vital role in driving market growth and improving patient outcomes.
PAPS Market Segmentation
-
1. Test Type
- 1.1. HPV Test
- 1.2. Pap Test
- 1.3. Co-testing
-
2. Application
- 2.1. Cervical Cancer Screening Tests
- 2.2. Head and Neck Cancer Screening Tests
- 2.3. Other Applications
-
3. End User
- 3.1. Hospitals/Clinics
- 3.2. Diagnostic Centers
- 3.3. Point-of-care/Self-sampling
PAPS Market Segmentation By Geography
-
1. North America
- 1.1. United States
- 1.2. Canada
- 1.3. Mexico
-
2. Europe
- 2.1. Germany
- 2.2. United Kingdom
- 2.3. France
- 2.4. Italy
- 2.5. Spain
- 2.6. Rest of Europe
-
3. Asia Pacific
- 3.1. China
- 3.2. Japan
- 3.3. India
- 3.4. Australia
- 3.5. South Korea
- 3.6. Rest of Asia Pacific
-
4. Middle East and Africa
- 4.1. GCC
- 4.2. South Africa
- 4.3. Rest of Middle East and Africa
-
5. South America
- 5.1. Brazil
- 5.2. Argentina
- 5.3. Rest of South America
PAPS Market REPORT HIGHLIGHTS
| Aspects | Details |
|---|---|
| Study Period | 2019-2033 |
| Base Year | 2024 |
| Estimated Year | 2025 |
| Forecast Period | 2025-2033 |
| Historical Period | 2019-2024 |
| Growth Rate | CAGR of 10.70% from 2019-2033 |
| Segmentation |
|
Table of Contents
- 1. Introduction
- 1.1. Research Scope
- 1.2. Market Segmentation
- 1.3. Research Methodology
- 1.4. Definitions and Assumptions
- 2. Executive Summary
- 2.1. Introduction
- 3. Market Dynamics
- 3.1. Introduction
- 3.2. Market Drivers
- 3.2.1. Increasing Number of Cervical Cancer Cases; Increasing Number of Cervical Cancer Screening Programs; Introduction to Advanced Technologies
- 3.3. Market Restrains
- 3.3.1. HPV Vaccination; Changes in Regulatory Guidelines for Cervical Cancer Screening
- 3.4. Market Trends
- 3.4.1. The Cervical Cancer Screening Test Segment is Expected to be Dominant During the Forecast Period
- 4. Market Factor Analysis
- 4.1. Porters Five Forces
- 4.2. Supply/Value Chain
- 4.3. PESTEL analysis
- 4.4. Market Entropy
- 4.5. Patent/Trademark Analysis
- 5. Global PAPS Market Analysis, Insights and Forecast, 2019-2031
- 5.1. Market Analysis, Insights and Forecast - by Test Type
- 5.1.1. HPV Test
- 5.1.2. Pap Test
- 5.1.3. Co-testing
- 5.2. Market Analysis, Insights and Forecast - by Application
- 5.2.1. Cervical Cancer Screening Tests
- 5.2.2. Head and Neck Cancer Screening Tests
- 5.2.3. Other Applications
- 5.3. Market Analysis, Insights and Forecast - by End User
- 5.3.1. Hospitals/Clinics
- 5.3.2. Diagnostic Centers
- 5.3.3. Point-of-care/Self-sampling
- 5.4. Market Analysis, Insights and Forecast - by Region
- 5.4.1. North America
- 5.4.2. Europe
- 5.4.3. Asia Pacific
- 5.4.4. Middle East and Africa
- 5.4.5. South America
- 5.1. Market Analysis, Insights and Forecast - by Test Type
- 6. North America PAPS Market Analysis, Insights and Forecast, 2019-2031
- 6.1. Market Analysis, Insights and Forecast - by Test Type
- 6.1.1. HPV Test
- 6.1.2. Pap Test
- 6.1.3. Co-testing
- 6.2. Market Analysis, Insights and Forecast - by Application
- 6.2.1. Cervical Cancer Screening Tests
- 6.2.2. Head and Neck Cancer Screening Tests
- 6.2.3. Other Applications
- 6.3. Market Analysis, Insights and Forecast - by End User
- 6.3.1. Hospitals/Clinics
- 6.3.2. Diagnostic Centers
- 6.3.3. Point-of-care/Self-sampling
- 6.1. Market Analysis, Insights and Forecast - by Test Type
- 7. Europe PAPS Market Analysis, Insights and Forecast, 2019-2031
- 7.1. Market Analysis, Insights and Forecast - by Test Type
- 7.1.1. HPV Test
- 7.1.2. Pap Test
- 7.1.3. Co-testing
- 7.2. Market Analysis, Insights and Forecast - by Application
- 7.2.1. Cervical Cancer Screening Tests
- 7.2.2. Head and Neck Cancer Screening Tests
- 7.2.3. Other Applications
- 7.3. Market Analysis, Insights and Forecast - by End User
- 7.3.1. Hospitals/Clinics
- 7.3.2. Diagnostic Centers
- 7.3.3. Point-of-care/Self-sampling
- 7.1. Market Analysis, Insights and Forecast - by Test Type
- 8. Asia Pacific PAPS Market Analysis, Insights and Forecast, 2019-2031
- 8.1. Market Analysis, Insights and Forecast - by Test Type
- 8.1.1. HPV Test
- 8.1.2. Pap Test
- 8.1.3. Co-testing
- 8.2. Market Analysis, Insights and Forecast - by Application
- 8.2.1. Cervical Cancer Screening Tests
- 8.2.2. Head and Neck Cancer Screening Tests
- 8.2.3. Other Applications
- 8.3. Market Analysis, Insights and Forecast - by End User
- 8.3.1. Hospitals/Clinics
- 8.3.2. Diagnostic Centers
- 8.3.3. Point-of-care/Self-sampling
- 8.1. Market Analysis, Insights and Forecast - by Test Type
- 9. Middle East and Africa PAPS Market Analysis, Insights and Forecast, 2019-2031
- 9.1. Market Analysis, Insights and Forecast - by Test Type
- 9.1.1. HPV Test
- 9.1.2. Pap Test
- 9.1.3. Co-testing
- 9.2. Market Analysis, Insights and Forecast - by Application
- 9.2.1. Cervical Cancer Screening Tests
- 9.2.2. Head and Neck Cancer Screening Tests
- 9.2.3. Other Applications
- 9.3. Market Analysis, Insights and Forecast - by End User
- 9.3.1. Hospitals/Clinics
- 9.3.2. Diagnostic Centers
- 9.3.3. Point-of-care/Self-sampling
- 9.1. Market Analysis, Insights and Forecast - by Test Type
- 10. South America PAPS Market Analysis, Insights and Forecast, 2019-2031
- 10.1. Market Analysis, Insights and Forecast - by Test Type
- 10.1.1. HPV Test
- 10.1.2. Pap Test
- 10.1.3. Co-testing
- 10.2. Market Analysis, Insights and Forecast - by Application
- 10.2.1. Cervical Cancer Screening Tests
- 10.2.2. Head and Neck Cancer Screening Tests
- 10.2.3. Other Applications
- 10.3. Market Analysis, Insights and Forecast - by End User
- 10.3.1. Hospitals/Clinics
- 10.3.2. Diagnostic Centers
- 10.3.3. Point-of-care/Self-sampling
- 10.1. Market Analysis, Insights and Forecast - by Test Type
- 11. North America PAPS Market Analysis, Insights and Forecast, 2019-2031
- 11.1. Market Analysis, Insights and Forecast - By Country/Sub-region
- 11.1.1 United States
- 11.1.2 Canada
- 11.1.3 Mexico
- 12. Europe PAPS Market Analysis, Insights and Forecast, 2019-2031
- 12.1. Market Analysis, Insights and Forecast - By Country/Sub-region
- 12.1.1 Germany
- 12.1.2 United Kingdom
- 12.1.3 France
- 12.1.4 Italy
- 12.1.5 Spain
- 12.1.6 Rest of Europe
- 13. Asia Pacific PAPS Market Analysis, Insights and Forecast, 2019-2031
- 13.1. Market Analysis, Insights and Forecast - By Country/Sub-region
- 13.1.1 China
- 13.1.2 Japan
- 13.1.3 India
- 13.1.4 Australia
- 13.1.5 South Korea
- 13.1.6 Rest of Asia Pacific
- 14. Middle East and Africa PAPS Market Analysis, Insights and Forecast, 2019-2031
- 14.1. Market Analysis, Insights and Forecast - By Country/Sub-region
- 14.1.1 GCC
- 14.1.2 South Africa
- 14.1.3 Rest of Middle East and Africa
- 15. South America PAPS Market Analysis, Insights and Forecast, 2019-2031
- 15.1. Market Analysis, Insights and Forecast - By Country/Sub-region
- 15.1.1 Brazil
- 15.1.2 Argentina
- 15.1.3 Rest of South America
- 16. Competitive Analysis
- 16.1. Global Market Share Analysis 2024
- 16.2. Company Profiles
- 16.2.1 Becton Dickinson and Company
- 16.2.1.1. Overview
- 16.2.1.2. Products
- 16.2.1.3. SWOT Analysis
- 16.2.1.4. Recent Developments
- 16.2.1.5. Financials (Based on Availability)
- 16.2.2 Danaher Corporation (Cepheid)
- 16.2.2.1. Overview
- 16.2.2.2. Products
- 16.2.2.3. SWOT Analysis
- 16.2.2.4. Recent Developments
- 16.2.2.5. Financials (Based on Availability)
- 16.2.3 TruScreen
- 16.2.3.1. Overview
- 16.2.3.2. Products
- 16.2.3.3. SWOT Analysis
- 16.2.3.4. Recent Developments
- 16.2.3.5. Financials (Based on Availability)
- 16.2.4 Hologic Inc
- 16.2.4.1. Overview
- 16.2.4.2. Products
- 16.2.4.3. SWOT Analysis
- 16.2.4.4. Recent Developments
- 16.2.4.5. Financials (Based on Availability)
- 16.2.5 Seegene Inc
- 16.2.5.1. Overview
- 16.2.5.2. Products
- 16.2.5.3. SWOT Analysis
- 16.2.5.4. Recent Developments
- 16.2.5.5. Financials (Based on Availability)
- 16.2.6 Abbott Laboratories
- 16.2.6.1. Overview
- 16.2.6.2. Products
- 16.2.6.3. SWOT Analysis
- 16.2.6.4. Recent Developments
- 16.2.6.5. Financials (Based on Availability)
- 16.2.7 Takara Bio Inc
- 16.2.7.1. Overview
- 16.2.7.2. Products
- 16.2.7.3. SWOT Analysis
- 16.2.7.4. Recent Developments
- 16.2.7.5. Financials (Based on Availability)
- 16.2.8 Arbor Vita Corporation
- 16.2.8.1. Overview
- 16.2.8.2. Products
- 16.2.8.3. SWOT Analysis
- 16.2.8.4. Recent Developments
- 16.2.8.5. Financials (Based on Availability)
- 16.2.9 F Hoffmann-La Roche AG
- 16.2.9.1. Overview
- 16.2.9.2. Products
- 16.2.9.3. SWOT Analysis
- 16.2.9.4. Recent Developments
- 16.2.9.5. Financials (Based on Availability)
- 16.2.10 OncoHealth Corporation
- 16.2.10.1. Overview
- 16.2.10.2. Products
- 16.2.10.3. SWOT Analysis
- 16.2.10.4. Recent Developments
- 16.2.10.5. Financials (Based on Availability)
- 16.2.11 Promega Corporation
- 16.2.11.1. Overview
- 16.2.11.2. Products
- 16.2.11.3. SWOT Analysis
- 16.2.11.4. Recent Developments
- 16.2.11.5. Financials (Based on Availability)
- 16.2.12 Qiagen NV
- 16.2.12.1. Overview
- 16.2.12.2. Products
- 16.2.12.3. SWOT Analysis
- 16.2.12.4. Recent Developments
- 16.2.12.5. Financials (Based on Availability)
- 16.2.1 Becton Dickinson and Company
List of Figures
- Figure 1: Global PAPS Market Revenue Breakdown (Million, %) by Region 2024 & 2032
- Figure 2: Global PAPS Market Volume Breakdown (K Unit, %) by Region 2024 & 2032
- Figure 3: North America PAPS Market Revenue (Million), by Country 2024 & 2032
- Figure 4: North America PAPS Market Volume (K Unit), by Country 2024 & 2032
- Figure 5: North America PAPS Market Revenue Share (%), by Country 2024 & 2032
- Figure 6: North America PAPS Market Volume Share (%), by Country 2024 & 2032
- Figure 7: Europe PAPS Market Revenue (Million), by Country 2024 & 2032
- Figure 8: Europe PAPS Market Volume (K Unit), by Country 2024 & 2032
- Figure 9: Europe PAPS Market Revenue Share (%), by Country 2024 & 2032
- Figure 10: Europe PAPS Market Volume Share (%), by Country 2024 & 2032
- Figure 11: Asia Pacific PAPS Market Revenue (Million), by Country 2024 & 2032
- Figure 12: Asia Pacific PAPS Market Volume (K Unit), by Country 2024 & 2032
- Figure 13: Asia Pacific PAPS Market Revenue Share (%), by Country 2024 & 2032
- Figure 14: Asia Pacific PAPS Market Volume Share (%), by Country 2024 & 2032
- Figure 15: Middle East and Africa PAPS Market Revenue (Million), by Country 2024 & 2032
- Figure 16: Middle East and Africa PAPS Market Volume (K Unit), by Country 2024 & 2032
- Figure 17: Middle East and Africa PAPS Market Revenue Share (%), by Country 2024 & 2032
- Figure 18: Middle East and Africa PAPS Market Volume Share (%), by Country 2024 & 2032
- Figure 19: South America PAPS Market Revenue (Million), by Country 2024 & 2032
- Figure 20: South America PAPS Market Volume (K Unit), by Country 2024 & 2032
- Figure 21: South America PAPS Market Revenue Share (%), by Country 2024 & 2032
- Figure 22: South America PAPS Market Volume Share (%), by Country 2024 & 2032
- Figure 23: North America PAPS Market Revenue (Million), by Test Type 2024 & 2032
- Figure 24: North America PAPS Market Volume (K Unit), by Test Type 2024 & 2032
- Figure 25: North America PAPS Market Revenue Share (%), by Test Type 2024 & 2032
- Figure 26: North America PAPS Market Volume Share (%), by Test Type 2024 & 2032
- Figure 27: North America PAPS Market Revenue (Million), by Application 2024 & 2032
- Figure 28: North America PAPS Market Volume (K Unit), by Application 2024 & 2032
- Figure 29: North America PAPS Market Revenue Share (%), by Application 2024 & 2032
- Figure 30: North America PAPS Market Volume Share (%), by Application 2024 & 2032
- Figure 31: North America PAPS Market Revenue (Million), by End User 2024 & 2032
- Figure 32: North America PAPS Market Volume (K Unit), by End User 2024 & 2032
- Figure 33: North America PAPS Market Revenue Share (%), by End User 2024 & 2032
- Figure 34: North America PAPS Market Volume Share (%), by End User 2024 & 2032
- Figure 35: North America PAPS Market Revenue (Million), by Country 2024 & 2032
- Figure 36: North America PAPS Market Volume (K Unit), by Country 2024 & 2032
- Figure 37: North America PAPS Market Revenue Share (%), by Country 2024 & 2032
- Figure 38: North America PAPS Market Volume Share (%), by Country 2024 & 2032
- Figure 39: Europe PAPS Market Revenue (Million), by Test Type 2024 & 2032
- Figure 40: Europe PAPS Market Volume (K Unit), by Test Type 2024 & 2032
- Figure 41: Europe PAPS Market Revenue Share (%), by Test Type 2024 & 2032
- Figure 42: Europe PAPS Market Volume Share (%), by Test Type 2024 & 2032
- Figure 43: Europe PAPS Market Revenue (Million), by Application 2024 & 2032
- Figure 44: Europe PAPS Market Volume (K Unit), by Application 2024 & 2032
- Figure 45: Europe PAPS Market Revenue Share (%), by Application 2024 & 2032
- Figure 46: Europe PAPS Market Volume Share (%), by Application 2024 & 2032
- Figure 47: Europe PAPS Market Revenue (Million), by End User 2024 & 2032
- Figure 48: Europe PAPS Market Volume (K Unit), by End User 2024 & 2032
- Figure 49: Europe PAPS Market Revenue Share (%), by End User 2024 & 2032
- Figure 50: Europe PAPS Market Volume Share (%), by End User 2024 & 2032
- Figure 51: Europe PAPS Market Revenue (Million), by Country 2024 & 2032
- Figure 52: Europe PAPS Market Volume (K Unit), by Country 2024 & 2032
- Figure 53: Europe PAPS Market Revenue Share (%), by Country 2024 & 2032
- Figure 54: Europe PAPS Market Volume Share (%), by Country 2024 & 2032
- Figure 55: Asia Pacific PAPS Market Revenue (Million), by Test Type 2024 & 2032
- Figure 56: Asia Pacific PAPS Market Volume (K Unit), by Test Type 2024 & 2032
- Figure 57: Asia Pacific PAPS Market Revenue Share (%), by Test Type 2024 & 2032
- Figure 58: Asia Pacific PAPS Market Volume Share (%), by Test Type 2024 & 2032
- Figure 59: Asia Pacific PAPS Market Revenue (Million), by Application 2024 & 2032
- Figure 60: Asia Pacific PAPS Market Volume (K Unit), by Application 2024 & 2032
- Figure 61: Asia Pacific PAPS Market Revenue Share (%), by Application 2024 & 2032
- Figure 62: Asia Pacific PAPS Market Volume Share (%), by Application 2024 & 2032
- Figure 63: Asia Pacific PAPS Market Revenue (Million), by End User 2024 & 2032
- Figure 64: Asia Pacific PAPS Market Volume (K Unit), by End User 2024 & 2032
- Figure 65: Asia Pacific PAPS Market Revenue Share (%), by End User 2024 & 2032
- Figure 66: Asia Pacific PAPS Market Volume Share (%), by End User 2024 & 2032
- Figure 67: Asia Pacific PAPS Market Revenue (Million), by Country 2024 & 2032
- Figure 68: Asia Pacific PAPS Market Volume (K Unit), by Country 2024 & 2032
- Figure 69: Asia Pacific PAPS Market Revenue Share (%), by Country 2024 & 2032
- Figure 70: Asia Pacific PAPS Market Volume Share (%), by Country 2024 & 2032
- Figure 71: Middle East and Africa PAPS Market Revenue (Million), by Test Type 2024 & 2032
- Figure 72: Middle East and Africa PAPS Market Volume (K Unit), by Test Type 2024 & 2032
- Figure 73: Middle East and Africa PAPS Market Revenue Share (%), by Test Type 2024 & 2032
- Figure 74: Middle East and Africa PAPS Market Volume Share (%), by Test Type 2024 & 2032
- Figure 75: Middle East and Africa PAPS Market Revenue (Million), by Application 2024 & 2032
- Figure 76: Middle East and Africa PAPS Market Volume (K Unit), by Application 2024 & 2032
- Figure 77: Middle East and Africa PAPS Market Revenue Share (%), by Application 2024 & 2032
- Figure 78: Middle East and Africa PAPS Market Volume Share (%), by Application 2024 & 2032
- Figure 79: Middle East and Africa PAPS Market Revenue (Million), by End User 2024 & 2032
- Figure 80: Middle East and Africa PAPS Market Volume (K Unit), by End User 2024 & 2032
- Figure 81: Middle East and Africa PAPS Market Revenue Share (%), by End User 2024 & 2032
- Figure 82: Middle East and Africa PAPS Market Volume Share (%), by End User 2024 & 2032
- Figure 83: Middle East and Africa PAPS Market Revenue (Million), by Country 2024 & 2032
- Figure 84: Middle East and Africa PAPS Market Volume (K Unit), by Country 2024 & 2032
- Figure 85: Middle East and Africa PAPS Market Revenue Share (%), by Country 2024 & 2032
- Figure 86: Middle East and Africa PAPS Market Volume Share (%), by Country 2024 & 2032
- Figure 87: South America PAPS Market Revenue (Million), by Test Type 2024 & 2032
- Figure 88: South America PAPS Market Volume (K Unit), by Test Type 2024 & 2032
- Figure 89: South America PAPS Market Revenue Share (%), by Test Type 2024 & 2032
- Figure 90: South America PAPS Market Volume Share (%), by Test Type 2024 & 2032
- Figure 91: South America PAPS Market Revenue (Million), by Application 2024 & 2032
- Figure 92: South America PAPS Market Volume (K Unit), by Application 2024 & 2032
- Figure 93: South America PAPS Market Revenue Share (%), by Application 2024 & 2032
- Figure 94: South America PAPS Market Volume Share (%), by Application 2024 & 2032
- Figure 95: South America PAPS Market Revenue (Million), by End User 2024 & 2032
- Figure 96: South America PAPS Market Volume (K Unit), by End User 2024 & 2032
- Figure 97: South America PAPS Market Revenue Share (%), by End User 2024 & 2032
- Figure 98: South America PAPS Market Volume Share (%), by End User 2024 & 2032
- Figure 99: South America PAPS Market Revenue (Million), by Country 2024 & 2032
- Figure 100: South America PAPS Market Volume (K Unit), by Country 2024 & 2032
- Figure 101: South America PAPS Market Revenue Share (%), by Country 2024 & 2032
- Figure 102: South America PAPS Market Volume Share (%), by Country 2024 & 2032
List of Tables
- Table 1: Global PAPS Market Revenue Million Forecast, by Region 2019 & 2032
- Table 2: Global PAPS Market Volume K Unit Forecast, by Region 2019 & 2032
- Table 3: Global PAPS Market Revenue Million Forecast, by Test Type 2019 & 2032
- Table 4: Global PAPS Market Volume K Unit Forecast, by Test Type 2019 & 2032
- Table 5: Global PAPS Market Revenue Million Forecast, by Application 2019 & 2032
- Table 6: Global PAPS Market Volume K Unit Forecast, by Application 2019 & 2032
- Table 7: Global PAPS Market Revenue Million Forecast, by End User 2019 & 2032
- Table 8: Global PAPS Market Volume K Unit Forecast, by End User 2019 & 2032
- Table 9: Global PAPS Market Revenue Million Forecast, by Region 2019 & 2032
- Table 10: Global PAPS Market Volume K Unit Forecast, by Region 2019 & 2032
- Table 11: Global PAPS Market Revenue Million Forecast, by Country 2019 & 2032
- Table 12: Global PAPS Market Volume K Unit Forecast, by Country 2019 & 2032
- Table 13: United States PAPS Market Revenue (Million) Forecast, by Application 2019 & 2032
- Table 14: United States PAPS Market Volume (K Unit) Forecast, by Application 2019 & 2032
- Table 15: Canada PAPS Market Revenue (Million) Forecast, by Application 2019 & 2032
- Table 16: Canada PAPS Market Volume (K Unit) Forecast, by Application 2019 & 2032
- Table 17: Mexico PAPS Market Revenue (Million) Forecast, by Application 2019 & 2032
- Table 18: Mexico PAPS Market Volume (K Unit) Forecast, by Application 2019 & 2032
- Table 19: Global PAPS Market Revenue Million Forecast, by Country 2019 & 2032
- Table 20: Global PAPS Market Volume K Unit Forecast, by Country 2019 & 2032
- Table 21: Germany PAPS Market Revenue (Million) Forecast, by Application 2019 & 2032
- Table 22: Germany PAPS Market Volume (K Unit) Forecast, by Application 2019 & 2032
- Table 23: United Kingdom PAPS Market Revenue (Million) Forecast, by Application 2019 & 2032
- Table 24: United Kingdom PAPS Market Volume (K Unit) Forecast, by Application 2019 & 2032
- Table 25: France PAPS Market Revenue (Million) Forecast, by Application 2019 & 2032
- Table 26: France PAPS Market Volume (K Unit) Forecast, by Application 2019 & 2032
- Table 27: Italy PAPS Market Revenue (Million) Forecast, by Application 2019 & 2032
- Table 28: Italy PAPS Market Volume (K Unit) Forecast, by Application 2019 & 2032
- Table 29: Spain PAPS Market Revenue (Million) Forecast, by Application 2019 & 2032
- Table 30: Spain PAPS Market Volume (K Unit) Forecast, by Application 2019 & 2032
- Table 31: Rest of Europe PAPS Market Revenue (Million) Forecast, by Application 2019 & 2032
- Table 32: Rest of Europe PAPS Market Volume (K Unit) Forecast, by Application 2019 & 2032
- Table 33: Global PAPS Market Revenue Million Forecast, by Country 2019 & 2032
- Table 34: Global PAPS Market Volume K Unit Forecast, by Country 2019 & 2032
- Table 35: China PAPS Market Revenue (Million) Forecast, by Application 2019 & 2032
- Table 36: China PAPS Market Volume (K Unit) Forecast, by Application 2019 & 2032
- Table 37: Japan PAPS Market Revenue (Million) Forecast, by Application 2019 & 2032
- Table 38: Japan PAPS Market Volume (K Unit) Forecast, by Application 2019 & 2032
- Table 39: India PAPS Market Revenue (Million) Forecast, by Application 2019 & 2032
- Table 40: India PAPS Market Volume (K Unit) Forecast, by Application 2019 & 2032
- Table 41: Australia PAPS Market Revenue (Million) Forecast, by Application 2019 & 2032
- Table 42: Australia PAPS Market Volume (K Unit) Forecast, by Application 2019 & 2032
- Table 43: South Korea PAPS Market Revenue (Million) Forecast, by Application 2019 & 2032
- Table 44: South Korea PAPS Market Volume (K Unit) Forecast, by Application 2019 & 2032
- Table 45: Rest of Asia Pacific PAPS Market Revenue (Million) Forecast, by Application 2019 & 2032
- Table 46: Rest of Asia Pacific PAPS Market Volume (K Unit) Forecast, by Application 2019 & 2032
- Table 47: Global PAPS Market Revenue Million Forecast, by Country 2019 & 2032
- Table 48: Global PAPS Market Volume K Unit Forecast, by Country 2019 & 2032
- Table 49: GCC PAPS Market Revenue (Million) Forecast, by Application 2019 & 2032
- Table 50: GCC PAPS Market Volume (K Unit) Forecast, by Application 2019 & 2032
- Table 51: South Africa PAPS Market Revenue (Million) Forecast, by Application 2019 & 2032
- Table 52: South Africa PAPS Market Volume (K Unit) Forecast, by Application 2019 & 2032
- Table 53: Rest of Middle East and Africa PAPS Market Revenue (Million) Forecast, by Application 2019 & 2032
- Table 54: Rest of Middle East and Africa PAPS Market Volume (K Unit) Forecast, by Application 2019 & 2032
- Table 55: Global PAPS Market Revenue Million Forecast, by Country 2019 & 2032
- Table 56: Global PAPS Market Volume K Unit Forecast, by Country 2019 & 2032
- Table 57: Brazil PAPS Market Revenue (Million) Forecast, by Application 2019 & 2032
- Table 58: Brazil PAPS Market Volume (K Unit) Forecast, by Application 2019 & 2032
- Table 59: Argentina PAPS Market Revenue (Million) Forecast, by Application 2019 & 2032
- Table 60: Argentina PAPS Market Volume (K Unit) Forecast, by Application 2019 & 2032
- Table 61: Rest of South America PAPS Market Revenue (Million) Forecast, by Application 2019 & 2032
- Table 62: Rest of South America PAPS Market Volume (K Unit) Forecast, by Application 2019 & 2032
- Table 63: Global PAPS Market Revenue Million Forecast, by Test Type 2019 & 2032
- Table 64: Global PAPS Market Volume K Unit Forecast, by Test Type 2019 & 2032
- Table 65: Global PAPS Market Revenue Million Forecast, by Application 2019 & 2032
- Table 66: Global PAPS Market Volume K Unit Forecast, by Application 2019 & 2032
- Table 67: Global PAPS Market Revenue Million Forecast, by End User 2019 & 2032
- Table 68: Global PAPS Market Volume K Unit Forecast, by End User 2019 & 2032
- Table 69: Global PAPS Market Revenue Million Forecast, by Country 2019 & 2032
- Table 70: Global PAPS Market Volume K Unit Forecast, by Country 2019 & 2032
- Table 71: United States PAPS Market Revenue (Million) Forecast, by Application 2019 & 2032
- Table 72: United States PAPS Market Volume (K Unit) Forecast, by Application 2019 & 2032
- Table 73: Canada PAPS Market Revenue (Million) Forecast, by Application 2019 & 2032
- Table 74: Canada PAPS Market Volume (K Unit) Forecast, by Application 2019 & 2032
- Table 75: Mexico PAPS Market Revenue (Million) Forecast, by Application 2019 & 2032
- Table 76: Mexico PAPS Market Volume (K Unit) Forecast, by Application 2019 & 2032
- Table 77: Global PAPS Market Revenue Million Forecast, by Test Type 2019 & 2032
- Table 78: Global PAPS Market Volume K Unit Forecast, by Test Type 2019 & 2032
- Table 79: Global PAPS Market Revenue Million Forecast, by Application 2019 & 2032
- Table 80: Global PAPS Market Volume K Unit Forecast, by Application 2019 & 2032
- Table 81: Global PAPS Market Revenue Million Forecast, by End User 2019 & 2032
- Table 82: Global PAPS Market Volume K Unit Forecast, by End User 2019 & 2032
- Table 83: Global PAPS Market Revenue Million Forecast, by Country 2019 & 2032
- Table 84: Global PAPS Market Volume K Unit Forecast, by Country 2019 & 2032
- Table 85: Germany PAPS Market Revenue (Million) Forecast, by Application 2019 & 2032
- Table 86: Germany PAPS Market Volume (K Unit) Forecast, by Application 2019 & 2032
- Table 87: United Kingdom PAPS Market Revenue (Million) Forecast, by Application 2019 & 2032
- Table 88: United Kingdom PAPS Market Volume (K Unit) Forecast, by Application 2019 & 2032
- Table 89: France PAPS Market Revenue (Million) Forecast, by Application 2019 & 2032
- Table 90: France PAPS Market Volume (K Unit) Forecast, by Application 2019 & 2032
- Table 91: Italy PAPS Market Revenue (Million) Forecast, by Application 2019 & 2032
- Table 92: Italy PAPS Market Volume (K Unit) Forecast, by Application 2019 & 2032
- Table 93: Spain PAPS Market Revenue (Million) Forecast, by Application 2019 & 2032
- Table 94: Spain PAPS Market Volume (K Unit) Forecast, by Application 2019 & 2032
- Table 95: Rest of Europe PAPS Market Revenue (Million) Forecast, by Application 2019 & 2032
- Table 96: Rest of Europe PAPS Market Volume (K Unit) Forecast, by Application 2019 & 2032
- Table 97: Global PAPS Market Revenue Million Forecast, by Test Type 2019 & 2032
- Table 98: Global PAPS Market Volume K Unit Forecast, by Test Type 2019 & 2032
- Table 99: Global PAPS Market Revenue Million Forecast, by Application 2019 & 2032
- Table 100: Global PAPS Market Volume K Unit Forecast, by Application 2019 & 2032
- Table 101: Global PAPS Market Revenue Million Forecast, by End User 2019 & 2032
- Table 102: Global PAPS Market Volume K Unit Forecast, by End User 2019 & 2032
- Table 103: Global PAPS Market Revenue Million Forecast, by Country 2019 & 2032
- Table 104: Global PAPS Market Volume K Unit Forecast, by Country 2019 & 2032
- Table 105: China PAPS Market Revenue (Million) Forecast, by Application 2019 & 2032
- Table 106: China PAPS Market Volume (K Unit) Forecast, by Application 2019 & 2032
- Table 107: Japan PAPS Market Revenue (Million) Forecast, by Application 2019 & 2032
- Table 108: Japan PAPS Market Volume (K Unit) Forecast, by Application 2019 & 2032
- Table 109: India PAPS Market Revenue (Million) Forecast, by Application 2019 & 2032
- Table 110: India PAPS Market Volume (K Unit) Forecast, by Application 2019 & 2032
- Table 111: Australia PAPS Market Revenue (Million) Forecast, by Application 2019 & 2032
- Table 112: Australia PAPS Market Volume (K Unit) Forecast, by Application 2019 & 2032
- Table 113: South Korea PAPS Market Revenue (Million) Forecast, by Application 2019 & 2032
- Table 114: South Korea PAPS Market Volume (K Unit) Forecast, by Application 2019 & 2032
- Table 115: Rest of Asia Pacific PAPS Market Revenue (Million) Forecast, by Application 2019 & 2032
- Table 116: Rest of Asia Pacific PAPS Market Volume (K Unit) Forecast, by Application 2019 & 2032
- Table 117: Global PAPS Market Revenue Million Forecast, by Test Type 2019 & 2032
- Table 118: Global PAPS Market Volume K Unit Forecast, by Test Type 2019 & 2032
- Table 119: Global PAPS Market Revenue Million Forecast, by Application 2019 & 2032
- Table 120: Global PAPS Market Volume K Unit Forecast, by Application 2019 & 2032
- Table 121: Global PAPS Market Revenue Million Forecast, by End User 2019 & 2032
- Table 122: Global PAPS Market Volume K Unit Forecast, by End User 2019 & 2032
- Table 123: Global PAPS Market Revenue Million Forecast, by Country 2019 & 2032
- Table 124: Global PAPS Market Volume K Unit Forecast, by Country 2019 & 2032
- Table 125: GCC PAPS Market Revenue (Million) Forecast, by Application 2019 & 2032
- Table 126: GCC PAPS Market Volume (K Unit) Forecast, by Application 2019 & 2032
- Table 127: South Africa PAPS Market Revenue (Million) Forecast, by Application 2019 & 2032
- Table 128: South Africa PAPS Market Volume (K Unit) Forecast, by Application 2019 & 2032
- Table 129: Rest of Middle East and Africa PAPS Market Revenue (Million) Forecast, by Application 2019 & 2032
- Table 130: Rest of Middle East and Africa PAPS Market Volume (K Unit) Forecast, by Application 2019 & 2032
- Table 131: Global PAPS Market Revenue Million Forecast, by Test Type 2019 & 2032
- Table 132: Global PAPS Market Volume K Unit Forecast, by Test Type 2019 & 2032
- Table 133: Global PAPS Market Revenue Million Forecast, by Application 2019 & 2032
- Table 134: Global PAPS Market Volume K Unit Forecast, by Application 2019 & 2032
- Table 135: Global PAPS Market Revenue Million Forecast, by End User 2019 & 2032
- Table 136: Global PAPS Market Volume K Unit Forecast, by End User 2019 & 2032
- Table 137: Global PAPS Market Revenue Million Forecast, by Country 2019 & 2032
- Table 138: Global PAPS Market Volume K Unit Forecast, by Country 2019 & 2032
- Table 139: Brazil PAPS Market Revenue (Million) Forecast, by Application 2019 & 2032
- Table 140: Brazil PAPS Market Volume (K Unit) Forecast, by Application 2019 & 2032
- Table 141: Argentina PAPS Market Revenue (Million) Forecast, by Application 2019 & 2032
- Table 142: Argentina PAPS Market Volume (K Unit) Forecast, by Application 2019 & 2032
- Table 143: Rest of South America PAPS Market Revenue (Million) Forecast, by Application 2019 & 2032
- Table 144: Rest of South America PAPS Market Volume (K Unit) Forecast, by Application 2019 & 2032
Frequently Asked Questions
1. What is the projected Compound Annual Growth Rate (CAGR) of the PAPS Market?
The projected CAGR is approximately 10.70%.
2. Which companies are prominent players in the PAPS Market?
Key companies in the market include Becton Dickinson and Company, Danaher Corporation (Cepheid), TruScreen, Hologic Inc, Seegene Inc, Abbott Laboratories, Takara Bio Inc, Arbor Vita Corporation, F Hoffmann-La Roche AG, OncoHealth Corporation, Promega Corporation, Qiagen NV.
3. What are the main segments of the PAPS Market?
The market segments include Test Type, Application, End User.
4. Can you provide details about the market size?
The market size is estimated to be USD 6.21 Million as of 2022.
5. What are some drivers contributing to market growth?
Increasing Number of Cervical Cancer Cases; Increasing Number of Cervical Cancer Screening Programs; Introduction to Advanced Technologies.
6. What are the notable trends driving market growth?
The Cervical Cancer Screening Test Segment is Expected to be Dominant During the Forecast Period.
7. Are there any restraints impacting market growth?
HPV Vaccination; Changes in Regulatory Guidelines for Cervical Cancer Screening.
8. Can you provide examples of recent developments in the market?
November 2023: Abbott's molecular human papillomavirus (HPV) screening solution was approved by the US Food and Drug Administration (FDA), expanding the range of diagnostic assays within the Alinity m family. This approval introduces a valuable cancer screening tool for the identification of high-risk HPV infections.
9. What pricing options are available for accessing the report?
Pricing options include single-user, multi-user, and enterprise licenses priced at USD 4750, USD 5250, and USD 8750 respectively.
10. Is the market size provided in terms of value or volume?
The market size is provided in terms of value, measured in Million and volume, measured in K Unit.
11. Are there any specific market keywords associated with the report?
Yes, the market keyword associated with the report is "PAPS Market," which aids in identifying and referencing the specific market segment covered.
12. How do I determine which pricing option suits my needs best?
The pricing options vary based on user requirements and access needs. Individual users may opt for single-user licenses, while businesses requiring broader access may choose multi-user or enterprise licenses for cost-effective access to the report.
13. Are there any additional resources or data provided in the PAPS Market report?
While the report offers comprehensive insights, it's advisable to review the specific contents or supplementary materials provided to ascertain if additional resources or data are available.
14. How can I stay updated on further developments or reports in the PAPS Market?
To stay informed about further developments, trends, and reports in the PAPS Market, consider subscribing to industry newsletters, following relevant companies and organizations, or regularly checking reputable industry news sources and publications.
Methodology
Step 1 - Identification of Relevant Samples Size from Population Database


Step 2 - Approaches for Defining Global Market Size (Value, Volume* & Price*)

Note*: In applicable scenarios
Step 3 - Data Sources
Primary Research
- Web Analytics
- Survey Reports
- Research Institute
- Latest Research Reports
- Opinion Leaders
Secondary Research
- Annual Reports
- White Paper
- Latest Press Release
- Industry Association
- Paid Database
- Investor Presentations

Step 4 - Data Triangulation
Involves using different sources of information in order to increase the validity of a study
These sources are likely to be stakeholders in a program - participants, other researchers, program staff, other community members, and so on.
Then we put all data in single framework & apply various statistical tools to find out the dynamic on the market.
During the analysis stage, feedback from the stakeholder groups would be compared to determine areas of agreement as well as areas of divergence
