

Key Insights
The global vascular grafts market is experiencing robust growth, projected to reach a substantial size within the forecast period (2025-2033). A compound annual growth rate (CAGR) of 5.70% indicates a steadily expanding market driven by several key factors. The rising prevalence of cardiovascular diseases, including coronary artery disease, aneurysms, and peripheral artery disease, is a primary driver. Aging populations in developed and developing nations contribute significantly to this increase in disease prevalence, fueling demand for effective treatment options like vascular grafts. Furthermore, advancements in graft technology, including the development of biocompatible and durable materials, are enhancing treatment outcomes and driving market expansion. The market is segmented by product type (hemodialysis access grafts, endovascular stent grafts, peripheral vascular grafts, coronary artery bypass grafts), application (aneurysms, kidney failure, vascular occlusion, coronary artery diseases), and raw material (synthetic and biological). The synthetic raw material segment currently holds a larger market share due to cost-effectiveness and ease of production, though the biological segment is witnessing significant growth due to improved biocompatibility and reduced risk of complications. Geographic distribution shows strong growth across North America and Europe, driven by established healthcare infrastructure and high adoption rates. However, Asia-Pacific is poised for rapid expansion due to rising healthcare expenditure and increasing awareness of cardiovascular diseases. Competitive landscape analysis reveals the presence of both large multinational corporations and specialized medical device companies, leading to innovation and competition in product development and market penetration.
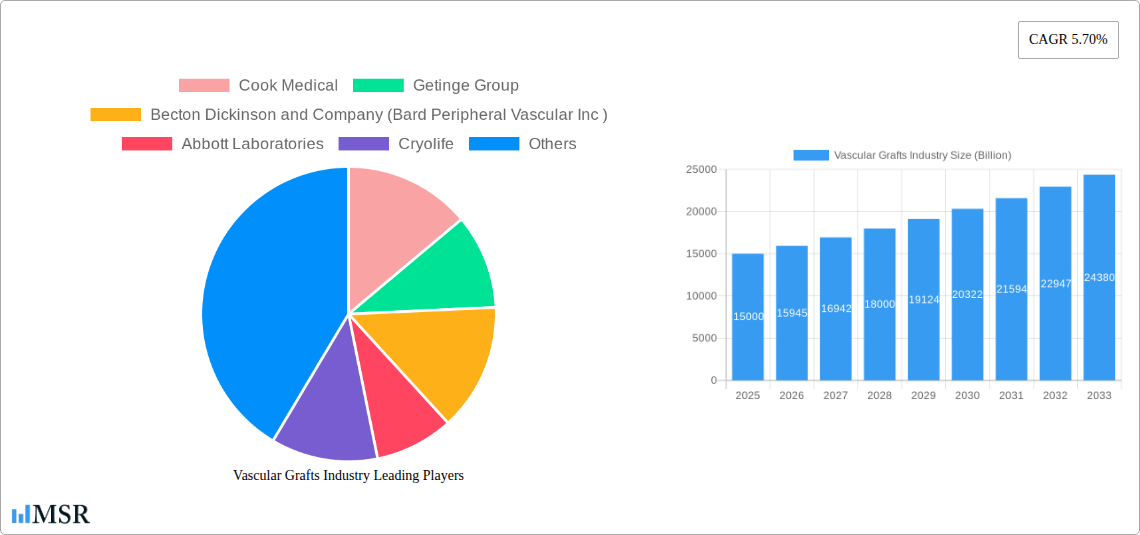
Vascular Grafts Industry Market Size (In Billion)
Despite the positive growth outlook, challenges remain. High costs associated with vascular graft procedures can limit accessibility, particularly in low- and middle-income countries. Furthermore, potential complications like thrombosis and infection associated with graft implantation can restrain market growth. Regulatory hurdles and stringent approval processes also pose challenges for market entrants. However, ongoing research and development efforts focused on minimizing complications and improving graft longevity are likely to mitigate some of these challenges. The market's future growth trajectory is strongly linked to continued advancements in material science, surgical techniques, and increasing healthcare access globally. Focusing on innovative solutions that address cost-effectiveness and patient safety will be key to unlocking the market's full potential.
Vascular Grafts Industry Company Market Share
Vascular Grafts Industry Report: A Billion-Dollar Market Analysis (2019-2033)
This comprehensive report provides an in-depth analysis of the global vascular grafts market, projecting a market value exceeding $XX billion by 2033. We examine market dynamics, key players, technological advancements, and future growth opportunities within this vital medical device sector. The report covers the period 2019-2033, with 2025 as the base and estimated year. Our analysis incorporates data from leading companies such as Cook Medical, Getinge Group, Becton Dickinson and Company (Bard Peripheral Vascular Inc), Abbott Laboratories, Cryolife, Medtronic PLC, W L Gore & Associates Inc, Cardinal Health (Cordis Corporation), LeMaitre Vascular Inc, Terumo Medical Corporation, B Braun Melsungen AG, and Endologix Inc, though the list is not exhaustive.
Vascular Grafts Industry Market Concentration & Dynamics
The vascular grafts market exhibits moderate concentration, with several multinational corporations holding significant market share. While precise figures vary by segment, the top ten players likely account for over 60% of the global market. The industry's innovation ecosystem is robust, driven by ongoing research into biocompatible materials, minimally invasive procedures, and advanced stent graft designs. Regulatory frameworks, particularly those overseen by the FDA and other international bodies, play a crucial role in product approval and market access. Substitute products, while limited, include surgical bypass techniques. End-user trends lean towards less invasive procedures and improved patient outcomes, impacting product demand. M&A activity within the sector has been moderate in recent years, with an estimated xx number of deals per year over the historical period, driven by efforts to expand product portfolios and access new markets.
Vascular Grafts Industry Insights & Trends
The global vascular grafts market is experiencing robust growth, driven by a rising prevalence of cardiovascular diseases, an aging population, and increasing demand for minimally invasive procedures. The market size reached $XX billion in 2024 and is projected to reach $XX billion by 2033, registering a compound annual growth rate (CAGR) of xx% during the forecast period (2025-2033). Technological advancements, such as the development of bioabsorbable grafts and drug-eluting stents, are further fueling market expansion. Evolving consumer preferences towards less invasive treatments and improved quality of life post-surgery also contribute significantly to the market's positive outlook. Furthermore, expanding healthcare infrastructure in developing economies presents significant untapped potential.
Key Markets & Segments Leading Vascular Grafts Industry
The North American market dominates the vascular grafts industry, followed by Europe and Asia Pacific. Within product segments, Endovascular Stent Grafts hold the largest market share due to their extensive use in treating aneurysms and vascular occlusions. Peripheral Vascular Grafts also represent a significant segment, driven by the high prevalence of peripheral artery disease.
- Drivers for Endovascular Stent Graft Dominance:
- Increasing prevalence of aneurysms.
- Growing adoption of minimally invasive procedures.
- Technological advancements in stent graft designs.
- Drivers for Peripheral Vascular Graft Growth:
- Rising incidence of peripheral artery disease.
- Expanding geriatric population.
- Improved treatment outcomes.
- Drivers for other segments: The growth of other segments such as hemodialysis access grafts is influenced by the increasing prevalence of kidney failure, and coronary artery bypass grafts are driven by the persistent prevalence of coronary artery diseases.
By Application, Aneurysms and Vascular Occlusion are the largest application segments, closely followed by Coronary Artery Diseases and Kidney Failure. Synthetic raw materials currently dominate the raw material segment due to their cost-effectiveness and ease of manufacturing, however, the biological raw material segment is expected to witness increased growth due to the growing demand for biocompatible grafts.
Vascular Grafts Industry Product Developments
Significant advancements in vascular graft technology are shaping the market. Bioabsorbable scaffolds offer reduced long-term complications. Drug-eluting stents reduce restenosis rates. The introduction of innovative devices like the VIOLA (for clampless anastomosis in CABG) and the Tero abdominal aortic stent grafts exemplifies this ongoing innovation, enhancing procedural efficiency and patient outcomes while offering competitive advantages to manufacturers.
Challenges in the Vascular Grafts Industry Market
The vascular grafts market faces challenges such as stringent regulatory approvals, complex manufacturing processes, and intense competition. Supply chain disruptions, particularly concerning raw materials, also pose a significant risk, potentially affecting production and profitability. Furthermore, the high cost of advanced grafts and procedures can limit market accessibility. The average cost of a vascular graft procedure could be anywhere from $XX,XXX to $XX,XXX, creating financial barriers for certain patient demographics.
Forces Driving Vascular Grafts Industry Growth
Technological advancements (e.g., bioabsorbable materials, drug-eluting stents), increasing prevalence of cardiovascular diseases, and a growing geriatric population are key growth drivers. Government initiatives promoting preventive healthcare and improving healthcare infrastructure also contribute positively to market expansion. Furthermore, favorable reimbursement policies in various regions support the widespread adoption of vascular grafts.
Long-Term Growth Catalysts in the Vascular Grafts Industry
Long-term growth hinges on continuous innovation in materials science, strategic partnerships to expand market reach, and geographical expansion into emerging economies. Focused research and development, concentrating on biodegradable materials and personalized medicine, will drive further market penetration.
Emerging Opportunities in Vascular Grafts Industry
Emerging opportunities include the development of personalized vascular grafts tailored to individual patient needs, the integration of advanced imaging technologies for improved graft placement, and the expansion into underserved markets in developing countries. Furthermore, the growing use of telehealth and remote patient monitoring systems offers opportunities for optimizing post-operative care.
Leading Players in the Vascular Grafts Industry Sector
Key Milestones in Vascular Grafts Industry Industry
- October 2021: Terumo Aortic received approval for the Tero abdominal aortic stent grafts, expanding treatment options for abdominal aortic aneurysms.
- March 2021: Vascular Grafts Solutions (VGS) Ltd. received FDA clearance for the VIOLA device, improving coronary artery bypass grafting (CABG) procedures.
Strategic Outlook for Vascular Grafts Industry Market
The vascular grafts market is poised for sustained growth, driven by a confluence of factors including technological advancements, demographic shifts, and increasing healthcare expenditure. Strategic partnerships, focused R&D, and expansion into new markets will be crucial for companies seeking to capitalize on the significant market potential. The continued focus on minimally invasive procedures and improved patient outcomes will shape the future landscape of this dynamic sector.
Vascular Grafts Industry Segmentation
-
1. Product
- 1.1. Hemodialysis Access Grafts
- 1.2. Endovascular Stent Grafts
- 1.3. Peripheral Vascular Grafts
- 1.4. Coronary Artery By-pass Grafts
-
2. Application
- 2.1. Aneurysms
- 2.2. Kidney Failures
- 2.3. Vascular Occlusions
- 2.4. Coronary Artery Diseases
- 2.5. Other Applications
-
3. Raw Material
- 3.1. Synthetic Raw Materials
- 3.2. Biological Raw Materials
Vascular Grafts Industry Segmentation By Geography
-
1. North America
- 1.1. United States
- 1.2. Canada
- 1.3. Mexico
-
2. Europe
- 2.1. Germany
- 2.2. United Kingdom
- 2.3. France
- 2.4. Italy
- 2.5. Spain
- 2.6. Rest of Europe
-
3. Asia Pacific
- 3.1. China
- 3.2. Japan
- 3.3. India
- 3.4. Australia
- 3.5. South Korea
- 3.6. Rest of Asia Pacific
-
4. Middle East and Africa
- 4.1. GCC
- 4.2. South Africa
- 4.3. Rest of Middle East and Africa
-
5. South America
- 5.1. Brazil
- 5.2. Argentina
- 5.3. Rest of South America
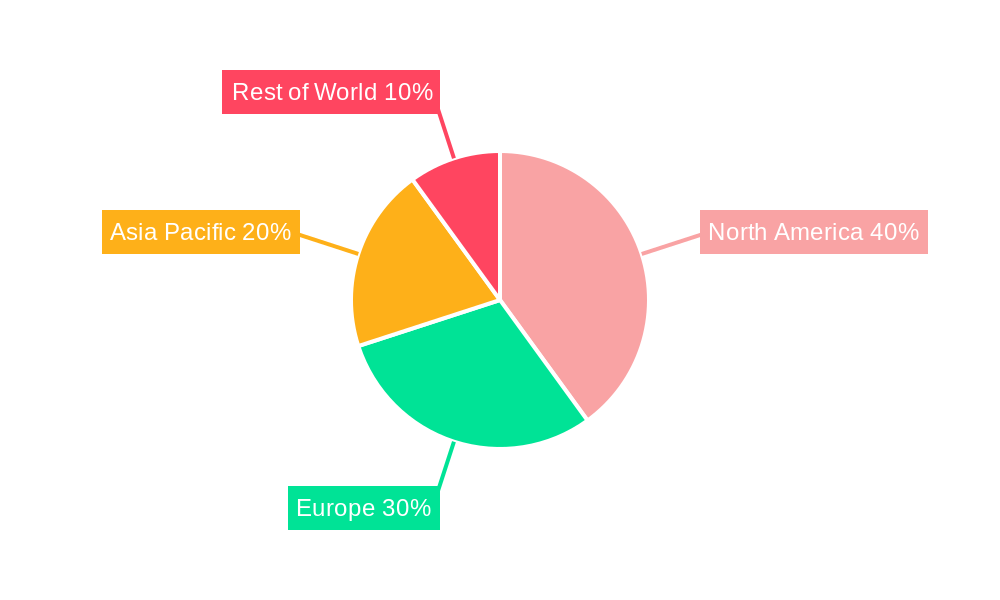
Vascular Grafts Industry Regional Market Share
Geographic Coverage of Vascular Grafts Industry
Vascular Grafts Industry REPORT HIGHLIGHTS
| Aspects | Details |
|---|---|
| Study Period | 2020-2034 |
| Base Year | 2025 |
| Estimated Year | 2026 |
| Forecast Period | 2026-2034 |
| Historical Period | 2020-2025 |
| Growth Rate | CAGR of 5.70% from 2020-2034 |
| Segmentation |
|
Table of Contents
- 1. Introduction
- 1.1. Research Scope
- 1.2. Market Segmentation
- 1.3. Research Objective
- 1.4. Definitions and Assumptions
- 2. Executive Summary
- 2.1. Market Snapshot
- 3. Market Dynamics
- 3.1. Market Drivers
- 3.2. Market Restrains
- 3.3. Market Trends
- 3.4. Market Opportunities
- 4. Market Factor Analysis
- 4.1. Porters Five Forces
- 4.1.1. Bargaining Power of Suppliers
- 4.1.2. Bargaining Power of Buyers
- 4.1.3. Threat of New Entrants
- 4.1.4. Threat of Substitutes
- 4.1.5. Competitive Rivalry
- 4.2. PESTEL analysis
- 4.3. BCG Analysis
- 4.3.1. Stars (High Growth, High Market Share)
- 4.3.2. Cash Cows (Low Growth, High Market Share)
- 4.3.3. Question Mark (High Growth, Low Market Share)
- 4.3.4. Dogs (Low Growth, Low Market Share)
- 4.4. Ansoff Matrix Analysis
- 4.5. Supply Chain Analysis
- 4.6. Regulatory Landscape
- 4.7. Current Market Potential and Opportunity Assessment (TAM–SAM–SOM Framework)
- 4.8. MSR Analyst Note
- 4.1. Porters Five Forces
- 5. Market Analysis, Insights and Forecast 2021-2033
- 5.1. Market Analysis, Insights and Forecast - by Product
- 5.1.1. Hemodialysis Access Grafts
- 5.1.2. Endovascular Stent Grafts
- 5.1.3. Peripheral Vascular Grafts
- 5.1.4. Coronary Artery By-pass Grafts
- 5.2. Market Analysis, Insights and Forecast - by Application
- 5.2.1. Aneurysms
- 5.2.2. Kidney Failures
- 5.2.3. Vascular Occlusions
- 5.2.4. Coronary Artery Diseases
- 5.2.5. Other Applications
- 5.3. Market Analysis, Insights and Forecast - by Raw Material
- 5.3.1. Synthetic Raw Materials
- 5.3.2. Biological Raw Materials
- 5.4. Market Analysis, Insights and Forecast - by Region
- 5.4.1. North America
- 5.4.2. Europe
- 5.4.3. Asia Pacific
- 5.4.4. Middle East and Africa
- 5.4.5. South America
- 5.1. Market Analysis, Insights and Forecast - by Product
- 6. Global Vascular Grafts Industry Analysis, Insights and Forecast, 2021-2033
- 6.1. Market Analysis, Insights and Forecast - by Product
- 6.1.1. Hemodialysis Access Grafts
- 6.1.2. Endovascular Stent Grafts
- 6.1.3. Peripheral Vascular Grafts
- 6.1.4. Coronary Artery By-pass Grafts
- 6.2. Market Analysis, Insights and Forecast - by Application
- 6.2.1. Aneurysms
- 6.2.2. Kidney Failures
- 6.2.3. Vascular Occlusions
- 6.2.4. Coronary Artery Diseases
- 6.2.5. Other Applications
- 6.3. Market Analysis, Insights and Forecast - by Raw Material
- 6.3.1. Synthetic Raw Materials
- 6.3.2. Biological Raw Materials
- 6.1. Market Analysis, Insights and Forecast - by Product
- 7. North America Vascular Grafts Industry Analysis, Insights and Forecast, 2020-2032
- 7.1. Market Analysis, Insights and Forecast - by Product
- 7.1.1. Hemodialysis Access Grafts
- 7.1.2. Endovascular Stent Grafts
- 7.1.3. Peripheral Vascular Grafts
- 7.1.4. Coronary Artery By-pass Grafts
- 7.2. Market Analysis, Insights and Forecast - by Application
- 7.2.1. Aneurysms
- 7.2.2. Kidney Failures
- 7.2.3. Vascular Occlusions
- 7.2.4. Coronary Artery Diseases
- 7.2.5. Other Applications
- 7.3. Market Analysis, Insights and Forecast - by Raw Material
- 7.3.1. Synthetic Raw Materials
- 7.3.2. Biological Raw Materials
- 7.1. Market Analysis, Insights and Forecast - by Product
- 8. Europe Vascular Grafts Industry Analysis, Insights and Forecast, 2020-2032
- 8.1. Market Analysis, Insights and Forecast - by Product
- 8.1.1. Hemodialysis Access Grafts
- 8.1.2. Endovascular Stent Grafts
- 8.1.3. Peripheral Vascular Grafts
- 8.1.4. Coronary Artery By-pass Grafts
- 8.2. Market Analysis, Insights and Forecast - by Application
- 8.2.1. Aneurysms
- 8.2.2. Kidney Failures
- 8.2.3. Vascular Occlusions
- 8.2.4. Coronary Artery Diseases
- 8.2.5. Other Applications
- 8.3. Market Analysis, Insights and Forecast - by Raw Material
- 8.3.1. Synthetic Raw Materials
- 8.3.2. Biological Raw Materials
- 8.1. Market Analysis, Insights and Forecast - by Product
- 9. Asia Pacific Vascular Grafts Industry Analysis, Insights and Forecast, 2020-2032
- 9.1. Market Analysis, Insights and Forecast - by Product
- 9.1.1. Hemodialysis Access Grafts
- 9.1.2. Endovascular Stent Grafts
- 9.1.3. Peripheral Vascular Grafts
- 9.1.4. Coronary Artery By-pass Grafts
- 9.2. Market Analysis, Insights and Forecast - by Application
- 9.2.1. Aneurysms
- 9.2.2. Kidney Failures
- 9.2.3. Vascular Occlusions
- 9.2.4. Coronary Artery Diseases
- 9.2.5. Other Applications
- 9.3. Market Analysis, Insights and Forecast - by Raw Material
- 9.3.1. Synthetic Raw Materials
- 9.3.2. Biological Raw Materials
- 9.1. Market Analysis, Insights and Forecast - by Product
- 10. Middle East and Africa Vascular Grafts Industry Analysis, Insights and Forecast, 2020-2032
- 10.1. Market Analysis, Insights and Forecast - by Product
- 10.1.1. Hemodialysis Access Grafts
- 10.1.2. Endovascular Stent Grafts
- 10.1.3. Peripheral Vascular Grafts
- 10.1.4. Coronary Artery By-pass Grafts
- 10.2. Market Analysis, Insights and Forecast - by Application
- 10.2.1. Aneurysms
- 10.2.2. Kidney Failures
- 10.2.3. Vascular Occlusions
- 10.2.4. Coronary Artery Diseases
- 10.2.5. Other Applications
- 10.3. Market Analysis, Insights and Forecast - by Raw Material
- 10.3.1. Synthetic Raw Materials
- 10.3.2. Biological Raw Materials
- 10.1. Market Analysis, Insights and Forecast - by Product
- 11. South America Vascular Grafts Industry Analysis, Insights and Forecast, 2020-2032
- 11.1. Market Analysis, Insights and Forecast - by Product
- 11.1.1. Hemodialysis Access Grafts
- 11.1.2. Endovascular Stent Grafts
- 11.1.3. Peripheral Vascular Grafts
- 11.1.4. Coronary Artery By-pass Grafts
- 11.2. Market Analysis, Insights and Forecast - by Application
- 11.2.1. Aneurysms
- 11.2.2. Kidney Failures
- 11.2.3. Vascular Occlusions
- 11.2.4. Coronary Artery Diseases
- 11.2.5. Other Applications
- 11.3. Market Analysis, Insights and Forecast - by Raw Material
- 11.3.1. Synthetic Raw Materials
- 11.3.2. Biological Raw Materials
- 11.1. Market Analysis, Insights and Forecast - by Product
- 12. Competitive Analysis
- 12.1. Company Profiles
- 12.1.1 Cook Medical
- 12.1.1.1. Company Overview
- 12.1.1.2. Products
- 12.1.1.3. Company Financials
- 12.1.1.4. SWOT Analysis
- 12.1.2 Getinge Group
- 12.1.2.1. Company Overview
- 12.1.2.2. Products
- 12.1.2.3. Company Financials
- 12.1.2.4. SWOT Analysis
- 12.1.3 Becton Dickinson and Company (Bard Peripheral Vascular Inc )
- 12.1.3.1. Company Overview
- 12.1.3.2. Products
- 12.1.3.3. Company Financials
- 12.1.3.4. SWOT Analysis
- 12.1.4 Abbott Laboratories
- 12.1.4.1. Company Overview
- 12.1.4.2. Products
- 12.1.4.3. Company Financials
- 12.1.4.4. SWOT Analysis
- 12.1.5 Cryolife
- 12.1.5.1. Company Overview
- 12.1.5.2. Products
- 12.1.5.3. Company Financials
- 12.1.5.4. SWOT Analysis
- 12.1.6 Medtronic PLC
- 12.1.6.1. Company Overview
- 12.1.6.2. Products
- 12.1.6.3. Company Financials
- 12.1.6.4. SWOT Analysis
- 12.1.7 W L Gore & Associates Inc
- 12.1.7.1. Company Overview
- 12.1.7.2. Products
- 12.1.7.3. Company Financials
- 12.1.7.4. SWOT Analysis
- 12.1.8 Cardinal Health (Cordis Corporation)
- 12.1.8.1. Company Overview
- 12.1.8.2. Products
- 12.1.8.3. Company Financials
- 12.1.8.4. SWOT Analysis
- 12.1.9 LeMaitre Vascular Inc
- 12.1.9.1. Company Overview
- 12.1.9.2. Products
- 12.1.9.3. Company Financials
- 12.1.9.4. SWOT Analysis
- 12.1.10 Terumo Medical Corporation
- 12.1.10.1. Company Overview
- 12.1.10.2. Products
- 12.1.10.3. Company Financials
- 12.1.10.4. SWOT Analysis
- 12.1.11 B Braun Melsungen AG
- 12.1.11.1. Company Overview
- 12.1.11.2. Products
- 12.1.11.3. Company Financials
- 12.1.11.4. SWOT Analysis
- 12.1.12 Endologix Inc *List Not Exhaustive
- 12.1.12.1. Company Overview
- 12.1.12.2. Products
- 12.1.12.3. Company Financials
- 12.1.12.4. SWOT Analysis
- 12.1.1 Cook Medical
- 12.2. Market Entropy
- 12.2.1 Company's Key Areas Served
- 12.2.2 Recent Developments
- 12.3. Company Market Share Analysis 2025
- 12.3.1 Top 5 Companies Market Share Analysis
- 12.3.2 Top 3 Companies Market Share Analysis
- 12.4. List of Potential Customers
- 13. Research Methodology
List of Figures
- Figure 1: Global Vascular Grafts Industry Revenue Breakdown (Billion, %) by Region 2025 & 2033
- Figure 2: North America Vascular Grafts Industry Revenue (Billion), by Product 2025 & 2033
- Figure 3: North America Vascular Grafts Industry Revenue Share (%), by Product 2025 & 2033
- Figure 4: North America Vascular Grafts Industry Revenue (Billion), by Application 2025 & 2033
- Figure 5: North America Vascular Grafts Industry Revenue Share (%), by Application 2025 & 2033
- Figure 6: North America Vascular Grafts Industry Revenue (Billion), by Raw Material 2025 & 2033
- Figure 7: North America Vascular Grafts Industry Revenue Share (%), by Raw Material 2025 & 2033
- Figure 8: North America Vascular Grafts Industry Revenue (Billion), by Country 2025 & 2033
- Figure 9: North America Vascular Grafts Industry Revenue Share (%), by Country 2025 & 2033
- Figure 10: Europe Vascular Grafts Industry Revenue (Billion), by Product 2025 & 2033
- Figure 11: Europe Vascular Grafts Industry Revenue Share (%), by Product 2025 & 2033
- Figure 12: Europe Vascular Grafts Industry Revenue (Billion), by Application 2025 & 2033
- Figure 13: Europe Vascular Grafts Industry Revenue Share (%), by Application 2025 & 2033
- Figure 14: Europe Vascular Grafts Industry Revenue (Billion), by Raw Material 2025 & 2033
- Figure 15: Europe Vascular Grafts Industry Revenue Share (%), by Raw Material 2025 & 2033
- Figure 16: Europe Vascular Grafts Industry Revenue (Billion), by Country 2025 & 2033
- Figure 17: Europe Vascular Grafts Industry Revenue Share (%), by Country 2025 & 2033
- Figure 18: Asia Pacific Vascular Grafts Industry Revenue (Billion), by Product 2025 & 2033
- Figure 19: Asia Pacific Vascular Grafts Industry Revenue Share (%), by Product 2025 & 2033
- Figure 20: Asia Pacific Vascular Grafts Industry Revenue (Billion), by Application 2025 & 2033
- Figure 21: Asia Pacific Vascular Grafts Industry Revenue Share (%), by Application 2025 & 2033
- Figure 22: Asia Pacific Vascular Grafts Industry Revenue (Billion), by Raw Material 2025 & 2033
- Figure 23: Asia Pacific Vascular Grafts Industry Revenue Share (%), by Raw Material 2025 & 2033
- Figure 24: Asia Pacific Vascular Grafts Industry Revenue (Billion), by Country 2025 & 2033
- Figure 25: Asia Pacific Vascular Grafts Industry Revenue Share (%), by Country 2025 & 2033
- Figure 26: Middle East and Africa Vascular Grafts Industry Revenue (Billion), by Product 2025 & 2033
- Figure 27: Middle East and Africa Vascular Grafts Industry Revenue Share (%), by Product 2025 & 2033
- Figure 28: Middle East and Africa Vascular Grafts Industry Revenue (Billion), by Application 2025 & 2033
- Figure 29: Middle East and Africa Vascular Grafts Industry Revenue Share (%), by Application 2025 & 2033
- Figure 30: Middle East and Africa Vascular Grafts Industry Revenue (Billion), by Raw Material 2025 & 2033
- Figure 31: Middle East and Africa Vascular Grafts Industry Revenue Share (%), by Raw Material 2025 & 2033
- Figure 32: Middle East and Africa Vascular Grafts Industry Revenue (Billion), by Country 2025 & 2033
- Figure 33: Middle East and Africa Vascular Grafts Industry Revenue Share (%), by Country 2025 & 2033
- Figure 34: South America Vascular Grafts Industry Revenue (Billion), by Product 2025 & 2033
- Figure 35: South America Vascular Grafts Industry Revenue Share (%), by Product 2025 & 2033
- Figure 36: South America Vascular Grafts Industry Revenue (Billion), by Application 2025 & 2033
- Figure 37: South America Vascular Grafts Industry Revenue Share (%), by Application 2025 & 2033
- Figure 38: South America Vascular Grafts Industry Revenue (Billion), by Raw Material 2025 & 2033
- Figure 39: South America Vascular Grafts Industry Revenue Share (%), by Raw Material 2025 & 2033
- Figure 40: South America Vascular Grafts Industry Revenue (Billion), by Country 2025 & 2033
- Figure 41: South America Vascular Grafts Industry Revenue Share (%), by Country 2025 & 2033
List of Tables
- Table 1: Global Vascular Grafts Industry Revenue Billion Forecast, by Product 2020 & 2033
- Table 2: Global Vascular Grafts Industry Revenue Billion Forecast, by Application 2020 & 2033
- Table 3: Global Vascular Grafts Industry Revenue Billion Forecast, by Raw Material 2020 & 2033
- Table 4: Global Vascular Grafts Industry Revenue Billion Forecast, by Region 2020 & 2033
- Table 5: Global Vascular Grafts Industry Revenue Billion Forecast, by Product 2020 & 2033
- Table 6: Global Vascular Grafts Industry Revenue Billion Forecast, by Application 2020 & 2033
- Table 7: Global Vascular Grafts Industry Revenue Billion Forecast, by Raw Material 2020 & 2033
- Table 8: Global Vascular Grafts Industry Revenue Billion Forecast, by Country 2020 & 2033
- Table 9: United States Vascular Grafts Industry Revenue (Billion) Forecast, by Application 2020 & 2033
- Table 10: Canada Vascular Grafts Industry Revenue (Billion) Forecast, by Application 2020 & 2033
- Table 11: Mexico Vascular Grafts Industry Revenue (Billion) Forecast, by Application 2020 & 2033
- Table 12: Global Vascular Grafts Industry Revenue Billion Forecast, by Product 2020 & 2033
- Table 13: Global Vascular Grafts Industry Revenue Billion Forecast, by Application 2020 & 2033
- Table 14: Global Vascular Grafts Industry Revenue Billion Forecast, by Raw Material 2020 & 2033
- Table 15: Global Vascular Grafts Industry Revenue Billion Forecast, by Country 2020 & 2033
- Table 16: Germany Vascular Grafts Industry Revenue (Billion) Forecast, by Application 2020 & 2033
- Table 17: United Kingdom Vascular Grafts Industry Revenue (Billion) Forecast, by Application 2020 & 2033
- Table 18: France Vascular Grafts Industry Revenue (Billion) Forecast, by Application 2020 & 2033
- Table 19: Italy Vascular Grafts Industry Revenue (Billion) Forecast, by Application 2020 & 2033
- Table 20: Spain Vascular Grafts Industry Revenue (Billion) Forecast, by Application 2020 & 2033
- Table 21: Rest of Europe Vascular Grafts Industry Revenue (Billion) Forecast, by Application 2020 & 2033
- Table 22: Global Vascular Grafts Industry Revenue Billion Forecast, by Product 2020 & 2033
- Table 23: Global Vascular Grafts Industry Revenue Billion Forecast, by Application 2020 & 2033
- Table 24: Global Vascular Grafts Industry Revenue Billion Forecast, by Raw Material 2020 & 2033
- Table 25: Global Vascular Grafts Industry Revenue Billion Forecast, by Country 2020 & 2033
- Table 26: China Vascular Grafts Industry Revenue (Billion) Forecast, by Application 2020 & 2033
- Table 27: Japan Vascular Grafts Industry Revenue (Billion) Forecast, by Application 2020 & 2033
- Table 28: India Vascular Grafts Industry Revenue (Billion) Forecast, by Application 2020 & 2033
- Table 29: Australia Vascular Grafts Industry Revenue (Billion) Forecast, by Application 2020 & 2033
- Table 30: South Korea Vascular Grafts Industry Revenue (Billion) Forecast, by Application 2020 & 2033
- Table 31: Rest of Asia Pacific Vascular Grafts Industry Revenue (Billion) Forecast, by Application 2020 & 2033
- Table 32: Global Vascular Grafts Industry Revenue Billion Forecast, by Product 2020 & 2033
- Table 33: Global Vascular Grafts Industry Revenue Billion Forecast, by Application 2020 & 2033
- Table 34: Global Vascular Grafts Industry Revenue Billion Forecast, by Raw Material 2020 & 2033
- Table 35: Global Vascular Grafts Industry Revenue Billion Forecast, by Country 2020 & 2033
- Table 36: GCC Vascular Grafts Industry Revenue (Billion) Forecast, by Application 2020 & 2033
- Table 37: South Africa Vascular Grafts Industry Revenue (Billion) Forecast, by Application 2020 & 2033
- Table 38: Rest of Middle East and Africa Vascular Grafts Industry Revenue (Billion) Forecast, by Application 2020 & 2033
- Table 39: Global Vascular Grafts Industry Revenue Billion Forecast, by Product 2020 & 2033
- Table 40: Global Vascular Grafts Industry Revenue Billion Forecast, by Application 2020 & 2033
- Table 41: Global Vascular Grafts Industry Revenue Billion Forecast, by Raw Material 2020 & 2033
- Table 42: Global Vascular Grafts Industry Revenue Billion Forecast, by Country 2020 & 2033
- Table 43: Brazil Vascular Grafts Industry Revenue (Billion) Forecast, by Application 2020 & 2033
- Table 44: Argentina Vascular Grafts Industry Revenue (Billion) Forecast, by Application 2020 & 2033
- Table 45: Rest of South America Vascular Grafts Industry Revenue (Billion) Forecast, by Application 2020 & 2033
Frequently Asked Questions
1. What is the projected Compound Annual Growth Rate (CAGR) of the Vascular Grafts Industry?
The projected CAGR is approximately 5.70%.
2. Which companies are prominent players in the Vascular Grafts Industry?
Key companies in the market include Cook Medical, Getinge Group, Becton Dickinson and Company (Bard Peripheral Vascular Inc ), Abbott Laboratories, Cryolife, Medtronic PLC, W L Gore & Associates Inc, Cardinal Health (Cordis Corporation), LeMaitre Vascular Inc, Terumo Medical Corporation, B Braun Melsungen AG, Endologix Inc *List Not Exhaustive.
3. What are the main segments of the Vascular Grafts Industry?
The market segments include Product, Application, Raw Material.
4. Can you provide details about the market size?
The market size is estimated to be USD XX Billion as of 2022.
5. What are some drivers contributing to market growth?
Increasing Prevalence of Cardiovascular Disorders; Technological Advancements in the Scaffold Material and Design of Vascular Grafts.
6. What are the notable trends driving market growth?
Kidney Failure Segment is Expected to Witness Growth Over the Forecast Period.
7. Are there any restraints impacting market growth?
Unfavorable Reimbursement Scenario; High Risk Associated with Graft Failures.
8. Can you provide examples of recent developments in the market?
October 2021: Terumo Aortic received approval for the Tero abdominal aortic stent grafts. This Japanese device will help in the treatment of abdominal aortic aneurysms.
9. What pricing options are available for accessing the report?
Pricing options include single-user, multi-user, and enterprise licenses priced at USD 4750, USD 5250, and USD 8750 respectively.
10. Is the market size provided in terms of value or volume?
The market size is provided in terms of value, measured in Billion.
11. Are there any specific market keywords associated with the report?
Yes, the market keyword associated with the report is "Vascular Grafts Industry," which aids in identifying and referencing the specific market segment covered.
12. How do I determine which pricing option suits my needs best?
The pricing options vary based on user requirements and access needs. Individual users may opt for single-user licenses, while businesses requiring broader access may choose multi-user or enterprise licenses for cost-effective access to the report.
13. Are there any additional resources or data provided in the Vascular Grafts Industry report?
While the report offers comprehensive insights, it's advisable to review the specific contents or supplementary materials provided to ascertain if additional resources or data are available.
14. How can I stay updated on further developments or reports in the Vascular Grafts Industry?
To stay informed about further developments, trends, and reports in the Vascular Grafts Industry, consider subscribing to industry newsletters, following relevant companies and organizations, or regularly checking reputable industry news sources and publications.
Methodology
Step 1 - Identification of Relevant Samples Size from Population Database


Step 2 - Approaches for Defining Global Market Size (Value, Volume* & Price*)

Note*: In applicable scenarios
Step 3 - Data Sources
Primary Research
- Web Analytics
- Survey Reports
- Research Institute
- Latest Research Reports
- Opinion Leaders
Secondary Research
- Annual Reports
- White Paper
- Latest Press Release
- Industry Association
- Paid Database
- Investor Presentations

Step 4 - Data Triangulation
Involves using different sources of information in order to increase the validity of a study
These sources are likely to be stakeholders in a program - participants, other researchers, program staff, other community members, and so on.
Then we put all data in single framework & apply various statistical tools to find out the dynamic on the market.
During the analysis stage, feedback from the stakeholder groups would be compared to determine areas of agreement as well as areas of divergence