
Key Insights
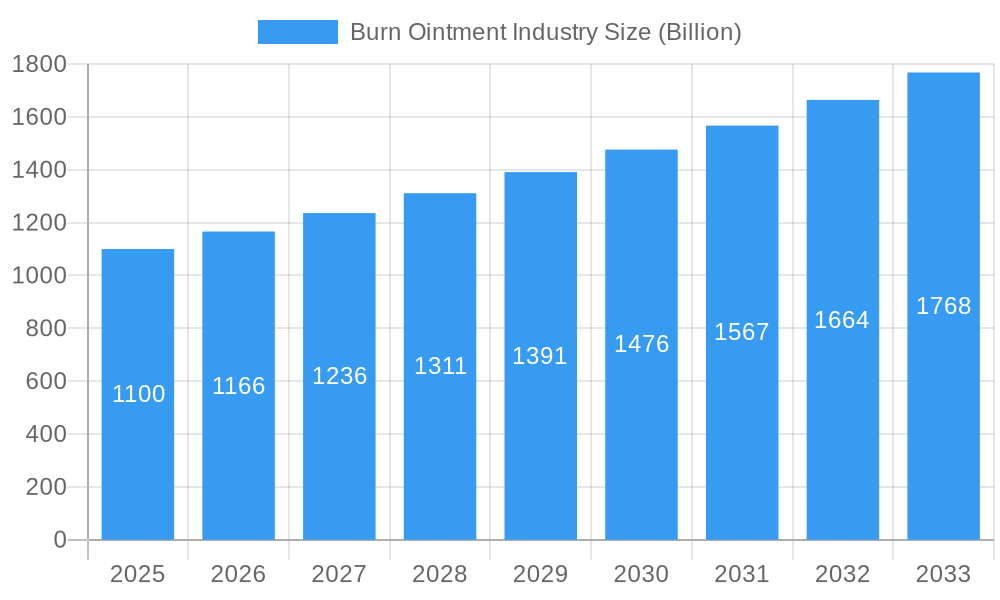
The global burn ointment market, valued at $1.1 billion in 2025, is projected to experience robust growth, driven by a compound annual growth rate (CAGR) of 5.95% from 2025 to 2033. This expansion is fueled by several key factors. The increasing incidence of burn injuries worldwide, due to accidents, natural disasters, and industrial mishaps, creates significant demand for effective burn ointments. Furthermore, advancements in formulation technology are leading to the development of more effective and less painful topical treatments, containing ingredients like silver and iodine, which exhibit potent antimicrobial properties and promote faster wound healing. The rising prevalence of chronic wounds and the growing geriatric population, both susceptible to severe burns and slower healing times, further contribute to market growth. Hospitals and clinics remain the dominant end-users, but increasing awareness and accessibility of home-care treatments are expanding the "other end-users" segment. The market is segmented by product type (topical antibiotics, silver, iodine), burn depth (minor, partial thickness, full thickness), and end-user (hospitals & clinics, other end-users). Competition among established players such as Smith & Nephew, Perrigo, and 3M is intense, driving innovation and pricing strategies. However, factors such as stringent regulatory approvals and the potential for adverse reactions to certain burn ointments pose challenges to market expansion.
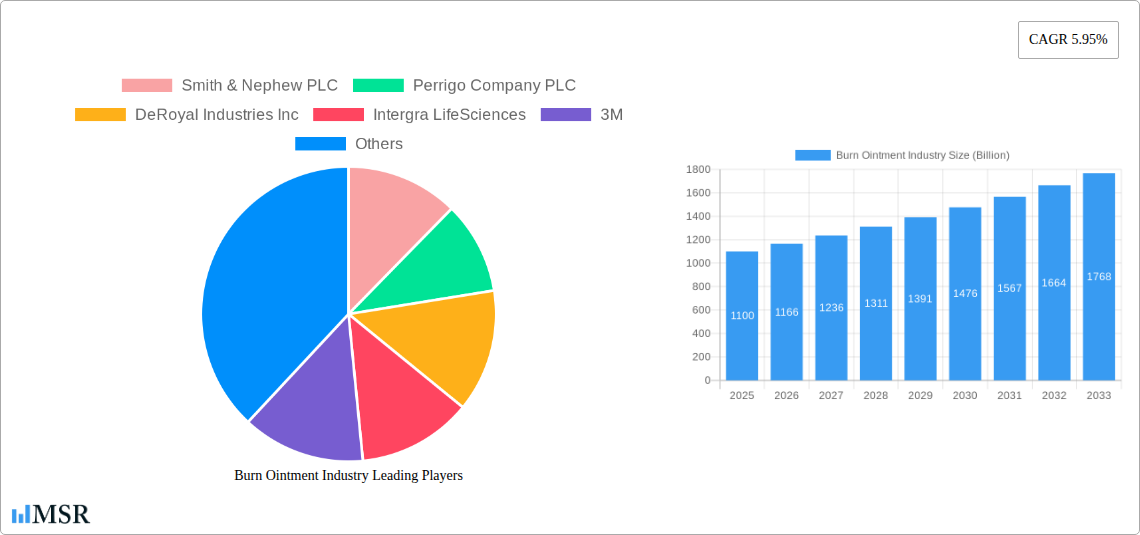
Burn Ointment Industry Market Size (In Billion)
Geographic distribution reveals a significant market share held by North America and Europe, attributable to higher healthcare expenditure and advanced medical infrastructure. However, the Asia-Pacific region is poised for substantial growth due to rising healthcare awareness, increasing disposable incomes, and a growing population. The market's future trajectory depends on several factors, including technological advancements in wound care, evolving healthcare policies, and the effectiveness of public awareness campaigns regarding burn prevention and treatment. The continued focus on developing advanced burn ointments with improved efficacy and reduced side effects will be crucial for sustained market expansion.
Burn Ointment Industry Company Market Share
Burn Ointment Industry Market Report: A Comprehensive Analysis (2019-2033)
This comprehensive report provides a detailed analysis of the global burn ointment industry, projecting a market value exceeding $XX Billion by 2033. The report covers the period from 2019 to 2033, with a focus on the forecast period of 2025-2033 and a base year of 2025. It delves into market dynamics, key players, emerging trends, and future growth opportunities, providing actionable insights for industry stakeholders. The report’s findings are invaluable for strategic decision-making within the burn ointment sector.
Burn Ointment Industry Market Concentration & Dynamics
The burn ointment market exhibits a moderately consolidated structure, with several major players commanding significant market share. The top ten companies account for approximately XX% of the global market in 2025, estimated at $XX Billion. However, the industry also features numerous smaller players, particularly in niche segments. Market concentration is influenced by factors such as R&D capabilities, brand recognition, and regulatory compliance.
Innovation Ecosystems: The industry is characterized by ongoing innovation in formulations, delivery systems, and active ingredients. This includes the development of advanced burn ointments with enhanced efficacy, reduced side effects, and improved patient compliance.
Regulatory Frameworks: Stringent regulatory requirements concerning safety and efficacy significantly impact market entry and product development. Compliance with these regulations varies across regions, leading to differing market dynamics.
Substitute Products: Alternative treatments for burns, such as hydrocolloids and alginates, compete with burn ointments, influencing market share. However, burn ointments remain a key treatment option due to their effectiveness and widespread accessibility.
End-User Trends: Hospitals and clinics are the primary end users, contributing approximately XX% to the total market. However, the rising incidence of burn injuries and increasing awareness among consumers drive growth in the "Other End Users" segment, including homecare and retail pharmacies.
M&A Activities: The industry has witnessed a moderate level of mergers and acquisitions in recent years, with an estimated XX M&A deals between 2019 and 2024. These transactions aim to expand market reach, enhance product portfolios, and consolidate market share.
Burn Ointment Industry Industry Insights & Trends
The global burn ointment market is experiencing significant growth, driven by several factors. The market size is projected to reach $XX Billion in 2025, registering a CAGR of XX% during the forecast period (2025-2033). This growth is primarily fueled by the increasing incidence of burn injuries worldwide due to various factors like industrial accidents, domestic incidents, and natural disasters. Moreover, advancements in burn treatment techniques and a rising geriatric population increase demand for burn ointments. Technological disruptions, such as the development of novel formulations with improved efficacy and reduced side effects, are further driving market expansion. Evolving consumer behavior, particularly increased preference for convenient and easy-to-use products, contributes to the market's growth.
Key Markets & Segments Leading Burn Ointment Industry
Dominant Region/Country: North America currently holds the largest market share, owing to factors such as a high incidence of burn injuries, strong healthcare infrastructure, and high healthcare spending.
Dominant Segments:
- By Product Type: Silver-based burn ointments are expected to hold the largest market share due to their broad-spectrum antimicrobial properties and proven efficacy.
- By Depth of Burn: The demand for burn ointments targeting partial-thickness burns is high due to their relatively high prevalence.
- By End User: Hospitals and clinics comprise the majority of end users, contributing significantly to market demand.
Drivers:
- Economic Growth: Economic development in emerging markets is leading to increased healthcare spending, which drives demand for burn ointments.
- Healthcare Infrastructure: Improved healthcare infrastructure in developing countries enhances access to burn treatment and burn ointments.
Burn Ointment Industry Product Developments
Recent years have witnessed significant product innovation within the burn ointment industry. This includes the development of advanced formulations with enhanced antimicrobial activity, improved wound healing properties, and reduced pain and inflammation. The integration of nanotechnology and advanced drug delivery systems is enhancing product efficacy and patient compliance. Companies are also focused on developing environmentally friendly and sustainable formulations to meet the growing demand for eco-conscious healthcare products. This continuous innovation fuels competition and drives market expansion.
Challenges in the Burn Ointment Industry Market
The burn ointment industry faces several challenges, including stringent regulatory approvals that can delay product launches and increase development costs. Supply chain disruptions can lead to shortages and price fluctuations, impacting profitability. Intense competition among established players and the entry of new entrants further pose challenges to market share and pricing. These factors necessitate strategic adaptation and innovation to maintain a competitive edge.
Forces Driving Burn Ointment Industry Growth
Several key factors drive the growth of the burn ointment industry. Technological advancements resulting in improved formulations and delivery systems are crucial. Economic growth in emerging markets boosts healthcare spending. Favorable regulatory frameworks supporting innovation and market access contribute to this growth. For instance, increased government initiatives promoting burn prevention and treatment directly impact market expansion.
Long-Term Growth Catalysts in Burn Ointment Industry
Long-term growth will be fuelled by continuous innovation in burn ointment formulations, leveraging nanotechnology and other advanced technologies to enhance healing and minimize scarring. Strategic partnerships between pharmaceutical companies and research institutions will accelerate the development and commercialization of innovative products. Expansion into emerging markets with high burn injury prevalence offers significant growth potential.
Emerging Opportunities in Burn Ointment Industry
Emerging opportunities include the development of personalized burn ointments tailored to individual patient needs and the growing demand for homecare burn treatments. The development of sustainable and eco-friendly formulations aligns with increasing environmental consciousness. The exploration of new active ingredients and delivery methods presents further opportunities to enhance efficacy and improve patient outcomes.
Leading Players in the Burn Ointment Industry Sector
- Smith & Nephew PLC
- Perrigo Company PLC
- DeRoyal Industries Inc
- Intergra LifeSciences
- 3M
- ConvaTec Group PLC
- Dr Morepen
- Mankind Pharma
- Cardinal Health
- Cipla Limited
- Trio Lifescience Pvt Ltd
- Johnson & Johnson
- Sun Pharmaceutical Industries Ltd (Ranbaxy Laboratories Limited)
- GlaxoSmithKline PLC
- Pfizer Inc
Key Milestones in Burn Ointment Industry Industry
- May 2022: Molncyke Healthcare submitted clinical evidence on Mediplex Ag for partial thickness burns at Wound International 2022.
- April 2022: Hospices Civils de Lyon initiated a clinical trial on silver sulphadiazine for second-degree fibrinous burns (estimated start: September 2022).
Strategic Outlook for Burn Ointment Industry Market
The burn ointment market is poised for robust growth, driven by technological advancements, rising healthcare spending, and increasing burn injury incidence. Strategic opportunities lie in developing innovative, patient-centric products, expanding into emerging markets, and forging strategic partnerships to enhance market reach and competitiveness. Focusing on personalized medicine and sustainable practices will be crucial for long-term success.
Burn Ointment Industry Segmentation
-
1. Product Type
- 1.1. Topical Antibiotics
- 1.2. Silver
- 1.3. Iodine
-
2. Depth of Burn
- 2.1. Minor Burns
- 2.2. Partial Thickness Burns
- 2.3. Full Thickness Burns
-
3. End User
- 3.1. Hospitals and Clinics
- 3.2. Other End Users
Burn Ointment Industry Segmentation By Geography
-
1. North America
- 1.1. United States
- 1.2. Canada
- 1.3. Mexico
-
2. Europe
- 2.1. Germany
- 2.2. United Kingdom
- 2.3. France
- 2.4. Italy
- 2.5. Spain
- 2.6. Rest of Europe
-
3. Asia Pacific
- 3.1. China
- 3.2. Japan
- 3.3. India
- 3.4. Australia
- 3.5. South Korea
- 3.6. Rest of Asia Pacific
-
4. Middle East and Africa
- 4.1. GCC
- 4.2. South Africa
- 4.3. Rest of Middle East and Africa
-
5. South America
- 5.1. Brazil
- 5.2. Argentina
- 5.3. Rest of South America

Burn Ointment Industry Regional Market Share
Geographic Coverage of Burn Ointment Industry
Burn Ointment Industry REPORT HIGHLIGHTS
| Aspects | Details |
|---|---|
| Study Period | 2020-2034 |
| Base Year | 2025 |
| Estimated Year | 2026 |
| Forecast Period | 2026-2034 |
| Historical Period | 2020-2025 |
| Growth Rate | CAGR of 5.95% from 2020-2034 |
| Segmentation |
|
Table of Contents
- 1. Introduction
- 1.1. Research Scope
- 1.2. Market Segmentation
- 1.3. Research Methodology
- 1.4. Definitions and Assumptions
- 2. Executive Summary
- 2.1. Introduction
- 3. Market Dynamics
- 3.1. Introduction
- 3.2. Market Drivers
- 3.2.1. Rising Incidences of Burn; Increasing Awareness Regarding Treatment Options
- 3.3. Market Restrains
- 3.3.1. Side Effects Associated with Burn Ointment
- 3.4. Market Trends
- 3.4.1. The Topical Antibiotics Segment is Expected to Hold a Significant Market Share Over the Forecast Period
- 4. Market Factor Analysis
- 4.1. Porters Five Forces
- 4.2. Supply/Value Chain
- 4.3. PESTEL analysis
- 4.4. Market Entropy
- 4.5. Patent/Trademark Analysis
- 5. Global Burn Ointment Industry Analysis, Insights and Forecast, 2020-2032
- 5.1. Market Analysis, Insights and Forecast - by Product Type
- 5.1.1. Topical Antibiotics
- 5.1.2. Silver
- 5.1.3. Iodine
- 5.2. Market Analysis, Insights and Forecast - by Depth of Burn
- 5.2.1. Minor Burns
- 5.2.2. Partial Thickness Burns
- 5.2.3. Full Thickness Burns
- 5.3. Market Analysis, Insights and Forecast - by End User
- 5.3.1. Hospitals and Clinics
- 5.3.2. Other End Users
- 5.4. Market Analysis, Insights and Forecast - by Region
- 5.4.1. North America
- 5.4.2. Europe
- 5.4.3. Asia Pacific
- 5.4.4. Middle East and Africa
- 5.4.5. South America
- 5.1. Market Analysis, Insights and Forecast - by Product Type
- 6. North America Burn Ointment Industry Analysis, Insights and Forecast, 2020-2032
- 6.1. Market Analysis, Insights and Forecast - by Product Type
- 6.1.1. Topical Antibiotics
- 6.1.2. Silver
- 6.1.3. Iodine
- 6.2. Market Analysis, Insights and Forecast - by Depth of Burn
- 6.2.1. Minor Burns
- 6.2.2. Partial Thickness Burns
- 6.2.3. Full Thickness Burns
- 6.3. Market Analysis, Insights and Forecast - by End User
- 6.3.1. Hospitals and Clinics
- 6.3.2. Other End Users
- 6.1. Market Analysis, Insights and Forecast - by Product Type
- 7. Europe Burn Ointment Industry Analysis, Insights and Forecast, 2020-2032
- 7.1. Market Analysis, Insights and Forecast - by Product Type
- 7.1.1. Topical Antibiotics
- 7.1.2. Silver
- 7.1.3. Iodine
- 7.2. Market Analysis, Insights and Forecast - by Depth of Burn
- 7.2.1. Minor Burns
- 7.2.2. Partial Thickness Burns
- 7.2.3. Full Thickness Burns
- 7.3. Market Analysis, Insights and Forecast - by End User
- 7.3.1. Hospitals and Clinics
- 7.3.2. Other End Users
- 7.1. Market Analysis, Insights and Forecast - by Product Type
- 8. Asia Pacific Burn Ointment Industry Analysis, Insights and Forecast, 2020-2032
- 8.1. Market Analysis, Insights and Forecast - by Product Type
- 8.1.1. Topical Antibiotics
- 8.1.2. Silver
- 8.1.3. Iodine
- 8.2. Market Analysis, Insights and Forecast - by Depth of Burn
- 8.2.1. Minor Burns
- 8.2.2. Partial Thickness Burns
- 8.2.3. Full Thickness Burns
- 8.3. Market Analysis, Insights and Forecast - by End User
- 8.3.1. Hospitals and Clinics
- 8.3.2. Other End Users
- 8.1. Market Analysis, Insights and Forecast - by Product Type
- 9. Middle East and Africa Burn Ointment Industry Analysis, Insights and Forecast, 2020-2032
- 9.1. Market Analysis, Insights and Forecast - by Product Type
- 9.1.1. Topical Antibiotics
- 9.1.2. Silver
- 9.1.3. Iodine
- 9.2. Market Analysis, Insights and Forecast - by Depth of Burn
- 9.2.1. Minor Burns
- 9.2.2. Partial Thickness Burns
- 9.2.3. Full Thickness Burns
- 9.3. Market Analysis, Insights and Forecast - by End User
- 9.3.1. Hospitals and Clinics
- 9.3.2. Other End Users
- 9.1. Market Analysis, Insights and Forecast - by Product Type
- 10. South America Burn Ointment Industry Analysis, Insights and Forecast, 2020-2032
- 10.1. Market Analysis, Insights and Forecast - by Product Type
- 10.1.1. Topical Antibiotics
- 10.1.2. Silver
- 10.1.3. Iodine
- 10.2. Market Analysis, Insights and Forecast - by Depth of Burn
- 10.2.1. Minor Burns
- 10.2.2. Partial Thickness Burns
- 10.2.3. Full Thickness Burns
- 10.3. Market Analysis, Insights and Forecast - by End User
- 10.3.1. Hospitals and Clinics
- 10.3.2. Other End Users
- 10.1. Market Analysis, Insights and Forecast - by Product Type
- 11. North America Burn Ointment Industry Analysis, Insights and Forecast, 2020-2032
- 11.1. Market Analysis, Insights and Forecast - By Country/Sub-region
- 11.1.1 United States
- 11.1.2 Canada
- 11.1.3 Mexico
- 12. South America Burn Ointment Industry Analysis, Insights and Forecast, 2020-2032
- 12.1. Market Analysis, Insights and Forecast - By Country/Sub-region
- 12.1.1 Brazil
- 12.1.2 Mexico
- 12.1.3 Rest of South America
- 13. Europe Burn Ointment Industry Analysis, Insights and Forecast, 2020-2032
- 13.1. Market Analysis, Insights and Forecast - By Country/Sub-region
- 13.1.1 United Kingdom
- 13.1.2 Germany
- 13.1.3 France
- 13.1.4 Italy
- 13.1.5 Spain
- 13.1.6 Russia
- 13.1.7 Rest of Europe
- 14. Asia Pacific Burn Ointment Industry Analysis, Insights and Forecast, 2020-2032
- 14.1. Market Analysis, Insights and Forecast - By Country/Sub-region
- 14.1.1 China
- 14.1.2 Japan
- 14.1.3 India
- 14.1.4 South Korea
- 14.1.5 Taiwan
- 14.1.6 Australia
- 14.1.7 Rest of Asia-Pacific
- 15. MEA Burn Ointment Industry Analysis, Insights and Forecast, 2020-2032
- 15.1. Market Analysis, Insights and Forecast - By Country/Sub-region
- 15.1.1 Middle East
- 15.1.2 Africa
- 16. Competitive Analysis
- 16.1. Global Market Share Analysis 2025
- 16.2. Company Profiles
- 16.2.1 Smith & Nephew PLC
- 16.2.1.1. Overview
- 16.2.1.2. Products
- 16.2.1.3. SWOT Analysis
- 16.2.1.4. Recent Developments
- 16.2.1.5. Financials (Based on Availability)
- 16.2.2 Perrigo Company PLC
- 16.2.2.1. Overview
- 16.2.2.2. Products
- 16.2.2.3. SWOT Analysis
- 16.2.2.4. Recent Developments
- 16.2.2.5. Financials (Based on Availability)
- 16.2.3 DeRoyal Industries Inc
- 16.2.3.1. Overview
- 16.2.3.2. Products
- 16.2.3.3. SWOT Analysis
- 16.2.3.4. Recent Developments
- 16.2.3.5. Financials (Based on Availability)
- 16.2.4 Intergra LifeSciences
- 16.2.4.1. Overview
- 16.2.4.2. Products
- 16.2.4.3. SWOT Analysis
- 16.2.4.4. Recent Developments
- 16.2.4.5. Financials (Based on Availability)
- 16.2.5 3M
- 16.2.5.1. Overview
- 16.2.5.2. Products
- 16.2.5.3. SWOT Analysis
- 16.2.5.4. Recent Developments
- 16.2.5.5. Financials (Based on Availability)
- 16.2.6 ConvaTec Group PLC
- 16.2.6.1. Overview
- 16.2.6.2. Products
- 16.2.6.3. SWOT Analysis
- 16.2.6.4. Recent Developments
- 16.2.6.5. Financials (Based on Availability)
- 16.2.7 Dr Morepen
- 16.2.7.1. Overview
- 16.2.7.2. Products
- 16.2.7.3. SWOT Analysis
- 16.2.7.4. Recent Developments
- 16.2.7.5. Financials (Based on Availability)
- 16.2.8 Mankind Pharma
- 16.2.8.1. Overview
- 16.2.8.2. Products
- 16.2.8.3. SWOT Analysis
- 16.2.8.4. Recent Developments
- 16.2.8.5. Financials (Based on Availability)
- 16.2.9 Cardinal Health
- 16.2.9.1. Overview
- 16.2.9.2. Products
- 16.2.9.3. SWOT Analysis
- 16.2.9.4. Recent Developments
- 16.2.9.5. Financials (Based on Availability)
- 16.2.10 Cipla Limited
- 16.2.10.1. Overview
- 16.2.10.2. Products
- 16.2.10.3. SWOT Analysis
- 16.2.10.4. Recent Developments
- 16.2.10.5. Financials (Based on Availability)
- 16.2.11 Trio Lifescience Pvt Ltd
- 16.2.11.1. Overview
- 16.2.11.2. Products
- 16.2.11.3. SWOT Analysis
- 16.2.11.4. Recent Developments
- 16.2.11.5. Financials (Based on Availability)
- 16.2.12 Johnson & Johnson
- 16.2.12.1. Overview
- 16.2.12.2. Products
- 16.2.12.3. SWOT Analysis
- 16.2.12.4. Recent Developments
- 16.2.12.5. Financials (Based on Availability)
- 16.2.13 Sun Pharmaceutical Industries Ltd (Ranbaxy Laboratories Limited)
- 16.2.13.1. Overview
- 16.2.13.2. Products
- 16.2.13.3. SWOT Analysis
- 16.2.13.4. Recent Developments
- 16.2.13.5. Financials (Based on Availability)
- 16.2.14 GlaxoSmithKline PLC
- 16.2.14.1. Overview
- 16.2.14.2. Products
- 16.2.14.3. SWOT Analysis
- 16.2.14.4. Recent Developments
- 16.2.14.5. Financials (Based on Availability)
- 16.2.15 Pfizer Inc
- 16.2.15.1. Overview
- 16.2.15.2. Products
- 16.2.15.3. SWOT Analysis
- 16.2.15.4. Recent Developments
- 16.2.15.5. Financials (Based on Availability)
- 16.2.1 Smith & Nephew PLC
List of Figures
- Figure 1: Global Burn Ointment Industry Revenue Breakdown (Billion, %) by Region 2025 & 2033
- Figure 2: Global Burn Ointment Industry Volume Breakdown (K Tons, %) by Region 2025 & 2033
- Figure 3: North America Burn Ointment Industry Revenue (Billion), by Country 2025 & 2033
- Figure 4: North America Burn Ointment Industry Volume (K Tons), by Country 2025 & 2033
- Figure 5: North America Burn Ointment Industry Revenue Share (%), by Country 2025 & 2033
- Figure 6: North America Burn Ointment Industry Volume Share (%), by Country 2025 & 2033
- Figure 7: South America Burn Ointment Industry Revenue (Billion), by Country 2025 & 2033
- Figure 8: South America Burn Ointment Industry Volume (K Tons), by Country 2025 & 2033
- Figure 9: South America Burn Ointment Industry Revenue Share (%), by Country 2025 & 2033
- Figure 10: South America Burn Ointment Industry Volume Share (%), by Country 2025 & 2033
- Figure 11: Europe Burn Ointment Industry Revenue (Billion), by Country 2025 & 2033
- Figure 12: Europe Burn Ointment Industry Volume (K Tons), by Country 2025 & 2033
- Figure 13: Europe Burn Ointment Industry Revenue Share (%), by Country 2025 & 2033
- Figure 14: Europe Burn Ointment Industry Volume Share (%), by Country 2025 & 2033
- Figure 15: Asia Pacific Burn Ointment Industry Revenue (Billion), by Country 2025 & 2033
- Figure 16: Asia Pacific Burn Ointment Industry Volume (K Tons), by Country 2025 & 2033
- Figure 17: Asia Pacific Burn Ointment Industry Revenue Share (%), by Country 2025 & 2033
- Figure 18: Asia Pacific Burn Ointment Industry Volume Share (%), by Country 2025 & 2033
- Figure 19: MEA Burn Ointment Industry Revenue (Billion), by Country 2025 & 2033
- Figure 20: MEA Burn Ointment Industry Volume (K Tons), by Country 2025 & 2033
- Figure 21: MEA Burn Ointment Industry Revenue Share (%), by Country 2025 & 2033
- Figure 22: MEA Burn Ointment Industry Volume Share (%), by Country 2025 & 2033
- Figure 23: North America Burn Ointment Industry Revenue (Billion), by Product Type 2025 & 2033
- Figure 24: North America Burn Ointment Industry Volume (K Tons), by Product Type 2025 & 2033
- Figure 25: North America Burn Ointment Industry Revenue Share (%), by Product Type 2025 & 2033
- Figure 26: North America Burn Ointment Industry Volume Share (%), by Product Type 2025 & 2033
- Figure 27: North America Burn Ointment Industry Revenue (Billion), by Depth of Burn 2025 & 2033
- Figure 28: North America Burn Ointment Industry Volume (K Tons), by Depth of Burn 2025 & 2033
- Figure 29: North America Burn Ointment Industry Revenue Share (%), by Depth of Burn 2025 & 2033
- Figure 30: North America Burn Ointment Industry Volume Share (%), by Depth of Burn 2025 & 2033
- Figure 31: North America Burn Ointment Industry Revenue (Billion), by End User 2025 & 2033
- Figure 32: North America Burn Ointment Industry Volume (K Tons), by End User 2025 & 2033
- Figure 33: North America Burn Ointment Industry Revenue Share (%), by End User 2025 & 2033
- Figure 34: North America Burn Ointment Industry Volume Share (%), by End User 2025 & 2033
- Figure 35: North America Burn Ointment Industry Revenue (Billion), by Country 2025 & 2033
- Figure 36: North America Burn Ointment Industry Volume (K Tons), by Country 2025 & 2033
- Figure 37: North America Burn Ointment Industry Revenue Share (%), by Country 2025 & 2033
- Figure 38: North America Burn Ointment Industry Volume Share (%), by Country 2025 & 2033
- Figure 39: Europe Burn Ointment Industry Revenue (Billion), by Product Type 2025 & 2033
- Figure 40: Europe Burn Ointment Industry Volume (K Tons), by Product Type 2025 & 2033
- Figure 41: Europe Burn Ointment Industry Revenue Share (%), by Product Type 2025 & 2033
- Figure 42: Europe Burn Ointment Industry Volume Share (%), by Product Type 2025 & 2033
- Figure 43: Europe Burn Ointment Industry Revenue (Billion), by Depth of Burn 2025 & 2033
- Figure 44: Europe Burn Ointment Industry Volume (K Tons), by Depth of Burn 2025 & 2033
- Figure 45: Europe Burn Ointment Industry Revenue Share (%), by Depth of Burn 2025 & 2033
- Figure 46: Europe Burn Ointment Industry Volume Share (%), by Depth of Burn 2025 & 2033
- Figure 47: Europe Burn Ointment Industry Revenue (Billion), by End User 2025 & 2033
- Figure 48: Europe Burn Ointment Industry Volume (K Tons), by End User 2025 & 2033
- Figure 49: Europe Burn Ointment Industry Revenue Share (%), by End User 2025 & 2033
- Figure 50: Europe Burn Ointment Industry Volume Share (%), by End User 2025 & 2033
- Figure 51: Europe Burn Ointment Industry Revenue (Billion), by Country 2025 & 2033
- Figure 52: Europe Burn Ointment Industry Volume (K Tons), by Country 2025 & 2033
- Figure 53: Europe Burn Ointment Industry Revenue Share (%), by Country 2025 & 2033
- Figure 54: Europe Burn Ointment Industry Volume Share (%), by Country 2025 & 2033
- Figure 55: Asia Pacific Burn Ointment Industry Revenue (Billion), by Product Type 2025 & 2033
- Figure 56: Asia Pacific Burn Ointment Industry Volume (K Tons), by Product Type 2025 & 2033
- Figure 57: Asia Pacific Burn Ointment Industry Revenue Share (%), by Product Type 2025 & 2033
- Figure 58: Asia Pacific Burn Ointment Industry Volume Share (%), by Product Type 2025 & 2033
- Figure 59: Asia Pacific Burn Ointment Industry Revenue (Billion), by Depth of Burn 2025 & 2033
- Figure 60: Asia Pacific Burn Ointment Industry Volume (K Tons), by Depth of Burn 2025 & 2033
- Figure 61: Asia Pacific Burn Ointment Industry Revenue Share (%), by Depth of Burn 2025 & 2033
- Figure 62: Asia Pacific Burn Ointment Industry Volume Share (%), by Depth of Burn 2025 & 2033
- Figure 63: Asia Pacific Burn Ointment Industry Revenue (Billion), by End User 2025 & 2033
- Figure 64: Asia Pacific Burn Ointment Industry Volume (K Tons), by End User 2025 & 2033
- Figure 65: Asia Pacific Burn Ointment Industry Revenue Share (%), by End User 2025 & 2033
- Figure 66: Asia Pacific Burn Ointment Industry Volume Share (%), by End User 2025 & 2033
- Figure 67: Asia Pacific Burn Ointment Industry Revenue (Billion), by Country 2025 & 2033
- Figure 68: Asia Pacific Burn Ointment Industry Volume (K Tons), by Country 2025 & 2033
- Figure 69: Asia Pacific Burn Ointment Industry Revenue Share (%), by Country 2025 & 2033
- Figure 70: Asia Pacific Burn Ointment Industry Volume Share (%), by Country 2025 & 2033
- Figure 71: Middle East and Africa Burn Ointment Industry Revenue (Billion), by Product Type 2025 & 2033
- Figure 72: Middle East and Africa Burn Ointment Industry Volume (K Tons), by Product Type 2025 & 2033
- Figure 73: Middle East and Africa Burn Ointment Industry Revenue Share (%), by Product Type 2025 & 2033
- Figure 74: Middle East and Africa Burn Ointment Industry Volume Share (%), by Product Type 2025 & 2033
- Figure 75: Middle East and Africa Burn Ointment Industry Revenue (Billion), by Depth of Burn 2025 & 2033
- Figure 76: Middle East and Africa Burn Ointment Industry Volume (K Tons), by Depth of Burn 2025 & 2033
- Figure 77: Middle East and Africa Burn Ointment Industry Revenue Share (%), by Depth of Burn 2025 & 2033
- Figure 78: Middle East and Africa Burn Ointment Industry Volume Share (%), by Depth of Burn 2025 & 2033
- Figure 79: Middle East and Africa Burn Ointment Industry Revenue (Billion), by End User 2025 & 2033
- Figure 80: Middle East and Africa Burn Ointment Industry Volume (K Tons), by End User 2025 & 2033
- Figure 81: Middle East and Africa Burn Ointment Industry Revenue Share (%), by End User 2025 & 2033
- Figure 82: Middle East and Africa Burn Ointment Industry Volume Share (%), by End User 2025 & 2033
- Figure 83: Middle East and Africa Burn Ointment Industry Revenue (Billion), by Country 2025 & 2033
- Figure 84: Middle East and Africa Burn Ointment Industry Volume (K Tons), by Country 2025 & 2033
- Figure 85: Middle East and Africa Burn Ointment Industry Revenue Share (%), by Country 2025 & 2033
- Figure 86: Middle East and Africa Burn Ointment Industry Volume Share (%), by Country 2025 & 2033
- Figure 87: South America Burn Ointment Industry Revenue (Billion), by Product Type 2025 & 2033
- Figure 88: South America Burn Ointment Industry Volume (K Tons), by Product Type 2025 & 2033
- Figure 89: South America Burn Ointment Industry Revenue Share (%), by Product Type 2025 & 2033
- Figure 90: South America Burn Ointment Industry Volume Share (%), by Product Type 2025 & 2033
- Figure 91: South America Burn Ointment Industry Revenue (Billion), by Depth of Burn 2025 & 2033
- Figure 92: South America Burn Ointment Industry Volume (K Tons), by Depth of Burn 2025 & 2033
- Figure 93: South America Burn Ointment Industry Revenue Share (%), by Depth of Burn 2025 & 2033
- Figure 94: South America Burn Ointment Industry Volume Share (%), by Depth of Burn 2025 & 2033
- Figure 95: South America Burn Ointment Industry Revenue (Billion), by End User 2025 & 2033
- Figure 96: South America Burn Ointment Industry Volume (K Tons), by End User 2025 & 2033
- Figure 97: South America Burn Ointment Industry Revenue Share (%), by End User 2025 & 2033
- Figure 98: South America Burn Ointment Industry Volume Share (%), by End User 2025 & 2033
- Figure 99: South America Burn Ointment Industry Revenue (Billion), by Country 2025 & 2033
- Figure 100: South America Burn Ointment Industry Volume (K Tons), by Country 2025 & 2033
- Figure 101: South America Burn Ointment Industry Revenue Share (%), by Country 2025 & 2033
- Figure 102: South America Burn Ointment Industry Volume Share (%), by Country 2025 & 2033
List of Tables
- Table 1: Global Burn Ointment Industry Revenue Billion Forecast, by Region 2020 & 2033
- Table 2: Global Burn Ointment Industry Volume K Tons Forecast, by Region 2020 & 2033
- Table 3: Global Burn Ointment Industry Revenue Billion Forecast, by Product Type 2020 & 2033
- Table 4: Global Burn Ointment Industry Volume K Tons Forecast, by Product Type 2020 & 2033
- Table 5: Global Burn Ointment Industry Revenue Billion Forecast, by Depth of Burn 2020 & 2033
- Table 6: Global Burn Ointment Industry Volume K Tons Forecast, by Depth of Burn 2020 & 2033
- Table 7: Global Burn Ointment Industry Revenue Billion Forecast, by End User 2020 & 2033
- Table 8: Global Burn Ointment Industry Volume K Tons Forecast, by End User 2020 & 2033
- Table 9: Global Burn Ointment Industry Revenue Billion Forecast, by Region 2020 & 2033
- Table 10: Global Burn Ointment Industry Volume K Tons Forecast, by Region 2020 & 2033
- Table 11: Global Burn Ointment Industry Revenue Billion Forecast, by Country 2020 & 2033
- Table 12: Global Burn Ointment Industry Volume K Tons Forecast, by Country 2020 & 2033
- Table 13: United States Burn Ointment Industry Revenue (Billion) Forecast, by Application 2020 & 2033
- Table 14: United States Burn Ointment Industry Volume (K Tons) Forecast, by Application 2020 & 2033
- Table 15: Canada Burn Ointment Industry Revenue (Billion) Forecast, by Application 2020 & 2033
- Table 16: Canada Burn Ointment Industry Volume (K Tons) Forecast, by Application 2020 & 2033
- Table 17: Mexico Burn Ointment Industry Revenue (Billion) Forecast, by Application 2020 & 2033
- Table 18: Mexico Burn Ointment Industry Volume (K Tons) Forecast, by Application 2020 & 2033
- Table 19: Global Burn Ointment Industry Revenue Billion Forecast, by Country 2020 & 2033
- Table 20: Global Burn Ointment Industry Volume K Tons Forecast, by Country 2020 & 2033
- Table 21: Brazil Burn Ointment Industry Revenue (Billion) Forecast, by Application 2020 & 2033
- Table 22: Brazil Burn Ointment Industry Volume (K Tons) Forecast, by Application 2020 & 2033
- Table 23: Mexico Burn Ointment Industry Revenue (Billion) Forecast, by Application 2020 & 2033
- Table 24: Mexico Burn Ointment Industry Volume (K Tons) Forecast, by Application 2020 & 2033
- Table 25: Rest of South America Burn Ointment Industry Revenue (Billion) Forecast, by Application 2020 & 2033
- Table 26: Rest of South America Burn Ointment Industry Volume (K Tons) Forecast, by Application 2020 & 2033
- Table 27: Global Burn Ointment Industry Revenue Billion Forecast, by Country 2020 & 2033
- Table 28: Global Burn Ointment Industry Volume K Tons Forecast, by Country 2020 & 2033
- Table 29: United Kingdom Burn Ointment Industry Revenue (Billion) Forecast, by Application 2020 & 2033
- Table 30: United Kingdom Burn Ointment Industry Volume (K Tons) Forecast, by Application 2020 & 2033
- Table 31: Germany Burn Ointment Industry Revenue (Billion) Forecast, by Application 2020 & 2033
- Table 32: Germany Burn Ointment Industry Volume (K Tons) Forecast, by Application 2020 & 2033
- Table 33: France Burn Ointment Industry Revenue (Billion) Forecast, by Application 2020 & 2033
- Table 34: France Burn Ointment Industry Volume (K Tons) Forecast, by Application 2020 & 2033
- Table 35: Italy Burn Ointment Industry Revenue (Billion) Forecast, by Application 2020 & 2033
- Table 36: Italy Burn Ointment Industry Volume (K Tons) Forecast, by Application 2020 & 2033
- Table 37: Spain Burn Ointment Industry Revenue (Billion) Forecast, by Application 2020 & 2033
- Table 38: Spain Burn Ointment Industry Volume (K Tons) Forecast, by Application 2020 & 2033
- Table 39: Russia Burn Ointment Industry Revenue (Billion) Forecast, by Application 2020 & 2033
- Table 40: Russia Burn Ointment Industry Volume (K Tons) Forecast, by Application 2020 & 2033
- Table 41: Rest of Europe Burn Ointment Industry Revenue (Billion) Forecast, by Application 2020 & 2033
- Table 42: Rest of Europe Burn Ointment Industry Volume (K Tons) Forecast, by Application 2020 & 2033
- Table 43: Global Burn Ointment Industry Revenue Billion Forecast, by Country 2020 & 2033
- Table 44: Global Burn Ointment Industry Volume K Tons Forecast, by Country 2020 & 2033
- Table 45: China Burn Ointment Industry Revenue (Billion) Forecast, by Application 2020 & 2033
- Table 46: China Burn Ointment Industry Volume (K Tons) Forecast, by Application 2020 & 2033
- Table 47: Japan Burn Ointment Industry Revenue (Billion) Forecast, by Application 2020 & 2033
- Table 48: Japan Burn Ointment Industry Volume (K Tons) Forecast, by Application 2020 & 2033
- Table 49: India Burn Ointment Industry Revenue (Billion) Forecast, by Application 2020 & 2033
- Table 50: India Burn Ointment Industry Volume (K Tons) Forecast, by Application 2020 & 2033
- Table 51: South Korea Burn Ointment Industry Revenue (Billion) Forecast, by Application 2020 & 2033
- Table 52: South Korea Burn Ointment Industry Volume (K Tons) Forecast, by Application 2020 & 2033
- Table 53: Taiwan Burn Ointment Industry Revenue (Billion) Forecast, by Application 2020 & 2033
- Table 54: Taiwan Burn Ointment Industry Volume (K Tons) Forecast, by Application 2020 & 2033
- Table 55: Australia Burn Ointment Industry Revenue (Billion) Forecast, by Application 2020 & 2033
- Table 56: Australia Burn Ointment Industry Volume (K Tons) Forecast, by Application 2020 & 2033
- Table 57: Rest of Asia-Pacific Burn Ointment Industry Revenue (Billion) Forecast, by Application 2020 & 2033
- Table 58: Rest of Asia-Pacific Burn Ointment Industry Volume (K Tons) Forecast, by Application 2020 & 2033
- Table 59: Global Burn Ointment Industry Revenue Billion Forecast, by Country 2020 & 2033
- Table 60: Global Burn Ointment Industry Volume K Tons Forecast, by Country 2020 & 2033
- Table 61: Middle East Burn Ointment Industry Revenue (Billion) Forecast, by Application 2020 & 2033
- Table 62: Middle East Burn Ointment Industry Volume (K Tons) Forecast, by Application 2020 & 2033
- Table 63: Africa Burn Ointment Industry Revenue (Billion) Forecast, by Application 2020 & 2033
- Table 64: Africa Burn Ointment Industry Volume (K Tons) Forecast, by Application 2020 & 2033
- Table 65: Global Burn Ointment Industry Revenue Billion Forecast, by Product Type 2020 & 2033
- Table 66: Global Burn Ointment Industry Volume K Tons Forecast, by Product Type 2020 & 2033
- Table 67: Global Burn Ointment Industry Revenue Billion Forecast, by Depth of Burn 2020 & 2033
- Table 68: Global Burn Ointment Industry Volume K Tons Forecast, by Depth of Burn 2020 & 2033
- Table 69: Global Burn Ointment Industry Revenue Billion Forecast, by End User 2020 & 2033
- Table 70: Global Burn Ointment Industry Volume K Tons Forecast, by End User 2020 & 2033
- Table 71: Global Burn Ointment Industry Revenue Billion Forecast, by Country 2020 & 2033
- Table 72: Global Burn Ointment Industry Volume K Tons Forecast, by Country 2020 & 2033
- Table 73: United States Burn Ointment Industry Revenue (Billion) Forecast, by Application 2020 & 2033
- Table 74: United States Burn Ointment Industry Volume (K Tons) Forecast, by Application 2020 & 2033
- Table 75: Canada Burn Ointment Industry Revenue (Billion) Forecast, by Application 2020 & 2033
- Table 76: Canada Burn Ointment Industry Volume (K Tons) Forecast, by Application 2020 & 2033
- Table 77: Mexico Burn Ointment Industry Revenue (Billion) Forecast, by Application 2020 & 2033
- Table 78: Mexico Burn Ointment Industry Volume (K Tons) Forecast, by Application 2020 & 2033
- Table 79: Global Burn Ointment Industry Revenue Billion Forecast, by Product Type 2020 & 2033
- Table 80: Global Burn Ointment Industry Volume K Tons Forecast, by Product Type 2020 & 2033
- Table 81: Global Burn Ointment Industry Revenue Billion Forecast, by Depth of Burn 2020 & 2033
- Table 82: Global Burn Ointment Industry Volume K Tons Forecast, by Depth of Burn 2020 & 2033
- Table 83: Global Burn Ointment Industry Revenue Billion Forecast, by End User 2020 & 2033
- Table 84: Global Burn Ointment Industry Volume K Tons Forecast, by End User 2020 & 2033
- Table 85: Global Burn Ointment Industry Revenue Billion Forecast, by Country 2020 & 2033
- Table 86: Global Burn Ointment Industry Volume K Tons Forecast, by Country 2020 & 2033
- Table 87: Germany Burn Ointment Industry Revenue (Billion) Forecast, by Application 2020 & 2033
- Table 88: Germany Burn Ointment Industry Volume (K Tons) Forecast, by Application 2020 & 2033
- Table 89: United Kingdom Burn Ointment Industry Revenue (Billion) Forecast, by Application 2020 & 2033
- Table 90: United Kingdom Burn Ointment Industry Volume (K Tons) Forecast, by Application 2020 & 2033
- Table 91: France Burn Ointment Industry Revenue (Billion) Forecast, by Application 2020 & 2033
- Table 92: France Burn Ointment Industry Volume (K Tons) Forecast, by Application 2020 & 2033
- Table 93: Italy Burn Ointment Industry Revenue (Billion) Forecast, by Application 2020 & 2033
- Table 94: Italy Burn Ointment Industry Volume (K Tons) Forecast, by Application 2020 & 2033
- Table 95: Spain Burn Ointment Industry Revenue (Billion) Forecast, by Application 2020 & 2033
- Table 96: Spain Burn Ointment Industry Volume (K Tons) Forecast, by Application 2020 & 2033
- Table 97: Rest of Europe Burn Ointment Industry Revenue (Billion) Forecast, by Application 2020 & 2033
- Table 98: Rest of Europe Burn Ointment Industry Volume (K Tons) Forecast, by Application 2020 & 2033
- Table 99: Global Burn Ointment Industry Revenue Billion Forecast, by Product Type 2020 & 2033
- Table 100: Global Burn Ointment Industry Volume K Tons Forecast, by Product Type 2020 & 2033
- Table 101: Global Burn Ointment Industry Revenue Billion Forecast, by Depth of Burn 2020 & 2033
- Table 102: Global Burn Ointment Industry Volume K Tons Forecast, by Depth of Burn 2020 & 2033
- Table 103: Global Burn Ointment Industry Revenue Billion Forecast, by End User 2020 & 2033
- Table 104: Global Burn Ointment Industry Volume K Tons Forecast, by End User 2020 & 2033
- Table 105: Global Burn Ointment Industry Revenue Billion Forecast, by Country 2020 & 2033
- Table 106: Global Burn Ointment Industry Volume K Tons Forecast, by Country 2020 & 2033
- Table 107: China Burn Ointment Industry Revenue (Billion) Forecast, by Application 2020 & 2033
- Table 108: China Burn Ointment Industry Volume (K Tons) Forecast, by Application 2020 & 2033
- Table 109: Japan Burn Ointment Industry Revenue (Billion) Forecast, by Application 2020 & 2033
- Table 110: Japan Burn Ointment Industry Volume (K Tons) Forecast, by Application 2020 & 2033
- Table 111: India Burn Ointment Industry Revenue (Billion) Forecast, by Application 2020 & 2033
- Table 112: India Burn Ointment Industry Volume (K Tons) Forecast, by Application 2020 & 2033
- Table 113: Australia Burn Ointment Industry Revenue (Billion) Forecast, by Application 2020 & 2033
- Table 114: Australia Burn Ointment Industry Volume (K Tons) Forecast, by Application 2020 & 2033
- Table 115: South Korea Burn Ointment Industry Revenue (Billion) Forecast, by Application 2020 & 2033
- Table 116: South Korea Burn Ointment Industry Volume (K Tons) Forecast, by Application 2020 & 2033
- Table 117: Rest of Asia Pacific Burn Ointment Industry Revenue (Billion) Forecast, by Application 2020 & 2033
- Table 118: Rest of Asia Pacific Burn Ointment Industry Volume (K Tons) Forecast, by Application 2020 & 2033
- Table 119: Global Burn Ointment Industry Revenue Billion Forecast, by Product Type 2020 & 2033
- Table 120: Global Burn Ointment Industry Volume K Tons Forecast, by Product Type 2020 & 2033
- Table 121: Global Burn Ointment Industry Revenue Billion Forecast, by Depth of Burn 2020 & 2033
- Table 122: Global Burn Ointment Industry Volume K Tons Forecast, by Depth of Burn 2020 & 2033
- Table 123: Global Burn Ointment Industry Revenue Billion Forecast, by End User 2020 & 2033
- Table 124: Global Burn Ointment Industry Volume K Tons Forecast, by End User 2020 & 2033
- Table 125: Global Burn Ointment Industry Revenue Billion Forecast, by Country 2020 & 2033
- Table 126: Global Burn Ointment Industry Volume K Tons Forecast, by Country 2020 & 2033
- Table 127: GCC Burn Ointment Industry Revenue (Billion) Forecast, by Application 2020 & 2033
- Table 128: GCC Burn Ointment Industry Volume (K Tons) Forecast, by Application 2020 & 2033
- Table 129: South Africa Burn Ointment Industry Revenue (Billion) Forecast, by Application 2020 & 2033
- Table 130: South Africa Burn Ointment Industry Volume (K Tons) Forecast, by Application 2020 & 2033
- Table 131: Rest of Middle East and Africa Burn Ointment Industry Revenue (Billion) Forecast, by Application 2020 & 2033
- Table 132: Rest of Middle East and Africa Burn Ointment Industry Volume (K Tons) Forecast, by Application 2020 & 2033
- Table 133: Global Burn Ointment Industry Revenue Billion Forecast, by Product Type 2020 & 2033
- Table 134: Global Burn Ointment Industry Volume K Tons Forecast, by Product Type 2020 & 2033
- Table 135: Global Burn Ointment Industry Revenue Billion Forecast, by Depth of Burn 2020 & 2033
- Table 136: Global Burn Ointment Industry Volume K Tons Forecast, by Depth of Burn 2020 & 2033
- Table 137: Global Burn Ointment Industry Revenue Billion Forecast, by End User 2020 & 2033
- Table 138: Global Burn Ointment Industry Volume K Tons Forecast, by End User 2020 & 2033
- Table 139: Global Burn Ointment Industry Revenue Billion Forecast, by Country 2020 & 2033
- Table 140: Global Burn Ointment Industry Volume K Tons Forecast, by Country 2020 & 2033
- Table 141: Brazil Burn Ointment Industry Revenue (Billion) Forecast, by Application 2020 & 2033
- Table 142: Brazil Burn Ointment Industry Volume (K Tons) Forecast, by Application 2020 & 2033
- Table 143: Argentina Burn Ointment Industry Revenue (Billion) Forecast, by Application 2020 & 2033
- Table 144: Argentina Burn Ointment Industry Volume (K Tons) Forecast, by Application 2020 & 2033
- Table 145: Rest of South America Burn Ointment Industry Revenue (Billion) Forecast, by Application 2020 & 2033
- Table 146: Rest of South America Burn Ointment Industry Volume (K Tons) Forecast, by Application 2020 & 2033
Frequently Asked Questions
1. What is the projected Compound Annual Growth Rate (CAGR) of the Burn Ointment Industry?
The projected CAGR is approximately 5.95%.
2. Which companies are prominent players in the Burn Ointment Industry?
Key companies in the market include Smith & Nephew PLC, Perrigo Company PLC, DeRoyal Industries Inc, Intergra LifeSciences, 3M, ConvaTec Group PLC, Dr Morepen, Mankind Pharma, Cardinal Health, Cipla Limited, Trio Lifescience Pvt Ltd, Johnson & Johnson, Sun Pharmaceutical Industries Ltd (Ranbaxy Laboratories Limited), GlaxoSmithKline PLC, Pfizer Inc.
3. What are the main segments of the Burn Ointment Industry?
The market segments include Product Type, Depth of Burn, End User.
4. Can you provide details about the market size?
The market size is estimated to be USD 1.1 Billion as of 2022.
5. What are some drivers contributing to market growth?
Rising Incidences of Burn; Increasing Awareness Regarding Treatment Options.
6. What are the notable trends driving market growth?
The Topical Antibiotics Segment is Expected to Hold a Significant Market Share Over the Forecast Period.
7. Are there any restraints impacting market growth?
Side Effects Associated with Burn Ointment.
8. Can you provide examples of recent developments in the market?
In May 2022, Molncyke Healthcare sunmitted the clinical evidence in Wound International 2022 on the use of Mediplex Ag for the management of partial thickness burns. The soft silicone wound contact layer in Mediplex designed to help minimise wound and peri-wound trauma and associated pain aided in the burn healing.
9. What pricing options are available for accessing the report?
Pricing options include single-user, multi-user, and enterprise licenses priced at USD 4750, USD 5250, and USD 8750 respectively.
10. Is the market size provided in terms of value or volume?
The market size is provided in terms of value, measured in Billion and volume, measured in K Tons.
11. Are there any specific market keywords associated with the report?
Yes, the market keyword associated with the report is "Burn Ointment Industry," which aids in identifying and referencing the specific market segment covered.
12. How do I determine which pricing option suits my needs best?
The pricing options vary based on user requirements and access needs. Individual users may opt for single-user licenses, while businesses requiring broader access may choose multi-user or enterprise licenses for cost-effective access to the report.
13. Are there any additional resources or data provided in the Burn Ointment Industry report?
While the report offers comprehensive insights, it's advisable to review the specific contents or supplementary materials provided to ascertain if additional resources or data are available.
14. How can I stay updated on further developments or reports in the Burn Ointment Industry?
To stay informed about further developments, trends, and reports in the Burn Ointment Industry, consider subscribing to industry newsletters, following relevant companies and organizations, or regularly checking reputable industry news sources and publications.
Methodology
Step 1 - Identification of Relevant Samples Size from Population Database


Step 2 - Approaches for Defining Global Market Size (Value, Volume* & Price*)

Note*: In applicable scenarios
Step 3 - Data Sources
Primary Research
- Web Analytics
- Survey Reports
- Research Institute
- Latest Research Reports
- Opinion Leaders
Secondary Research
- Annual Reports
- White Paper
- Latest Press Release
- Industry Association
- Paid Database
- Investor Presentations

Step 4 - Data Triangulation
Involves using different sources of information in order to increase the validity of a study
These sources are likely to be stakeholders in a program - participants, other researchers, program staff, other community members, and so on.
Then we put all data in single framework & apply various statistical tools to find out the dynamic on the market.
During the analysis stage, feedback from the stakeholder groups would be compared to determine areas of agreement as well as areas of divergence
