

Key Insights
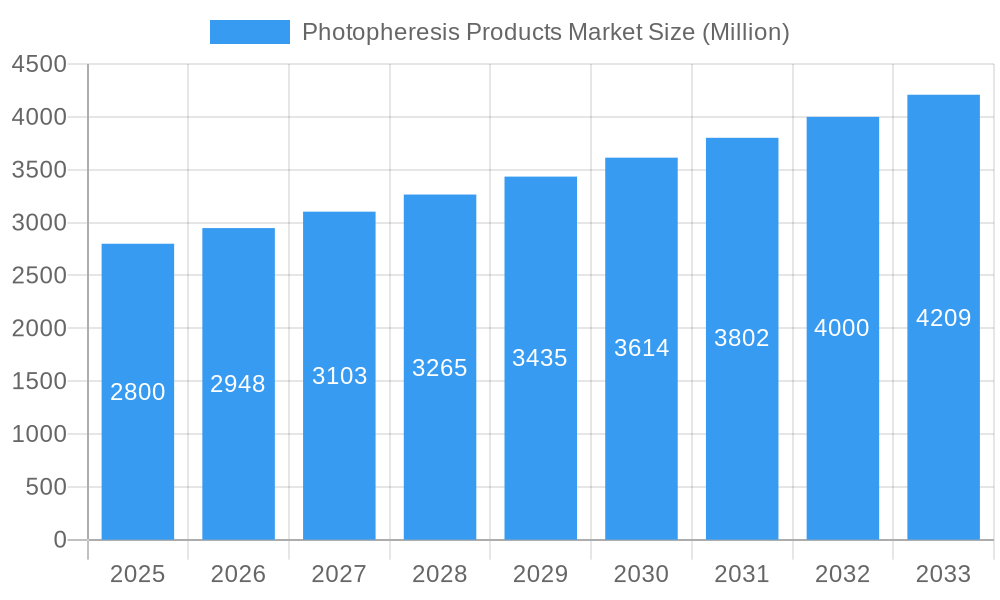
The Photopheresis Products Market is projected for significant expansion, with an estimated market size of $342.86 million in 2025 and a projected Compound Annual Growth Rate (CAGR) of 5.6% through 2033. This growth is propelled by the increasing incidence of Graft versus Host Disease (GvHD), Cutaneous T-Cell Lymphoma (CTCL), and a rising prevalence of autoimmune disorders necessitating advanced therapeutic solutions. The growing utilization of photopheresis in transplant centers and specialized hospitals for managing these complex conditions, alongside advancements in device technology and therapeutic protocols, are key drivers. Enhanced healthcare expenditure and greater awareness of photopheresis as an effective treatment option, particularly for graft rejection and chronic autoimmune conditions, further support market expansion.
Photopheresis Products Market Market Size (In Million)
The market is segmented by product type, with both open and closed systems experiencing substantial demand. Closed systems, offering superior patient safety and reduced infection risks, are anticipated to see increased adoption. In terms of applications, GvHD and CTCL remain dominant segments, while the application in autoimmune diseases is poised for considerable growth due to the expanding therapeutic scope of photopheresis in treating conditions such as multiple sclerosis and rheumatoid arthritis. Hospitals constitute the largest end-user segment, owing to their comprehensive infrastructure and capability in managing complex patient care. Geographically, North America and Europe currently lead the market, driven by advanced healthcare systems and early adoption of innovative medical technologies. However, the Asia Pacific region, particularly China and India, is expected to emerge as a high-growth market due to escalating healthcare investments, a large patient demographic, and improving access to advanced medical treatments. Primary restraints include the high initial cost of photopheresis devices and the requirement for specialized professional training; however, ongoing technological innovation and a deeper understanding of its therapeutic benefits are expected to mitigate these challenges.
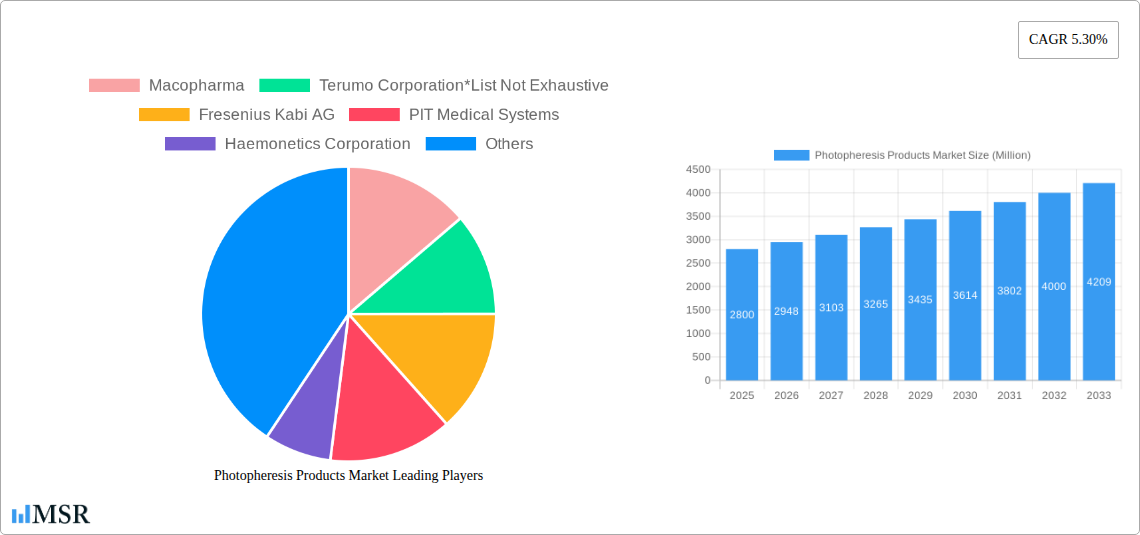
Photopheresis Products Market Company Market Share
Photopheresis Products Market: Comprehensive Analysis & Future Projections (2019-2033)
This comprehensive report provides an in-depth analysis of the global Photopheresis Products Market, a vital sector in advanced medical treatments. Covering the historical period from 2019 to 2024, with 2025 as the base year, and a robust forecast extending to 2033, this analysis examines market dynamics, key trends, and strategic opportunities. With an estimated market size of $342.86 million in 2025 and a CAGR of 5.6%, the Photopheresis Products Market is set for significant expansion, driven by the increasing adoption of extracorporeal photopheresis (ECP) for managing complex conditions like Graft versus Host Disease (GvHD) and Cutaneous T-Cell Lymphoma (CTCL). The report dissects the market by product type (Open System, Closed System), application (Graft versus Host Disease, Cutaneous T-Cell Lymphoma, Transplant Rejections, Autoimmune Diseases), and end-user (Hospitals, Ambulatory Centers, Other End Users), offering granular insights into each segment's growth trajectory. Discover the strategic initiatives of key industry players including Macopharma, Terumo Corporation, Fresenius Kabi AG, PIT Medical Systems, Haemonetics Corporation, and Mallinckrodt Pharmaceuticals. This report is an essential resource for pharmaceutical companies, medical device manufacturers, healthcare providers, investors, and researchers aiming to leverage the evolving photopheresis therapy landscape and drive innovation in immunomodulatory treatments.
Photopheresis Products Market Market Concentration & Dynamics
The Photopheresis Products Market exhibits a moderate to high level of market concentration, characterized by the presence of established players with significant market share. The innovation ecosystem is thriving, with continuous research and development focused on enhancing ECP device efficiency, patient comfort, and therapeutic outcomes for lymphoma treatment and transplant rejection prevention. Regulatory frameworks, while stringent, are evolving to accommodate advancements in photopheresis technology. The market is less susceptible to direct substitute products, as ECP offers a unique therapeutic pathway for specific immunological disorders. End-user trends reveal a growing preference for closed-system photopheresis due to its perceived safety and efficacy, particularly in managing autoimmune diseases. Merger and acquisition (M&A) activities, though not rampant, are strategic, aimed at consolidating market presence or acquiring specialized technologies. For instance, a recent M&A deal in the broader apheresis market underscored the consolidation trend, with a deal value estimated to be in the range of $200 Million to $300 Million. The market share of leading players like Macopharma and Terumo Corporation is estimated to collectively exceed 40% in 2025.
Photopheresis Products Market Industry Insights & Trends
The Photopheresis Products Market is experiencing robust growth, driven by a confluence of factors including the increasing prevalence of chronic diseases requiring advanced immunomodulatory therapies, such as Graft versus Host Disease (GvHD) and Cutaneous T-Cell Lymphoma (CTCL). The market size is projected to reach over $900 Million by 2033, with a Compound Annual Growth Rate (CAGR) of approximately 7.5% during the forecast period (2025-2033). Technological disruptions are playing a pivotal role, with advancements in closed-system photopheresis devices offering enhanced patient safety, reduced procedural times, and improved treatment efficacy. This is particularly evident in the application for transplant rejection management, where ECP is gaining traction as a supportive therapy. Evolving consumer behaviors, or rather, patient and physician preferences, are tilting towards less invasive and more targeted therapeutic interventions, making photopheresis a compelling option. The rising incidence of autoimmune diseases globally further fuels demand for effective treatment modalities. The global market size for ECP devices and disposables was estimated at $550 Million in 2024, a figure expected to grow substantially. Furthermore, the increasing adoption of ECP in ambulatory settings, alongside traditional hospital-based treatments, expands accessibility and market reach. The ongoing investment in healthcare infrastructure in emerging economies also contributes to market expansion, providing a fertile ground for the penetration of photopheresis therapies. The integration of AI and machine learning in optimizing treatment protocols is another emerging trend that promises to enhance the precision and effectiveness of photopheresis.
Key Markets & Segments Leading Photopheresis Products Market
The North America region is currently the dominant market for photopheresis products, primarily driven by a well-established healthcare infrastructure, high adoption rates of advanced medical technologies, and a strong research and development ecosystem for immunotherapy. The United States, in particular, represents a significant share of this market, fueled by robust reimbursement policies and a high incidence of conditions treated by photopheresis, such as Graft versus Host Disease (GvHD) and Cutaneous T-Cell Lymphoma (CTCL).
Dominant Regions:
- North America (estimated market share of 45% in 2025)
- Europe (estimated market share of 30% in 2025)
- Asia Pacific (growing rapidly, estimated market share of 20% in 2025)
Leading Segments:
- Product Type: The Closed System segment is leading the market due to its enhanced safety, reduced risk of infection, and integrated treatment process, offering a significant competitive edge over Open System photopheresis. The market share for closed systems is estimated to be around 70% in 2025.
- Application: Graft versus Host Disease (GvHD) and Cutaneous T-Cell Lymphoma (CTCL) are the primary applications driving market growth. The demand for photopheresis in treating these conditions is substantial, with a combined market share estimated at over 60%. The increasing number of organ transplants globally also bolsters the demand for photopheresis in managing transplant rejections.
- End User: Hospitals constitute the largest end-user segment, accounting for an estimated 65% market share in 2025, owing to their comprehensive treatment facilities and specialized medical staff. However, the growth of Ambulatory Centers is a significant trend, reflecting the increasing outpatient management of certain chronic conditions.
Drivers for dominance in these segments include:
- Economic Growth: Strong economic conditions in North America and Europe support higher healthcare expenditure and investment in advanced medical devices.
- Infrastructure Development: Advanced hospital infrastructure and the establishment of specialized apheresis units are critical for effective photopheresis delivery.
- Regulatory Support: Favorable regulatory environments that facilitate the approval and adoption of new photopheresis technologies.
- Awareness and Education: Growing physician and patient awareness regarding the benefits of photopheresis in treating specific hematological and immunological disorders.
Photopheresis Products Market Product Developments
Product innovation is a cornerstone of the Photopheresis Products Market. Recent developments focus on creating more user-friendly, efficient, and automated photopheresis systems. Advancements in UV light delivery and wavelength customization are enhancing therapeutic efficacy for applications like Cutaneous T-Cell Lymphoma (CTCL) and Graft versus Host Disease (GvHD). The trend towards integrated closed-system photopheresis devices, which streamline the apheresis, treatment, and reinfusion process, is a significant competitive advantage, offering improved patient safety and reduced procedural complexity. These advancements are crucial for expanding the application of photopheresis in managing autoimmune diseases and transplant rejections.
Challenges in the Photopheresis Products Market Market
Despite its growth, the Photopheresis Products Market faces several challenges. High initial investment costs for advanced photopheresis devices can be a barrier for smaller healthcare facilities. Stringent regulatory approvals for new technologies, while ensuring safety, can also lead to extended market entry timelines. Furthermore, the availability of skilled personnel to operate complex photopheresis equipment and administer ECP therapy can be a constraint in certain regions. Reimbursement complexities for photopheresis procedures in some healthcare systems can also impact market penetration. For instance, securing adequate reimbursement for novel ECP protocols for autoimmune diseases is an ongoing challenge.
Forces Driving Photopheresis Products Market Growth
Several forces are propelling the growth of the Photopheresis Products Market. The increasing global incidence of lymphoma, autoimmune diseases, and the growing number of organ transplants are primary drivers, necessitating effective immunomodulatory treatments like photopheresis. Technological advancements in extracorporeal photopheresis (ECP) devices, leading to improved efficacy, safety, and patient comfort, are critical growth catalysts. Expanding reimbursement coverage for ECP therapies in various indications, coupled with increasing physician awareness and adoption, further bolsters market expansion. The growing preference for closed-system photopheresis also contributes significantly to market growth.
Challenges in the Photopheresis Products Market Market
Long-term growth in the Photopheresis Products Market will be fueled by continued innovation in treatment protocols and device technology. Expanding the therapeutic applications of photopheresis beyond current indications, such as exploring its efficacy in other autoimmune diseases or neurological disorders, presents a significant opportunity. Partnerships between device manufacturers and research institutions to conduct clinical trials and generate robust evidence for new applications will be crucial. Market expansion into emerging economies, where the demand for advanced healthcare solutions is rising, will also be a key growth catalyst. The development of more cost-effective ECP solutions will broaden accessibility.
Emerging Opportunities in Photopheresis Products Market
Emerging opportunities in the Photopheresis Products Market lie in the exploration of novel applications for photopheresis, particularly in the realm of chronic autoimmune conditions and inflammatory diseases where existing treatments may be insufficient. The development of portable and more affordable ECP devices could unlock significant growth in underserved markets. Furthermore, the integration of advanced data analytics and AI for personalized photopheresis treatment planning presents a significant opportunity to optimize outcomes and demonstrate value. The increasing focus on cell-based therapies and immunomodulation globally positions photopheresis as a vital component in future treatment paradigms.
Leading Players in the Photopheresis Products Market Sector
- Macopharma
- Terumo Corporation
- Fresenius Kabi AG
- PIT Medical Systems
- Haemonetics Corporation
- Mallinckrodt Pharmaceuticals
Key Milestones in Photopheresis Products Market Industry
- September 2022: UAE opened a new apheresis unit in the Sheikh Shakhbout Medical City (SSMC) as a collaboration between Abu Dhabi Health Services Company (SEHA) and Mayo Clinic. Sheikh Shakhbout Medical City widens the treatment scope for diseases, including rare lymphoma of the skin. This expansion signifies a growing investment in advanced apheresis capabilities in emerging markets, potentially boosting demand for photopheresis.
- August 2022: Ikaria Australia Pty Ltd, a Mallinckrodt Pharmaceuticals company, launched THERAKOS CELLEX Photopheresis System to the Australian market. The CELLEX instrument performs the extraction, treatment, and reinfusion of white blood cells for an integrated, closed photopheresis procedure. This launch highlights the continued product innovation and geographical expansion efforts by key players in the closed-system photopheresis segment.
Strategic Outlook for Photopheresis Products Market Market
The strategic outlook for the Photopheresis Products Market is highly optimistic, driven by relentless innovation and expanding clinical applications. Growth accelerators include the increasing adoption of closed-system photopheresis for its enhanced safety and efficacy in managing complex conditions like Graft versus Host Disease (GvHD) and Cutaneous T-Cell Lymphoma (CTCL). Key players are expected to focus on geographic expansion, particularly in Asia Pacific and Latin America, to tap into the burgeoning demand for advanced medical treatments. Strategic partnerships and collaborations aimed at developing new therapeutic indications for photopheresis, especially in autoimmune diseases and transplant rejection, will be crucial for sustained market leadership. The continuous evolution of ECP technology towards greater automation and patient comfort will further solidify its position as a vital modality in the global healthcare landscape.
Photopheresis Products Market Segmentation
-
1. Product Type
- 1.1. Open System
- 1.2. Closed System
-
2. Application
- 2.1. Graft versus Host Disease
- 2.2. Cutaneous T-Cell Lymphoma
- 2.3. Transplant Rejections
- 2.4. Autoimmune Diseases
-
3. End User
- 3.1. Hospitals
- 3.2. Ambulatory Centers
- 3.3. Other End Users
Photopheresis Products Market Segmentation By Geography
-
1. North America
- 1.1. United States
- 1.2. Canada
- 1.3. Mexico
-
2. Europe
- 2.1. Germany
- 2.2. United Kingdom
- 2.3. France
- 2.4. Italy
- 2.5. Spain
- 2.6. Rest of Europe
-
3. Asia Pacific
- 3.1. China
- 3.2. Japan
- 3.3. India
- 3.4. Australia
- 3.5. South Korea
- 3.6. Rest of Asia Pacific
-
4. Middle East and Africa
- 4.1. GCC
- 4.2. South Africa
- 4.3. Rest of Middle East and Africa
-
5. South America
- 5.1. Brazil
- 5.2. Argentina
- 5.3. Rest of South America
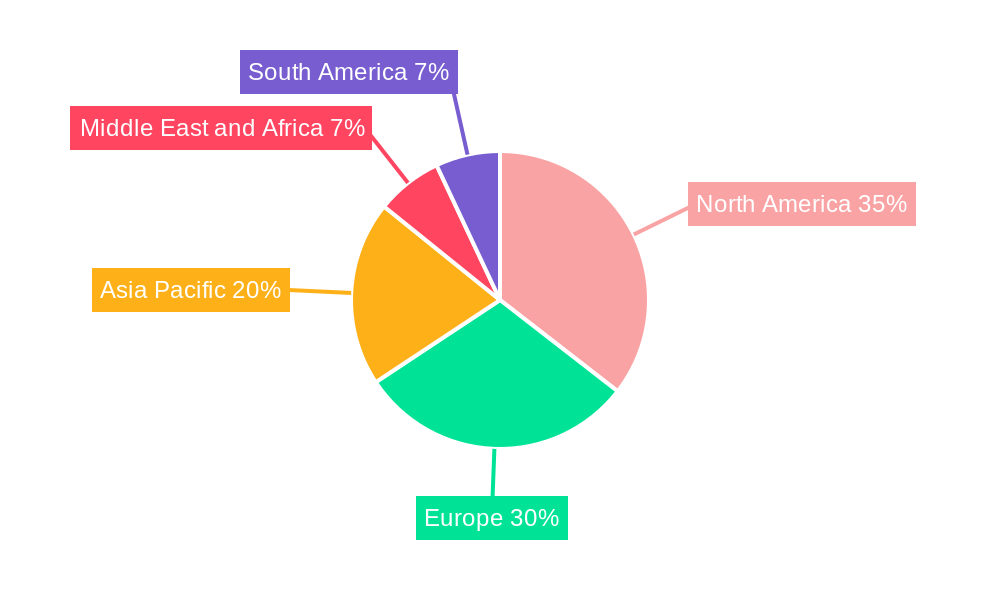
Photopheresis Products Market Regional Market Share
Geographic Coverage of Photopheresis Products Market
Photopheresis Products Market REPORT HIGHLIGHTS
| Aspects | Details |
|---|---|
| Study Period | 2020-2034 |
| Base Year | 2025 |
| Estimated Year | 2026 |
| Forecast Period | 2026-2034 |
| Historical Period | 2020-2025 |
| Growth Rate | CAGR of 5.6% from 2020-2034 |
| Segmentation |
|
Table of Contents
- 1. Introduction
- 1.1. Research Scope
- 1.2. Market Segmentation
- 1.3. Research Methodology
- 1.4. Definitions and Assumptions
- 2. Executive Summary
- 2.1. Introduction
- 3. Market Dynamics
- 3.1. Introduction
- 3.2. Market Drivers
- 3.2.1. Rise in Prevalence of Autoimmune Diseases; Increasing Technological Advancements
- 3.3. Market Restrains
- 3.3.1. Low Adoption of Photopheresis in Pediatric Patients and Lack of Skilled Professionals
- 3.4. Market Trends
- 3.4.1. Chronic Graft Versus Host Disease (GvHD) is Expected to Hold a Significant Market Share in the Market Studied.
- 4. Market Factor Analysis
- 4.1. Porters Five Forces
- 4.2. Supply/Value Chain
- 4.3. PESTEL analysis
- 4.4. Market Entropy
- 4.5. Patent/Trademark Analysis
- 5. Global Photopheresis Products Market Analysis, Insights and Forecast, 2020-2032
- 5.1. Market Analysis, Insights and Forecast - by Product Type
- 5.1.1. Open System
- 5.1.2. Closed System
- 5.2. Market Analysis, Insights and Forecast - by Application
- 5.2.1. Graft versus Host Disease
- 5.2.2. Cutaneous T-Cell Lymphoma
- 5.2.3. Transplant Rejections
- 5.2.4. Autoimmune Diseases
- 5.3. Market Analysis, Insights and Forecast - by End User
- 5.3.1. Hospitals
- 5.3.2. Ambulatory Centers
- 5.3.3. Other End Users
- 5.4. Market Analysis, Insights and Forecast - by Region
- 5.4.1. North America
- 5.4.2. Europe
- 5.4.3. Asia Pacific
- 5.4.4. Middle East and Africa
- 5.4.5. South America
- 5.1. Market Analysis, Insights and Forecast - by Product Type
- 6. North America Photopheresis Products Market Analysis, Insights and Forecast, 2020-2032
- 6.1. Market Analysis, Insights and Forecast - by Product Type
- 6.1.1. Open System
- 6.1.2. Closed System
- 6.2. Market Analysis, Insights and Forecast - by Application
- 6.2.1. Graft versus Host Disease
- 6.2.2. Cutaneous T-Cell Lymphoma
- 6.2.3. Transplant Rejections
- 6.2.4. Autoimmune Diseases
- 6.3. Market Analysis, Insights and Forecast - by End User
- 6.3.1. Hospitals
- 6.3.2. Ambulatory Centers
- 6.3.3. Other End Users
- 6.1. Market Analysis, Insights and Forecast - by Product Type
- 7. Europe Photopheresis Products Market Analysis, Insights and Forecast, 2020-2032
- 7.1. Market Analysis, Insights and Forecast - by Product Type
- 7.1.1. Open System
- 7.1.2. Closed System
- 7.2. Market Analysis, Insights and Forecast - by Application
- 7.2.1. Graft versus Host Disease
- 7.2.2. Cutaneous T-Cell Lymphoma
- 7.2.3. Transplant Rejections
- 7.2.4. Autoimmune Diseases
- 7.3. Market Analysis, Insights and Forecast - by End User
- 7.3.1. Hospitals
- 7.3.2. Ambulatory Centers
- 7.3.3. Other End Users
- 7.1. Market Analysis, Insights and Forecast - by Product Type
- 8. Asia Pacific Photopheresis Products Market Analysis, Insights and Forecast, 2020-2032
- 8.1. Market Analysis, Insights and Forecast - by Product Type
- 8.1.1. Open System
- 8.1.2. Closed System
- 8.2. Market Analysis, Insights and Forecast - by Application
- 8.2.1. Graft versus Host Disease
- 8.2.2. Cutaneous T-Cell Lymphoma
- 8.2.3. Transplant Rejections
- 8.2.4. Autoimmune Diseases
- 8.3. Market Analysis, Insights and Forecast - by End User
- 8.3.1. Hospitals
- 8.3.2. Ambulatory Centers
- 8.3.3. Other End Users
- 8.1. Market Analysis, Insights and Forecast - by Product Type
- 9. Middle East and Africa Photopheresis Products Market Analysis, Insights and Forecast, 2020-2032
- 9.1. Market Analysis, Insights and Forecast - by Product Type
- 9.1.1. Open System
- 9.1.2. Closed System
- 9.2. Market Analysis, Insights and Forecast - by Application
- 9.2.1. Graft versus Host Disease
- 9.2.2. Cutaneous T-Cell Lymphoma
- 9.2.3. Transplant Rejections
- 9.2.4. Autoimmune Diseases
- 9.3. Market Analysis, Insights and Forecast - by End User
- 9.3.1. Hospitals
- 9.3.2. Ambulatory Centers
- 9.3.3. Other End Users
- 9.1. Market Analysis, Insights and Forecast - by Product Type
- 10. South America Photopheresis Products Market Analysis, Insights and Forecast, 2020-2032
- 10.1. Market Analysis, Insights and Forecast - by Product Type
- 10.1.1. Open System
- 10.1.2. Closed System
- 10.2. Market Analysis, Insights and Forecast - by Application
- 10.2.1. Graft versus Host Disease
- 10.2.2. Cutaneous T-Cell Lymphoma
- 10.2.3. Transplant Rejections
- 10.2.4. Autoimmune Diseases
- 10.3. Market Analysis, Insights and Forecast - by End User
- 10.3.1. Hospitals
- 10.3.2. Ambulatory Centers
- 10.3.3. Other End Users
- 10.1. Market Analysis, Insights and Forecast - by Product Type
- 11. Competitive Analysis
- 11.1. Global Market Share Analysis 2025
- 11.2. Company Profiles
- 11.2.1 Macopharma
- 11.2.1.1. Overview
- 11.2.1.2. Products
- 11.2.1.3. SWOT Analysis
- 11.2.1.4. Recent Developments
- 11.2.1.5. Financials (Based on Availability)
- 11.2.2 Terumo Corporation*List Not Exhaustive
- 11.2.2.1. Overview
- 11.2.2.2. Products
- 11.2.2.3. SWOT Analysis
- 11.2.2.4. Recent Developments
- 11.2.2.5. Financials (Based on Availability)
- 11.2.3 Fresenius Kabi AG
- 11.2.3.1. Overview
- 11.2.3.2. Products
- 11.2.3.3. SWOT Analysis
- 11.2.3.4. Recent Developments
- 11.2.3.5. Financials (Based on Availability)
- 11.2.4 PIT Medical Systems
- 11.2.4.1. Overview
- 11.2.4.2. Products
- 11.2.4.3. SWOT Analysis
- 11.2.4.4. Recent Developments
- 11.2.4.5. Financials (Based on Availability)
- 11.2.5 Haemonetics Corporation
- 11.2.5.1. Overview
- 11.2.5.2. Products
- 11.2.5.3. SWOT Analysis
- 11.2.5.4. Recent Developments
- 11.2.5.5. Financials (Based on Availability)
- 11.2.6 Mallinckrodt Pharmaceuticals
- 11.2.6.1. Overview
- 11.2.6.2. Products
- 11.2.6.3. SWOT Analysis
- 11.2.6.4. Recent Developments
- 11.2.6.5. Financials (Based on Availability)
- 11.2.1 Macopharma
List of Figures
- Figure 1: Global Photopheresis Products Market Revenue Breakdown (million, %) by Region 2025 & 2033
- Figure 2: North America Photopheresis Products Market Revenue (million), by Product Type 2025 & 2033
- Figure 3: North America Photopheresis Products Market Revenue Share (%), by Product Type 2025 & 2033
- Figure 4: North America Photopheresis Products Market Revenue (million), by Application 2025 & 2033
- Figure 5: North America Photopheresis Products Market Revenue Share (%), by Application 2025 & 2033
- Figure 6: North America Photopheresis Products Market Revenue (million), by End User 2025 & 2033
- Figure 7: North America Photopheresis Products Market Revenue Share (%), by End User 2025 & 2033
- Figure 8: North America Photopheresis Products Market Revenue (million), by Country 2025 & 2033
- Figure 9: North America Photopheresis Products Market Revenue Share (%), by Country 2025 & 2033
- Figure 10: Europe Photopheresis Products Market Revenue (million), by Product Type 2025 & 2033
- Figure 11: Europe Photopheresis Products Market Revenue Share (%), by Product Type 2025 & 2033
- Figure 12: Europe Photopheresis Products Market Revenue (million), by Application 2025 & 2033
- Figure 13: Europe Photopheresis Products Market Revenue Share (%), by Application 2025 & 2033
- Figure 14: Europe Photopheresis Products Market Revenue (million), by End User 2025 & 2033
- Figure 15: Europe Photopheresis Products Market Revenue Share (%), by End User 2025 & 2033
- Figure 16: Europe Photopheresis Products Market Revenue (million), by Country 2025 & 2033
- Figure 17: Europe Photopheresis Products Market Revenue Share (%), by Country 2025 & 2033
- Figure 18: Asia Pacific Photopheresis Products Market Revenue (million), by Product Type 2025 & 2033
- Figure 19: Asia Pacific Photopheresis Products Market Revenue Share (%), by Product Type 2025 & 2033
- Figure 20: Asia Pacific Photopheresis Products Market Revenue (million), by Application 2025 & 2033
- Figure 21: Asia Pacific Photopheresis Products Market Revenue Share (%), by Application 2025 & 2033
- Figure 22: Asia Pacific Photopheresis Products Market Revenue (million), by End User 2025 & 2033
- Figure 23: Asia Pacific Photopheresis Products Market Revenue Share (%), by End User 2025 & 2033
- Figure 24: Asia Pacific Photopheresis Products Market Revenue (million), by Country 2025 & 2033
- Figure 25: Asia Pacific Photopheresis Products Market Revenue Share (%), by Country 2025 & 2033
- Figure 26: Middle East and Africa Photopheresis Products Market Revenue (million), by Product Type 2025 & 2033
- Figure 27: Middle East and Africa Photopheresis Products Market Revenue Share (%), by Product Type 2025 & 2033
- Figure 28: Middle East and Africa Photopheresis Products Market Revenue (million), by Application 2025 & 2033
- Figure 29: Middle East and Africa Photopheresis Products Market Revenue Share (%), by Application 2025 & 2033
- Figure 30: Middle East and Africa Photopheresis Products Market Revenue (million), by End User 2025 & 2033
- Figure 31: Middle East and Africa Photopheresis Products Market Revenue Share (%), by End User 2025 & 2033
- Figure 32: Middle East and Africa Photopheresis Products Market Revenue (million), by Country 2025 & 2033
- Figure 33: Middle East and Africa Photopheresis Products Market Revenue Share (%), by Country 2025 & 2033
- Figure 34: South America Photopheresis Products Market Revenue (million), by Product Type 2025 & 2033
- Figure 35: South America Photopheresis Products Market Revenue Share (%), by Product Type 2025 & 2033
- Figure 36: South America Photopheresis Products Market Revenue (million), by Application 2025 & 2033
- Figure 37: South America Photopheresis Products Market Revenue Share (%), by Application 2025 & 2033
- Figure 38: South America Photopheresis Products Market Revenue (million), by End User 2025 & 2033
- Figure 39: South America Photopheresis Products Market Revenue Share (%), by End User 2025 & 2033
- Figure 40: South America Photopheresis Products Market Revenue (million), by Country 2025 & 2033
- Figure 41: South America Photopheresis Products Market Revenue Share (%), by Country 2025 & 2033
List of Tables
- Table 1: Global Photopheresis Products Market Revenue million Forecast, by Product Type 2020 & 2033
- Table 2: Global Photopheresis Products Market Revenue million Forecast, by Application 2020 & 2033
- Table 3: Global Photopheresis Products Market Revenue million Forecast, by End User 2020 & 2033
- Table 4: Global Photopheresis Products Market Revenue million Forecast, by Region 2020 & 2033
- Table 5: Global Photopheresis Products Market Revenue million Forecast, by Product Type 2020 & 2033
- Table 6: Global Photopheresis Products Market Revenue million Forecast, by Application 2020 & 2033
- Table 7: Global Photopheresis Products Market Revenue million Forecast, by End User 2020 & 2033
- Table 8: Global Photopheresis Products Market Revenue million Forecast, by Country 2020 & 2033
- Table 9: United States Photopheresis Products Market Revenue (million) Forecast, by Application 2020 & 2033
- Table 10: Canada Photopheresis Products Market Revenue (million) Forecast, by Application 2020 & 2033
- Table 11: Mexico Photopheresis Products Market Revenue (million) Forecast, by Application 2020 & 2033
- Table 12: Global Photopheresis Products Market Revenue million Forecast, by Product Type 2020 & 2033
- Table 13: Global Photopheresis Products Market Revenue million Forecast, by Application 2020 & 2033
- Table 14: Global Photopheresis Products Market Revenue million Forecast, by End User 2020 & 2033
- Table 15: Global Photopheresis Products Market Revenue million Forecast, by Country 2020 & 2033
- Table 16: Germany Photopheresis Products Market Revenue (million) Forecast, by Application 2020 & 2033
- Table 17: United Kingdom Photopheresis Products Market Revenue (million) Forecast, by Application 2020 & 2033
- Table 18: France Photopheresis Products Market Revenue (million) Forecast, by Application 2020 & 2033
- Table 19: Italy Photopheresis Products Market Revenue (million) Forecast, by Application 2020 & 2033
- Table 20: Spain Photopheresis Products Market Revenue (million) Forecast, by Application 2020 & 2033
- Table 21: Rest of Europe Photopheresis Products Market Revenue (million) Forecast, by Application 2020 & 2033
- Table 22: Global Photopheresis Products Market Revenue million Forecast, by Product Type 2020 & 2033
- Table 23: Global Photopheresis Products Market Revenue million Forecast, by Application 2020 & 2033
- Table 24: Global Photopheresis Products Market Revenue million Forecast, by End User 2020 & 2033
- Table 25: Global Photopheresis Products Market Revenue million Forecast, by Country 2020 & 2033
- Table 26: China Photopheresis Products Market Revenue (million) Forecast, by Application 2020 & 2033
- Table 27: Japan Photopheresis Products Market Revenue (million) Forecast, by Application 2020 & 2033
- Table 28: India Photopheresis Products Market Revenue (million) Forecast, by Application 2020 & 2033
- Table 29: Australia Photopheresis Products Market Revenue (million) Forecast, by Application 2020 & 2033
- Table 30: South Korea Photopheresis Products Market Revenue (million) Forecast, by Application 2020 & 2033
- Table 31: Rest of Asia Pacific Photopheresis Products Market Revenue (million) Forecast, by Application 2020 & 2033
- Table 32: Global Photopheresis Products Market Revenue million Forecast, by Product Type 2020 & 2033
- Table 33: Global Photopheresis Products Market Revenue million Forecast, by Application 2020 & 2033
- Table 34: Global Photopheresis Products Market Revenue million Forecast, by End User 2020 & 2033
- Table 35: Global Photopheresis Products Market Revenue million Forecast, by Country 2020 & 2033
- Table 36: GCC Photopheresis Products Market Revenue (million) Forecast, by Application 2020 & 2033
- Table 37: South Africa Photopheresis Products Market Revenue (million) Forecast, by Application 2020 & 2033
- Table 38: Rest of Middle East and Africa Photopheresis Products Market Revenue (million) Forecast, by Application 2020 & 2033
- Table 39: Global Photopheresis Products Market Revenue million Forecast, by Product Type 2020 & 2033
- Table 40: Global Photopheresis Products Market Revenue million Forecast, by Application 2020 & 2033
- Table 41: Global Photopheresis Products Market Revenue million Forecast, by End User 2020 & 2033
- Table 42: Global Photopheresis Products Market Revenue million Forecast, by Country 2020 & 2033
- Table 43: Brazil Photopheresis Products Market Revenue (million) Forecast, by Application 2020 & 2033
- Table 44: Argentina Photopheresis Products Market Revenue (million) Forecast, by Application 2020 & 2033
- Table 45: Rest of South America Photopheresis Products Market Revenue (million) Forecast, by Application 2020 & 2033
Frequently Asked Questions
1. What is the projected Compound Annual Growth Rate (CAGR) of the Photopheresis Products Market?
The projected CAGR is approximately 5.6%.
2. Which companies are prominent players in the Photopheresis Products Market?
Key companies in the market include Macopharma, Terumo Corporation*List Not Exhaustive, Fresenius Kabi AG, PIT Medical Systems, Haemonetics Corporation, Mallinckrodt Pharmaceuticals.
3. What are the main segments of the Photopheresis Products Market?
The market segments include Product Type, Application, End User.
4. Can you provide details about the market size?
The market size is estimated to be USD 342.86 million as of 2022.
5. What are some drivers contributing to market growth?
Rise in Prevalence of Autoimmune Diseases; Increasing Technological Advancements.
6. What are the notable trends driving market growth?
Chronic Graft Versus Host Disease (GvHD) is Expected to Hold a Significant Market Share in the Market Studied..
7. Are there any restraints impacting market growth?
Low Adoption of Photopheresis in Pediatric Patients and Lack of Skilled Professionals.
8. Can you provide examples of recent developments in the market?
In September 2022, UAE opened a new apheresis unit in the Sheikh Shakhbout Medical City (SSMC) as a collaboration between Abu Dhabi Health Services Company (SEHA) and Mayo Clinic. Sheikh Shakhbout Medical City widens the treatment scope for diseases, including rare lymphoma of the skin.
9. What pricing options are available for accessing the report?
Pricing options include single-user, multi-user, and enterprise licenses priced at USD 4750, USD 5250, and USD 8750 respectively.
10. Is the market size provided in terms of value or volume?
The market size is provided in terms of value, measured in million.
11. Are there any specific market keywords associated with the report?
Yes, the market keyword associated with the report is "Photopheresis Products Market," which aids in identifying and referencing the specific market segment covered.
12. How do I determine which pricing option suits my needs best?
The pricing options vary based on user requirements and access needs. Individual users may opt for single-user licenses, while businesses requiring broader access may choose multi-user or enterprise licenses for cost-effective access to the report.
13. Are there any additional resources or data provided in the Photopheresis Products Market report?
While the report offers comprehensive insights, it's advisable to review the specific contents or supplementary materials provided to ascertain if additional resources or data are available.
14. How can I stay updated on further developments or reports in the Photopheresis Products Market?
To stay informed about further developments, trends, and reports in the Photopheresis Products Market, consider subscribing to industry newsletters, following relevant companies and organizations, or regularly checking reputable industry news sources and publications.
Methodology
Step 1 - Identification of Relevant Samples Size from Population Database


Step 2 - Approaches for Defining Global Market Size (Value, Volume* & Price*)

Note*: In applicable scenarios
Step 3 - Data Sources
Primary Research
- Web Analytics
- Survey Reports
- Research Institute
- Latest Research Reports
- Opinion Leaders
Secondary Research
- Annual Reports
- White Paper
- Latest Press Release
- Industry Association
- Paid Database
- Investor Presentations

Step 4 - Data Triangulation
Involves using different sources of information in order to increase the validity of a study
These sources are likely to be stakeholders in a program - participants, other researchers, program staff, other community members, and so on.
Then we put all data in single framework & apply various statistical tools to find out the dynamic on the market.
During the analysis stage, feedback from the stakeholder groups would be compared to determine areas of agreement as well as areas of divergence