

Key Insights
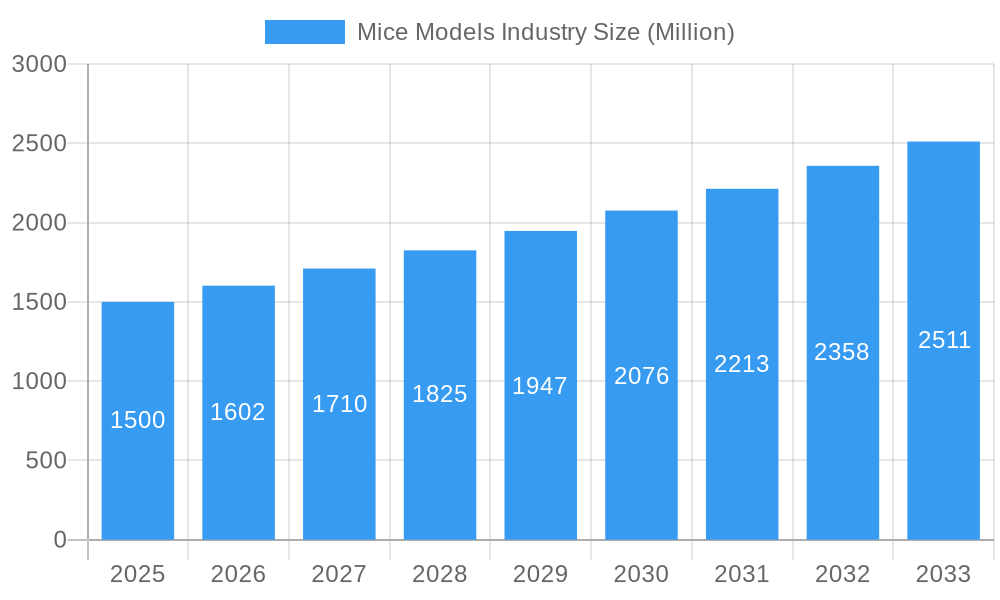
The global mice models market, valued at $1.5 billion in 2025, is projected to experience robust growth, driven by the increasing demand for preclinical research and drug discovery. A compound annual growth rate (CAGR) of 6.80% from 2025 to 2033 indicates a substantial expansion in market size, reaching an estimated $2.7 billion by 2033. This growth is fueled by several key factors. Advancements in genetic engineering technologies, such as CRISPR/Cas9, are enabling the creation of more sophisticated and accurate mice models for studying human diseases. The rising prevalence of chronic diseases like cancer and cardiovascular disorders necessitates extensive preclinical testing, further boosting demand. Furthermore, the increasing adoption of outsourced research services by pharmaceutical and biotechnology companies is contributing to market expansion. While regulatory hurdles and ethical considerations surrounding animal research remain, the overall market trajectory points towards continued and substantial growth.
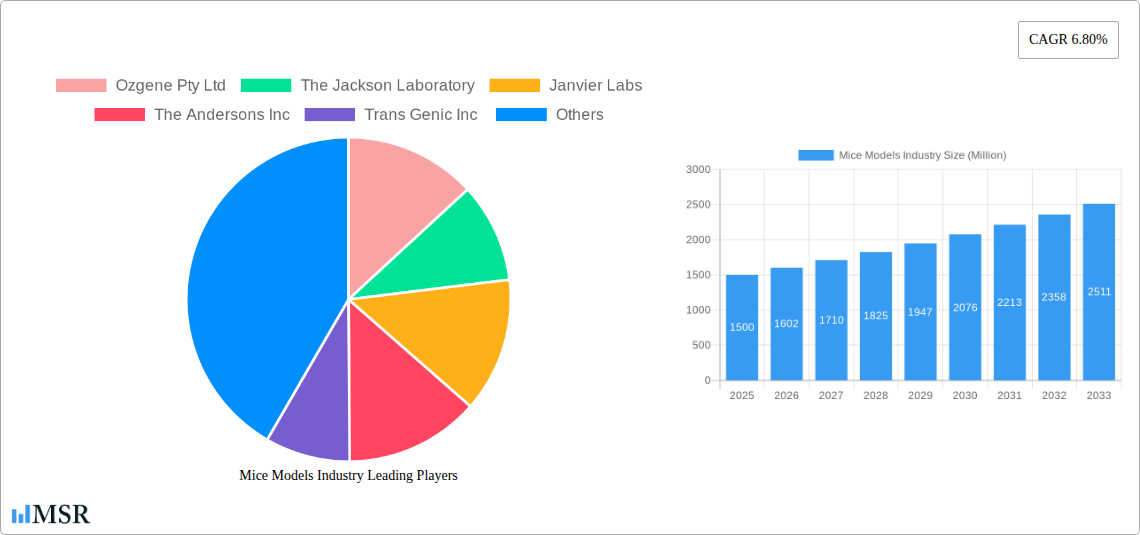
Mice Models Industry Market Size (In Billion)
The market segmentation reveals significant opportunities across various types of mice models, services, and technologies. Genetically engineered mice, offering precise disease modeling capabilities, command a significant share, followed by inbred and outbred mice. Within services, breeding and genetic testing are key revenue generators. Geographically, North America holds a substantial market share, driven by robust research infrastructure and high pharmaceutical industry activity. However, Asia Pacific is poised for significant growth owing to its expanding healthcare sector and increasing research investments. Competition is intense, with established players like Charles River Laboratories and Taconic Biosciences vying with emerging companies offering innovative technologies and services. The continued focus on technological advancements, strategic collaborations, and expansion into emerging markets will shape the competitive landscape and drive future growth within the mice models industry.
Mice Models Industry Company Market Share
Mice Models Industry: A Comprehensive Market Report (2019-2033)
This in-depth report provides a comprehensive analysis of the Mice Models industry, encompassing market size, growth drivers, key players, and future trends. Covering the period from 2019 to 2033, with a focus on 2025, this report is an essential resource for industry stakeholders, investors, and researchers seeking actionable insights into this dynamic market. The global Mice Models market is projected to reach xx Million by 2033.
Mice Models Industry Market Concentration & Dynamics
The Mice Models industry exhibits a moderately concentrated market structure, with several large players dominating the landscape. Market share is primarily driven by technological capabilities, service offerings, and established client networks. Key players such as Charles River Laboratories International Inc., Taconic Biosciences Inc., and Envigo hold significant market share, while numerous smaller companies focus on niche segments or specialized services. The industry is characterized by ongoing innovation, with companies investing heavily in research and development to develop new genetically engineered mouse models and advanced breeding techniques.
Market Dynamics:
- Innovation Ecosystems: Strong collaborations between research institutions, pharmaceutical companies, and model providers drive innovation. CRISPR/Cas9 gene editing technology is significantly impacting model development, enabling the creation of more precise and complex models.
- Regulatory Frameworks: Stringent regulatory approvals and ethical considerations surrounding animal research influence industry operations and costs. Compliance with guidelines from organizations like the NIH (National Institutes of Health) is crucial.
- Substitute Products: While no direct substitutes exist, alternative research methods like in vitro studies and computational modeling offer partial alternatives, but they do not fully replace the value of in vivo mouse models.
- End-User Trends: Increasing demand for advanced disease models (e.g., for oncology, neurology, and cardiovascular research) is driving market growth. Personalized medicine approaches also fuel the demand for customized mouse models.
- M&A Activities: The industry has witnessed a moderate number of mergers and acquisitions (M&A) in recent years (xx deals in the historical period), mainly focused on expanding service portfolios and geographical reach. Larger companies are strategically acquiring smaller specialized players to broaden their technological capabilities and enhance their market presence.
Mice Models Industry Industry Insights & Trends
The Mice Models industry is experiencing robust growth, driven by several factors. The global market size reached xx Million in 2025, and is projected to achieve a Compound Annual Growth Rate (CAGR) of xx% from 2025 to 2033. This growth is fueled by increased investment in biomedical research, the rising prevalence of chronic diseases, and the growing demand for preclinical drug discovery and development services. Technological advancements, particularly in CRISPR/Cas9 technology and advanced imaging techniques, are further driving market expansion. The market is witnessing an increasing adoption of genetically engineered mice, owing to their precision in modeling human diseases. Consumer behavior is shifting towards more customized models, necessitating tailored services and technologies from model providers.
Key Markets & Segments Leading Mice Models Industry
The North American region currently dominates the Mice Models market, owing to substantial investment in biomedical research and the presence of major players. However, the Asia-Pacific region is witnessing rapid growth, driven by expanding healthcare infrastructure and growing research activities.
Dominant Segments:
- Type: Genetically Engineered Mice is the fastest-growing segment, driven by the increased accuracy in modeling human diseases.
- Service: Breeding and Genetic Testing services are the dominant segments, reflecting the fundamental requirements of the industry.
- Technology: CRISPR/CAS technology is rapidly gaining traction owing to its superior precision and efficiency in creating disease models.
- Application: Oncology remains the leading application area, reflecting the significant focus on cancer research.
Drivers:
- Robust government funding for biomedical research.
- Expansion of pharmaceutical and biotechnology industries.
- Increasing prevalence of chronic diseases.
- Growing adoption of preclinical testing in drug discovery.
Mice Models Industry Product Developments
Recent innovations include advanced genetically engineered mouse models with enhanced disease phenotypes, incorporating humanized immune systems and advanced genetic modifications. Companies are focusing on developing models that better mimic the complexity of human diseases, using technologies like CRISPR/Cas9 and other gene-editing tools to enhance accuracy and efficiency. These innovations translate to improved efficacy of drug testing and more reliable results.
Challenges in the Mice Models Industry Market
The Mice Models industry faces several challenges, including:
- High research and development costs: Developing novel mouse models is expensive and time-consuming, posing a barrier to entry for smaller players.
- Stringent regulations: Ethical concerns and regulatory hurdles associated with animal research can lead to delays in the development and commercialization of new models.
- Competition: The increasing presence of both large and small players results in significant competitive pressure in the industry.
Forces Driving Mice Models Industry Growth
Technological advancements, particularly CRISPR/Cas9, are key drivers. Growing demand for preclinical models from pharmaceutical and biotechnology companies is a primary growth catalyst. Furthermore, government funding for research and increasing incidence of chronic diseases significantly boost market growth. For example, the development of the Trem2R47H NSS mouse model (November 2023) for Alzheimer's research illustrates the importance of novel model creation.
Long-Term Growth Catalysts in the Mice Models Industry
Long-term growth will be driven by continued innovation in gene editing technologies and the development of more sophisticated models that capture disease complexity. Strategic partnerships between research institutions and industry players will play a crucial role in accelerating the development and adoption of advanced models.
Emerging Opportunities in Mice Models Industry
Emerging opportunities include the development of humanized mouse models that better reflect human physiology, the use of AI and machine learning for model selection and data analysis, and the expansion into new disease areas such as neurodegenerative disorders and rare diseases. The integration of multi-omics data with mouse models promises greater precision and efficacy.
Leading Players in the Mice Models Industry Sector
- Ozgene Pty Ltd
- The Jackson Laboratory
- Janvier Labs
- The Andersons Inc
- Trans Genic Inc
- Ingenious Targeting Laboratory
- ENVIGO
- Charles River Laboratories International Inc
- Taconic Biosciences Inc
- Genoway
- Horizon Discovery Group PLC (Sage Labs Inc)
- Allentown LLC
- Harbour Biomed
- PolyGene
Key Milestones in Mice Models Industry Industry
- February 2024: University of Texas Southwestern Medical Center introduces a new compound significantly extending survival in an ALS mouse model.
- November 2023: UCI MODEL-AD group develops the Trem2R47H NSS mouse model for Alzheimer's disease research.
Strategic Outlook for Mice Models Industry Market
The Mice Models industry is poised for continued growth, driven by ongoing advancements in genetic engineering and increasing demand for preclinical models. Strategic collaborations and investments in advanced technologies will be crucial for players to maintain a competitive edge. Expansion into new therapeutic areas and the development of more human-relevant models present significant opportunities for growth.
Mice Models Industry Segmentation
-
1. Type
- 1.1. Inbred Mice
- 1.2. Outbred Mice
- 1.3. Genetically Engineered Mice
- 1.4. Hybrid/Congenic Mice
- 1.5. Other Types
-
2. Service
- 2.1. Breeding
- 2.2. Cryopreservation
- 2.3. Model in-Licensing
- 2.4. Genetic Testing
- 2.5. Other Services
-
3. Technology
- 3.1. CRISPR/CAS9
- 3.2. Embryonic Stem Cell Injection
- 3.3. Nuclear Transfer
- 3.4. Other Technologies
-
4. Application
- 4.1. Oncology
- 4.2. Cardiovascular Studies
- 4.3. Neurology
- 4.4. Other Applications
Mice Models Industry Segmentation By Geography
-
1. North America
- 1.1. United States
- 1.2. Canada
- 1.3. Mexico
-
2. Europe
- 2.1. Germany
- 2.2. United Kingdom
- 2.3. France
- 2.4. Italy
- 2.5. Spain
- 2.6. Rest of Europe
-
3. Asia Pacific
- 3.1. China
- 3.2. Japan
- 3.3. India
- 3.4. Australia
- 3.5. South Korea
- 3.6. Rest of Asia Pacific
-
4. Middle East and Africa
- 4.1. GCC
- 4.2. South Africa
- 4.3. Rest of Middle East and Africa
-
5. South America
- 5.1. Brazil
- 5.2. Argentina
- 5.3. Rest of South America
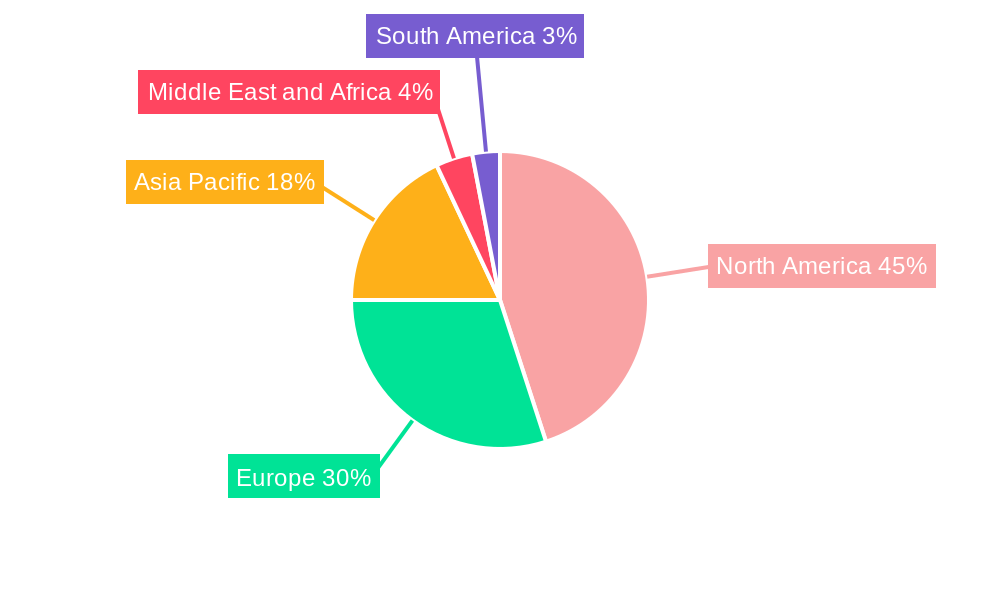
Mice Models Industry Regional Market Share
Geographic Coverage of Mice Models Industry
Mice Models Industry REPORT HIGHLIGHTS
| Aspects | Details |
|---|---|
| Study Period | 2020-2034 |
| Base Year | 2025 |
| Estimated Year | 2026 |
| Forecast Period | 2026-2034 |
| Historical Period | 2020-2025 |
| Growth Rate | CAGR of 6.80% from 2020-2034 |
| Segmentation |
|
Table of Contents
- 1. Introduction
- 1.1. Research Scope
- 1.2. Market Segmentation
- 1.3. Research Objective
- 1.4. Definitions and Assumptions
- 2. Executive Summary
- 2.1. Market Snapshot
- 3. Market Dynamics
- 3.1. Market Drivers
- 3.2. Market Restrains
- 3.3. Market Trends
- 3.4. Market Opportunities
- 4. Market Factor Analysis
- 4.1. Porters Five Forces
- 4.1.1. Bargaining Power of Suppliers
- 4.1.2. Bargaining Power of Buyers
- 4.1.3. Threat of New Entrants
- 4.1.4. Threat of Substitutes
- 4.1.5. Competitive Rivalry
- 4.2. PESTEL analysis
- 4.3. BCG Analysis
- 4.3.1. Stars (High Growth, High Market Share)
- 4.3.2. Cash Cows (Low Growth, High Market Share)
- 4.3.3. Question Mark (High Growth, Low Market Share)
- 4.3.4. Dogs (Low Growth, Low Market Share)
- 4.4. Ansoff Matrix Analysis
- 4.5. Supply Chain Analysis
- 4.6. Regulatory Landscape
- 4.7. Current Market Potential and Opportunity Assessment (TAM–SAM–SOM Framework)
- 4.8. MSR Analyst Note
- 4.1. Porters Five Forces
- 5. Market Analysis, Insights and Forecast 2021-2033
- 5.1. Market Analysis, Insights and Forecast - by Type
- 5.1.1. Inbred Mice
- 5.1.2. Outbred Mice
- 5.1.3. Genetically Engineered Mice
- 5.1.4. Hybrid/Congenic Mice
- 5.1.5. Other Types
- 5.2. Market Analysis, Insights and Forecast - by Service
- 5.2.1. Breeding
- 5.2.2. Cryopreservation
- 5.2.3. Model in-Licensing
- 5.2.4. Genetic Testing
- 5.2.5. Other Services
- 5.3. Market Analysis, Insights and Forecast - by Technology
- 5.3.1. CRISPR/CAS9
- 5.3.2. Embryonic Stem Cell Injection
- 5.3.3. Nuclear Transfer
- 5.3.4. Other Technologies
- 5.4. Market Analysis, Insights and Forecast - by Application
- 5.4.1. Oncology
- 5.4.2. Cardiovascular Studies
- 5.4.3. Neurology
- 5.4.4. Other Applications
- 5.5. Market Analysis, Insights and Forecast - by Region
- 5.5.1. North America
- 5.5.2. Europe
- 5.5.3. Asia Pacific
- 5.5.4. Middle East and Africa
- 5.5.5. South America
- 5.1. Market Analysis, Insights and Forecast - by Type
- 6. Global Mice Models Industry Analysis, Insights and Forecast, 2021-2033
- 6.1. Market Analysis, Insights and Forecast - by Type
- 6.1.1. Inbred Mice
- 6.1.2. Outbred Mice
- 6.1.3. Genetically Engineered Mice
- 6.1.4. Hybrid/Congenic Mice
- 6.1.5. Other Types
- 6.2. Market Analysis, Insights and Forecast - by Service
- 6.2.1. Breeding
- 6.2.2. Cryopreservation
- 6.2.3. Model in-Licensing
- 6.2.4. Genetic Testing
- 6.2.5. Other Services
- 6.3. Market Analysis, Insights and Forecast - by Technology
- 6.3.1. CRISPR/CAS9
- 6.3.2. Embryonic Stem Cell Injection
- 6.3.3. Nuclear Transfer
- 6.3.4. Other Technologies
- 6.4. Market Analysis, Insights and Forecast - by Application
- 6.4.1. Oncology
- 6.4.2. Cardiovascular Studies
- 6.4.3. Neurology
- 6.4.4. Other Applications
- 6.1. Market Analysis, Insights and Forecast - by Type
- 7. North America Mice Models Industry Analysis, Insights and Forecast, 2020-2032
- 7.1. Market Analysis, Insights and Forecast - by Type
- 7.1.1. Inbred Mice
- 7.1.2. Outbred Mice
- 7.1.3. Genetically Engineered Mice
- 7.1.4. Hybrid/Congenic Mice
- 7.1.5. Other Types
- 7.2. Market Analysis, Insights and Forecast - by Service
- 7.2.1. Breeding
- 7.2.2. Cryopreservation
- 7.2.3. Model in-Licensing
- 7.2.4. Genetic Testing
- 7.2.5. Other Services
- 7.3. Market Analysis, Insights and Forecast - by Technology
- 7.3.1. CRISPR/CAS9
- 7.3.2. Embryonic Stem Cell Injection
- 7.3.3. Nuclear Transfer
- 7.3.4. Other Technologies
- 7.4. Market Analysis, Insights and Forecast - by Application
- 7.4.1. Oncology
- 7.4.2. Cardiovascular Studies
- 7.4.3. Neurology
- 7.4.4. Other Applications
- 7.1. Market Analysis, Insights and Forecast - by Type
- 8. Europe Mice Models Industry Analysis, Insights and Forecast, 2020-2032
- 8.1. Market Analysis, Insights and Forecast - by Type
- 8.1.1. Inbred Mice
- 8.1.2. Outbred Mice
- 8.1.3. Genetically Engineered Mice
- 8.1.4. Hybrid/Congenic Mice
- 8.1.5. Other Types
- 8.2. Market Analysis, Insights and Forecast - by Service
- 8.2.1. Breeding
- 8.2.2. Cryopreservation
- 8.2.3. Model in-Licensing
- 8.2.4. Genetic Testing
- 8.2.5. Other Services
- 8.3. Market Analysis, Insights and Forecast - by Technology
- 8.3.1. CRISPR/CAS9
- 8.3.2. Embryonic Stem Cell Injection
- 8.3.3. Nuclear Transfer
- 8.3.4. Other Technologies
- 8.4. Market Analysis, Insights and Forecast - by Application
- 8.4.1. Oncology
- 8.4.2. Cardiovascular Studies
- 8.4.3. Neurology
- 8.4.4. Other Applications
- 8.1. Market Analysis, Insights and Forecast - by Type
- 9. Asia Pacific Mice Models Industry Analysis, Insights and Forecast, 2020-2032
- 9.1. Market Analysis, Insights and Forecast - by Type
- 9.1.1. Inbred Mice
- 9.1.2. Outbred Mice
- 9.1.3. Genetically Engineered Mice
- 9.1.4. Hybrid/Congenic Mice
- 9.1.5. Other Types
- 9.2. Market Analysis, Insights and Forecast - by Service
- 9.2.1. Breeding
- 9.2.2. Cryopreservation
- 9.2.3. Model in-Licensing
- 9.2.4. Genetic Testing
- 9.2.5. Other Services
- 9.3. Market Analysis, Insights and Forecast - by Technology
- 9.3.1. CRISPR/CAS9
- 9.3.2. Embryonic Stem Cell Injection
- 9.3.3. Nuclear Transfer
- 9.3.4. Other Technologies
- 9.4. Market Analysis, Insights and Forecast - by Application
- 9.4.1. Oncology
- 9.4.2. Cardiovascular Studies
- 9.4.3. Neurology
- 9.4.4. Other Applications
- 9.1. Market Analysis, Insights and Forecast - by Type
- 10. Middle East and Africa Mice Models Industry Analysis, Insights and Forecast, 2020-2032
- 10.1. Market Analysis, Insights and Forecast - by Type
- 10.1.1. Inbred Mice
- 10.1.2. Outbred Mice
- 10.1.3. Genetically Engineered Mice
- 10.1.4. Hybrid/Congenic Mice
- 10.1.5. Other Types
- 10.2. Market Analysis, Insights and Forecast - by Service
- 10.2.1. Breeding
- 10.2.2. Cryopreservation
- 10.2.3. Model in-Licensing
- 10.2.4. Genetic Testing
- 10.2.5. Other Services
- 10.3. Market Analysis, Insights and Forecast - by Technology
- 10.3.1. CRISPR/CAS9
- 10.3.2. Embryonic Stem Cell Injection
- 10.3.3. Nuclear Transfer
- 10.3.4. Other Technologies
- 10.4. Market Analysis, Insights and Forecast - by Application
- 10.4.1. Oncology
- 10.4.2. Cardiovascular Studies
- 10.4.3. Neurology
- 10.4.4. Other Applications
- 10.1. Market Analysis, Insights and Forecast - by Type
- 11. South America Mice Models Industry Analysis, Insights and Forecast, 2020-2032
- 11.1. Market Analysis, Insights and Forecast - by Type
- 11.1.1. Inbred Mice
- 11.1.2. Outbred Mice
- 11.1.3. Genetically Engineered Mice
- 11.1.4. Hybrid/Congenic Mice
- 11.1.5. Other Types
- 11.2. Market Analysis, Insights and Forecast - by Service
- 11.2.1. Breeding
- 11.2.2. Cryopreservation
- 11.2.3. Model in-Licensing
- 11.2.4. Genetic Testing
- 11.2.5. Other Services
- 11.3. Market Analysis, Insights and Forecast - by Technology
- 11.3.1. CRISPR/CAS9
- 11.3.2. Embryonic Stem Cell Injection
- 11.3.3. Nuclear Transfer
- 11.3.4. Other Technologies
- 11.4. Market Analysis, Insights and Forecast - by Application
- 11.4.1. Oncology
- 11.4.2. Cardiovascular Studies
- 11.4.3. Neurology
- 11.4.4. Other Applications
- 11.1. Market Analysis, Insights and Forecast - by Type
- 12. Competitive Analysis
- 12.1. Company Profiles
- 12.1.1 Ozgene Pty Ltd
- 12.1.1.1. Company Overview
- 12.1.1.2. Products
- 12.1.1.3. Company Financials
- 12.1.1.4. SWOT Analysis
- 12.1.2 The Jackson Laboratory
- 12.1.2.1. Company Overview
- 12.1.2.2. Products
- 12.1.2.3. Company Financials
- 12.1.2.4. SWOT Analysis
- 12.1.3 Janvier Labs
- 12.1.3.1. Company Overview
- 12.1.3.2. Products
- 12.1.3.3. Company Financials
- 12.1.3.4. SWOT Analysis
- 12.1.4 The Andersons Inc
- 12.1.4.1. Company Overview
- 12.1.4.2. Products
- 12.1.4.3. Company Financials
- 12.1.4.4. SWOT Analysis
- 12.1.5 Trans Genic Inc
- 12.1.5.1. Company Overview
- 12.1.5.2. Products
- 12.1.5.3. Company Financials
- 12.1.5.4. SWOT Analysis
- 12.1.6 Ingenious Targeting Laboratory
- 12.1.6.1. Company Overview
- 12.1.6.2. Products
- 12.1.6.3. Company Financials
- 12.1.6.4. SWOT Analysis
- 12.1.7 ENVIGO
- 12.1.7.1. Company Overview
- 12.1.7.2. Products
- 12.1.7.3. Company Financials
- 12.1.7.4. SWOT Analysis
- 12.1.8 Charles River Laboratories International Inc
- 12.1.8.1. Company Overview
- 12.1.8.2. Products
- 12.1.8.3. Company Financials
- 12.1.8.4. SWOT Analysis
- 12.1.9 Taconic Biosciences Inc
- 12.1.9.1. Company Overview
- 12.1.9.2. Products
- 12.1.9.3. Company Financials
- 12.1.9.4. SWOT Analysis
- 12.1.10 Genoway
- 12.1.10.1. Company Overview
- 12.1.10.2. Products
- 12.1.10.3. Company Financials
- 12.1.10.4. SWOT Analysis
- 12.1.11 Horizon Discovery Group PLC (Sage Labs Inc )
- 12.1.11.1. Company Overview
- 12.1.11.2. Products
- 12.1.11.3. Company Financials
- 12.1.11.4. SWOT Analysis
- 12.1.12 Allentown LLC
- 12.1.12.1. Company Overview
- 12.1.12.2. Products
- 12.1.12.3. Company Financials
- 12.1.12.4. SWOT Analysis
- 12.1.13 Harbour Biomed
- 12.1.13.1. Company Overview
- 12.1.13.2. Products
- 12.1.13.3. Company Financials
- 12.1.13.4. SWOT Analysis
- 12.1.14 PolyGene
- 12.1.14.1. Company Overview
- 12.1.14.2. Products
- 12.1.14.3. Company Financials
- 12.1.14.4. SWOT Analysis
- 12.1.1 Ozgene Pty Ltd
- 12.2. Market Entropy
- 12.2.1 Company's Key Areas Served
- 12.2.2 Recent Developments
- 12.3. Company Market Share Analysis 2025
- 12.3.1 Top 5 Companies Market Share Analysis
- 12.3.2 Top 3 Companies Market Share Analysis
- 12.4. List of Potential Customers
- 13. Research Methodology
List of Figures
- Figure 1: Global Mice Models Industry Revenue Breakdown (Million, %) by Region 2025 & 2033
- Figure 2: Global Mice Models Industry Volume Breakdown (K Unit, %) by Region 2025 & 2033
- Figure 3: North America Mice Models Industry Revenue (Million), by Type 2025 & 2033
- Figure 4: North America Mice Models Industry Volume (K Unit), by Type 2025 & 2033
- Figure 5: North America Mice Models Industry Revenue Share (%), by Type 2025 & 2033
- Figure 6: North America Mice Models Industry Volume Share (%), by Type 2025 & 2033
- Figure 7: North America Mice Models Industry Revenue (Million), by Service 2025 & 2033
- Figure 8: North America Mice Models Industry Volume (K Unit), by Service 2025 & 2033
- Figure 9: North America Mice Models Industry Revenue Share (%), by Service 2025 & 2033
- Figure 10: North America Mice Models Industry Volume Share (%), by Service 2025 & 2033
- Figure 11: North America Mice Models Industry Revenue (Million), by Technology 2025 & 2033
- Figure 12: North America Mice Models Industry Volume (K Unit), by Technology 2025 & 2033
- Figure 13: North America Mice Models Industry Revenue Share (%), by Technology 2025 & 2033
- Figure 14: North America Mice Models Industry Volume Share (%), by Technology 2025 & 2033
- Figure 15: North America Mice Models Industry Revenue (Million), by Application 2025 & 2033
- Figure 16: North America Mice Models Industry Volume (K Unit), by Application 2025 & 2033
- Figure 17: North America Mice Models Industry Revenue Share (%), by Application 2025 & 2033
- Figure 18: North America Mice Models Industry Volume Share (%), by Application 2025 & 2033
- Figure 19: North America Mice Models Industry Revenue (Million), by Country 2025 & 2033
- Figure 20: North America Mice Models Industry Volume (K Unit), by Country 2025 & 2033
- Figure 21: North America Mice Models Industry Revenue Share (%), by Country 2025 & 2033
- Figure 22: North America Mice Models Industry Volume Share (%), by Country 2025 & 2033
- Figure 23: Europe Mice Models Industry Revenue (Million), by Type 2025 & 2033
- Figure 24: Europe Mice Models Industry Volume (K Unit), by Type 2025 & 2033
- Figure 25: Europe Mice Models Industry Revenue Share (%), by Type 2025 & 2033
- Figure 26: Europe Mice Models Industry Volume Share (%), by Type 2025 & 2033
- Figure 27: Europe Mice Models Industry Revenue (Million), by Service 2025 & 2033
- Figure 28: Europe Mice Models Industry Volume (K Unit), by Service 2025 & 2033
- Figure 29: Europe Mice Models Industry Revenue Share (%), by Service 2025 & 2033
- Figure 30: Europe Mice Models Industry Volume Share (%), by Service 2025 & 2033
- Figure 31: Europe Mice Models Industry Revenue (Million), by Technology 2025 & 2033
- Figure 32: Europe Mice Models Industry Volume (K Unit), by Technology 2025 & 2033
- Figure 33: Europe Mice Models Industry Revenue Share (%), by Technology 2025 & 2033
- Figure 34: Europe Mice Models Industry Volume Share (%), by Technology 2025 & 2033
- Figure 35: Europe Mice Models Industry Revenue (Million), by Application 2025 & 2033
- Figure 36: Europe Mice Models Industry Volume (K Unit), by Application 2025 & 2033
- Figure 37: Europe Mice Models Industry Revenue Share (%), by Application 2025 & 2033
- Figure 38: Europe Mice Models Industry Volume Share (%), by Application 2025 & 2033
- Figure 39: Europe Mice Models Industry Revenue (Million), by Country 2025 & 2033
- Figure 40: Europe Mice Models Industry Volume (K Unit), by Country 2025 & 2033
- Figure 41: Europe Mice Models Industry Revenue Share (%), by Country 2025 & 2033
- Figure 42: Europe Mice Models Industry Volume Share (%), by Country 2025 & 2033
- Figure 43: Asia Pacific Mice Models Industry Revenue (Million), by Type 2025 & 2033
- Figure 44: Asia Pacific Mice Models Industry Volume (K Unit), by Type 2025 & 2033
- Figure 45: Asia Pacific Mice Models Industry Revenue Share (%), by Type 2025 & 2033
- Figure 46: Asia Pacific Mice Models Industry Volume Share (%), by Type 2025 & 2033
- Figure 47: Asia Pacific Mice Models Industry Revenue (Million), by Service 2025 & 2033
- Figure 48: Asia Pacific Mice Models Industry Volume (K Unit), by Service 2025 & 2033
- Figure 49: Asia Pacific Mice Models Industry Revenue Share (%), by Service 2025 & 2033
- Figure 50: Asia Pacific Mice Models Industry Volume Share (%), by Service 2025 & 2033
- Figure 51: Asia Pacific Mice Models Industry Revenue (Million), by Technology 2025 & 2033
- Figure 52: Asia Pacific Mice Models Industry Volume (K Unit), by Technology 2025 & 2033
- Figure 53: Asia Pacific Mice Models Industry Revenue Share (%), by Technology 2025 & 2033
- Figure 54: Asia Pacific Mice Models Industry Volume Share (%), by Technology 2025 & 2033
- Figure 55: Asia Pacific Mice Models Industry Revenue (Million), by Application 2025 & 2033
- Figure 56: Asia Pacific Mice Models Industry Volume (K Unit), by Application 2025 & 2033
- Figure 57: Asia Pacific Mice Models Industry Revenue Share (%), by Application 2025 & 2033
- Figure 58: Asia Pacific Mice Models Industry Volume Share (%), by Application 2025 & 2033
- Figure 59: Asia Pacific Mice Models Industry Revenue (Million), by Country 2025 & 2033
- Figure 60: Asia Pacific Mice Models Industry Volume (K Unit), by Country 2025 & 2033
- Figure 61: Asia Pacific Mice Models Industry Revenue Share (%), by Country 2025 & 2033
- Figure 62: Asia Pacific Mice Models Industry Volume Share (%), by Country 2025 & 2033
- Figure 63: Middle East and Africa Mice Models Industry Revenue (Million), by Type 2025 & 2033
- Figure 64: Middle East and Africa Mice Models Industry Volume (K Unit), by Type 2025 & 2033
- Figure 65: Middle East and Africa Mice Models Industry Revenue Share (%), by Type 2025 & 2033
- Figure 66: Middle East and Africa Mice Models Industry Volume Share (%), by Type 2025 & 2033
- Figure 67: Middle East and Africa Mice Models Industry Revenue (Million), by Service 2025 & 2033
- Figure 68: Middle East and Africa Mice Models Industry Volume (K Unit), by Service 2025 & 2033
- Figure 69: Middle East and Africa Mice Models Industry Revenue Share (%), by Service 2025 & 2033
- Figure 70: Middle East and Africa Mice Models Industry Volume Share (%), by Service 2025 & 2033
- Figure 71: Middle East and Africa Mice Models Industry Revenue (Million), by Technology 2025 & 2033
- Figure 72: Middle East and Africa Mice Models Industry Volume (K Unit), by Technology 2025 & 2033
- Figure 73: Middle East and Africa Mice Models Industry Revenue Share (%), by Technology 2025 & 2033
- Figure 74: Middle East and Africa Mice Models Industry Volume Share (%), by Technology 2025 & 2033
- Figure 75: Middle East and Africa Mice Models Industry Revenue (Million), by Application 2025 & 2033
- Figure 76: Middle East and Africa Mice Models Industry Volume (K Unit), by Application 2025 & 2033
- Figure 77: Middle East and Africa Mice Models Industry Revenue Share (%), by Application 2025 & 2033
- Figure 78: Middle East and Africa Mice Models Industry Volume Share (%), by Application 2025 & 2033
- Figure 79: Middle East and Africa Mice Models Industry Revenue (Million), by Country 2025 & 2033
- Figure 80: Middle East and Africa Mice Models Industry Volume (K Unit), by Country 2025 & 2033
- Figure 81: Middle East and Africa Mice Models Industry Revenue Share (%), by Country 2025 & 2033
- Figure 82: Middle East and Africa Mice Models Industry Volume Share (%), by Country 2025 & 2033
- Figure 83: South America Mice Models Industry Revenue (Million), by Type 2025 & 2033
- Figure 84: South America Mice Models Industry Volume (K Unit), by Type 2025 & 2033
- Figure 85: South America Mice Models Industry Revenue Share (%), by Type 2025 & 2033
- Figure 86: South America Mice Models Industry Volume Share (%), by Type 2025 & 2033
- Figure 87: South America Mice Models Industry Revenue (Million), by Service 2025 & 2033
- Figure 88: South America Mice Models Industry Volume (K Unit), by Service 2025 & 2033
- Figure 89: South America Mice Models Industry Revenue Share (%), by Service 2025 & 2033
- Figure 90: South America Mice Models Industry Volume Share (%), by Service 2025 & 2033
- Figure 91: South America Mice Models Industry Revenue (Million), by Technology 2025 & 2033
- Figure 92: South America Mice Models Industry Volume (K Unit), by Technology 2025 & 2033
- Figure 93: South America Mice Models Industry Revenue Share (%), by Technology 2025 & 2033
- Figure 94: South America Mice Models Industry Volume Share (%), by Technology 2025 & 2033
- Figure 95: South America Mice Models Industry Revenue (Million), by Application 2025 & 2033
- Figure 96: South America Mice Models Industry Volume (K Unit), by Application 2025 & 2033
- Figure 97: South America Mice Models Industry Revenue Share (%), by Application 2025 & 2033
- Figure 98: South America Mice Models Industry Volume Share (%), by Application 2025 & 2033
- Figure 99: South America Mice Models Industry Revenue (Million), by Country 2025 & 2033
- Figure 100: South America Mice Models Industry Volume (K Unit), by Country 2025 & 2033
- Figure 101: South America Mice Models Industry Revenue Share (%), by Country 2025 & 2033
- Figure 102: South America Mice Models Industry Volume Share (%), by Country 2025 & 2033
List of Tables
- Table 1: Global Mice Models Industry Revenue Million Forecast, by Type 2020 & 2033
- Table 2: Global Mice Models Industry Volume K Unit Forecast, by Type 2020 & 2033
- Table 3: Global Mice Models Industry Revenue Million Forecast, by Service 2020 & 2033
- Table 4: Global Mice Models Industry Volume K Unit Forecast, by Service 2020 & 2033
- Table 5: Global Mice Models Industry Revenue Million Forecast, by Technology 2020 & 2033
- Table 6: Global Mice Models Industry Volume K Unit Forecast, by Technology 2020 & 2033
- Table 7: Global Mice Models Industry Revenue Million Forecast, by Application 2020 & 2033
- Table 8: Global Mice Models Industry Volume K Unit Forecast, by Application 2020 & 2033
- Table 9: Global Mice Models Industry Revenue Million Forecast, by Region 2020 & 2033
- Table 10: Global Mice Models Industry Volume K Unit Forecast, by Region 2020 & 2033
- Table 11: Global Mice Models Industry Revenue Million Forecast, by Type 2020 & 2033
- Table 12: Global Mice Models Industry Volume K Unit Forecast, by Type 2020 & 2033
- Table 13: Global Mice Models Industry Revenue Million Forecast, by Service 2020 & 2033
- Table 14: Global Mice Models Industry Volume K Unit Forecast, by Service 2020 & 2033
- Table 15: Global Mice Models Industry Revenue Million Forecast, by Technology 2020 & 2033
- Table 16: Global Mice Models Industry Volume K Unit Forecast, by Technology 2020 & 2033
- Table 17: Global Mice Models Industry Revenue Million Forecast, by Application 2020 & 2033
- Table 18: Global Mice Models Industry Volume K Unit Forecast, by Application 2020 & 2033
- Table 19: Global Mice Models Industry Revenue Million Forecast, by Country 2020 & 2033
- Table 20: Global Mice Models Industry Volume K Unit Forecast, by Country 2020 & 2033
- Table 21: United States Mice Models Industry Revenue (Million) Forecast, by Application 2020 & 2033
- Table 22: United States Mice Models Industry Volume (K Unit) Forecast, by Application 2020 & 2033
- Table 23: Canada Mice Models Industry Revenue (Million) Forecast, by Application 2020 & 2033
- Table 24: Canada Mice Models Industry Volume (K Unit) Forecast, by Application 2020 & 2033
- Table 25: Mexico Mice Models Industry Revenue (Million) Forecast, by Application 2020 & 2033
- Table 26: Mexico Mice Models Industry Volume (K Unit) Forecast, by Application 2020 & 2033
- Table 27: Global Mice Models Industry Revenue Million Forecast, by Type 2020 & 2033
- Table 28: Global Mice Models Industry Volume K Unit Forecast, by Type 2020 & 2033
- Table 29: Global Mice Models Industry Revenue Million Forecast, by Service 2020 & 2033
- Table 30: Global Mice Models Industry Volume K Unit Forecast, by Service 2020 & 2033
- Table 31: Global Mice Models Industry Revenue Million Forecast, by Technology 2020 & 2033
- Table 32: Global Mice Models Industry Volume K Unit Forecast, by Technology 2020 & 2033
- Table 33: Global Mice Models Industry Revenue Million Forecast, by Application 2020 & 2033
- Table 34: Global Mice Models Industry Volume K Unit Forecast, by Application 2020 & 2033
- Table 35: Global Mice Models Industry Revenue Million Forecast, by Country 2020 & 2033
- Table 36: Global Mice Models Industry Volume K Unit Forecast, by Country 2020 & 2033
- Table 37: Germany Mice Models Industry Revenue (Million) Forecast, by Application 2020 & 2033
- Table 38: Germany Mice Models Industry Volume (K Unit) Forecast, by Application 2020 & 2033
- Table 39: United Kingdom Mice Models Industry Revenue (Million) Forecast, by Application 2020 & 2033
- Table 40: United Kingdom Mice Models Industry Volume (K Unit) Forecast, by Application 2020 & 2033
- Table 41: France Mice Models Industry Revenue (Million) Forecast, by Application 2020 & 2033
- Table 42: France Mice Models Industry Volume (K Unit) Forecast, by Application 2020 & 2033
- Table 43: Italy Mice Models Industry Revenue (Million) Forecast, by Application 2020 & 2033
- Table 44: Italy Mice Models Industry Volume (K Unit) Forecast, by Application 2020 & 2033
- Table 45: Spain Mice Models Industry Revenue (Million) Forecast, by Application 2020 & 2033
- Table 46: Spain Mice Models Industry Volume (K Unit) Forecast, by Application 2020 & 2033
- Table 47: Rest of Europe Mice Models Industry Revenue (Million) Forecast, by Application 2020 & 2033
- Table 48: Rest of Europe Mice Models Industry Volume (K Unit) Forecast, by Application 2020 & 2033
- Table 49: Global Mice Models Industry Revenue Million Forecast, by Type 2020 & 2033
- Table 50: Global Mice Models Industry Volume K Unit Forecast, by Type 2020 & 2033
- Table 51: Global Mice Models Industry Revenue Million Forecast, by Service 2020 & 2033
- Table 52: Global Mice Models Industry Volume K Unit Forecast, by Service 2020 & 2033
- Table 53: Global Mice Models Industry Revenue Million Forecast, by Technology 2020 & 2033
- Table 54: Global Mice Models Industry Volume K Unit Forecast, by Technology 2020 & 2033
- Table 55: Global Mice Models Industry Revenue Million Forecast, by Application 2020 & 2033
- Table 56: Global Mice Models Industry Volume K Unit Forecast, by Application 2020 & 2033
- Table 57: Global Mice Models Industry Revenue Million Forecast, by Country 2020 & 2033
- Table 58: Global Mice Models Industry Volume K Unit Forecast, by Country 2020 & 2033
- Table 59: China Mice Models Industry Revenue (Million) Forecast, by Application 2020 & 2033
- Table 60: China Mice Models Industry Volume (K Unit) Forecast, by Application 2020 & 2033
- Table 61: Japan Mice Models Industry Revenue (Million) Forecast, by Application 2020 & 2033
- Table 62: Japan Mice Models Industry Volume (K Unit) Forecast, by Application 2020 & 2033
- Table 63: India Mice Models Industry Revenue (Million) Forecast, by Application 2020 & 2033
- Table 64: India Mice Models Industry Volume (K Unit) Forecast, by Application 2020 & 2033
- Table 65: Australia Mice Models Industry Revenue (Million) Forecast, by Application 2020 & 2033
- Table 66: Australia Mice Models Industry Volume (K Unit) Forecast, by Application 2020 & 2033
- Table 67: South Korea Mice Models Industry Revenue (Million) Forecast, by Application 2020 & 2033
- Table 68: South Korea Mice Models Industry Volume (K Unit) Forecast, by Application 2020 & 2033
- Table 69: Rest of Asia Pacific Mice Models Industry Revenue (Million) Forecast, by Application 2020 & 2033
- Table 70: Rest of Asia Pacific Mice Models Industry Volume (K Unit) Forecast, by Application 2020 & 2033
- Table 71: Global Mice Models Industry Revenue Million Forecast, by Type 2020 & 2033
- Table 72: Global Mice Models Industry Volume K Unit Forecast, by Type 2020 & 2033
- Table 73: Global Mice Models Industry Revenue Million Forecast, by Service 2020 & 2033
- Table 74: Global Mice Models Industry Volume K Unit Forecast, by Service 2020 & 2033
- Table 75: Global Mice Models Industry Revenue Million Forecast, by Technology 2020 & 2033
- Table 76: Global Mice Models Industry Volume K Unit Forecast, by Technology 2020 & 2033
- Table 77: Global Mice Models Industry Revenue Million Forecast, by Application 2020 & 2033
- Table 78: Global Mice Models Industry Volume K Unit Forecast, by Application 2020 & 2033
- Table 79: Global Mice Models Industry Revenue Million Forecast, by Country 2020 & 2033
- Table 80: Global Mice Models Industry Volume K Unit Forecast, by Country 2020 & 2033
- Table 81: GCC Mice Models Industry Revenue (Million) Forecast, by Application 2020 & 2033
- Table 82: GCC Mice Models Industry Volume (K Unit) Forecast, by Application 2020 & 2033
- Table 83: South Africa Mice Models Industry Revenue (Million) Forecast, by Application 2020 & 2033
- Table 84: South Africa Mice Models Industry Volume (K Unit) Forecast, by Application 2020 & 2033
- Table 85: Rest of Middle East and Africa Mice Models Industry Revenue (Million) Forecast, by Application 2020 & 2033
- Table 86: Rest of Middle East and Africa Mice Models Industry Volume (K Unit) Forecast, by Application 2020 & 2033
- Table 87: Global Mice Models Industry Revenue Million Forecast, by Type 2020 & 2033
- Table 88: Global Mice Models Industry Volume K Unit Forecast, by Type 2020 & 2033
- Table 89: Global Mice Models Industry Revenue Million Forecast, by Service 2020 & 2033
- Table 90: Global Mice Models Industry Volume K Unit Forecast, by Service 2020 & 2033
- Table 91: Global Mice Models Industry Revenue Million Forecast, by Technology 2020 & 2033
- Table 92: Global Mice Models Industry Volume K Unit Forecast, by Technology 2020 & 2033
- Table 93: Global Mice Models Industry Revenue Million Forecast, by Application 2020 & 2033
- Table 94: Global Mice Models Industry Volume K Unit Forecast, by Application 2020 & 2033
- Table 95: Global Mice Models Industry Revenue Million Forecast, by Country 2020 & 2033
- Table 96: Global Mice Models Industry Volume K Unit Forecast, by Country 2020 & 2033
- Table 97: Brazil Mice Models Industry Revenue (Million) Forecast, by Application 2020 & 2033
- Table 98: Brazil Mice Models Industry Volume (K Unit) Forecast, by Application 2020 & 2033
- Table 99: Argentina Mice Models Industry Revenue (Million) Forecast, by Application 2020 & 2033
- Table 100: Argentina Mice Models Industry Volume (K Unit) Forecast, by Application 2020 & 2033
- Table 101: Rest of South America Mice Models Industry Revenue (Million) Forecast, by Application 2020 & 2033
- Table 102: Rest of South America Mice Models Industry Volume (K Unit) Forecast, by Application 2020 & 2033
Frequently Asked Questions
1. What is the projected Compound Annual Growth Rate (CAGR) of the Mice Models Industry?
The projected CAGR is approximately 6.80%.
2. Which companies are prominent players in the Mice Models Industry?
Key companies in the market include Ozgene Pty Ltd, The Jackson Laboratory, Janvier Labs, The Andersons Inc, Trans Genic Inc , Ingenious Targeting Laboratory, ENVIGO, Charles River Laboratories International Inc, Taconic Biosciences Inc, Genoway, Horizon Discovery Group PLC (Sage Labs Inc ), Allentown LLC, Harbour Biomed, PolyGene.
3. What are the main segments of the Mice Models Industry?
The market segments include Type, Service, Technology, Application.
4. Can you provide details about the market size?
The market size is estimated to be USD 1.5 Million as of 2022.
5. What are some drivers contributing to market growth?
Increasing Innovation in Mice Models; Rising Demand for Personalized Medicine; Growing Pipeline of Pharmaceutical and Biophamraceutical Companies.
6. What are the notable trends driving market growth?
The Oncology Segment is Expected to Hold a Significant Market Share Over the Forecast Period.
7. Are there any restraints impacting market growth?
Alternatives to Animal Testing; Regulations for the Ethical Use of Animals.
8. Can you provide examples of recent developments in the market?
In February 2024, University of Texas Southwestern Medical Center introduced a new compound that significantly extended survival in a mouse model of amyotrophic lateral sclerosis (ALS) by blocking the activity of a group of proteins called MAP4Ks.
9. What pricing options are available for accessing the report?
Pricing options include single-user, multi-user, and enterprise licenses priced at USD 4750, USD 5250, and USD 8750 respectively.
10. Is the market size provided in terms of value or volume?
The market size is provided in terms of value, measured in Million and volume, measured in K Unit.
11. Are there any specific market keywords associated with the report?
Yes, the market keyword associated with the report is "Mice Models Industry," which aids in identifying and referencing the specific market segment covered.
12. How do I determine which pricing option suits my needs best?
The pricing options vary based on user requirements and access needs. Individual users may opt for single-user licenses, while businesses requiring broader access may choose multi-user or enterprise licenses for cost-effective access to the report.
13. Are there any additional resources or data provided in the Mice Models Industry report?
While the report offers comprehensive insights, it's advisable to review the specific contents or supplementary materials provided to ascertain if additional resources or data are available.
14. How can I stay updated on further developments or reports in the Mice Models Industry?
To stay informed about further developments, trends, and reports in the Mice Models Industry, consider subscribing to industry newsletters, following relevant companies and organizations, or regularly checking reputable industry news sources and publications.
Methodology
Step 1 - Identification of Relevant Samples Size from Population Database


Step 2 - Approaches for Defining Global Market Size (Value, Volume* & Price*)

Note*: In applicable scenarios
Step 3 - Data Sources
Primary Research
- Web Analytics
- Survey Reports
- Research Institute
- Latest Research Reports
- Opinion Leaders
Secondary Research
- Annual Reports
- White Paper
- Latest Press Release
- Industry Association
- Paid Database
- Investor Presentations

Step 4 - Data Triangulation
Involves using different sources of information in order to increase the validity of a study
These sources are likely to be stakeholders in a program - participants, other researchers, program staff, other community members, and so on.
Then we put all data in single framework & apply various statistical tools to find out the dynamic on the market.
During the analysis stage, feedback from the stakeholder groups would be compared to determine areas of agreement as well as areas of divergence