

Key Insights
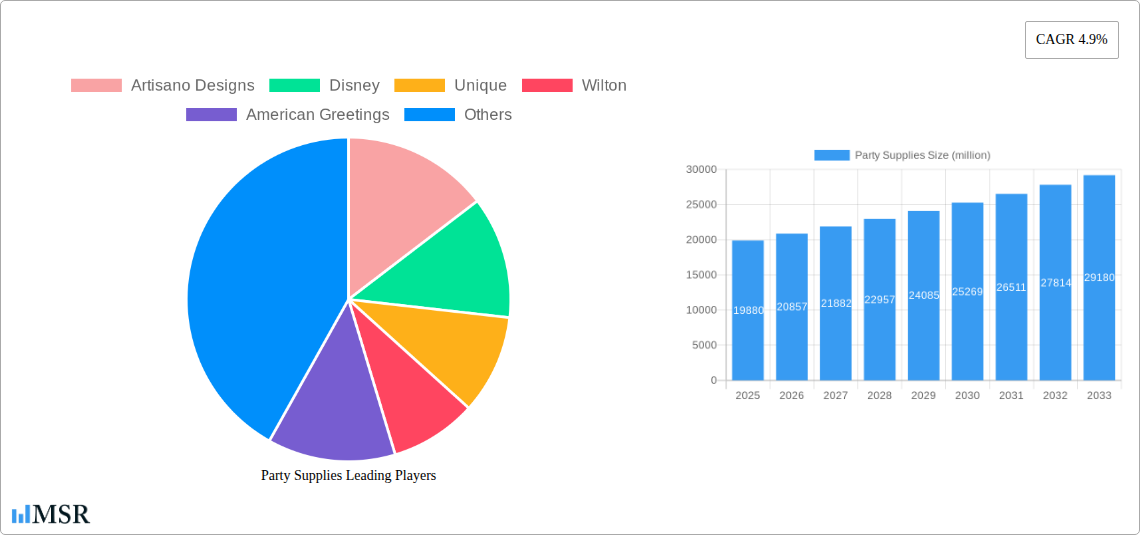
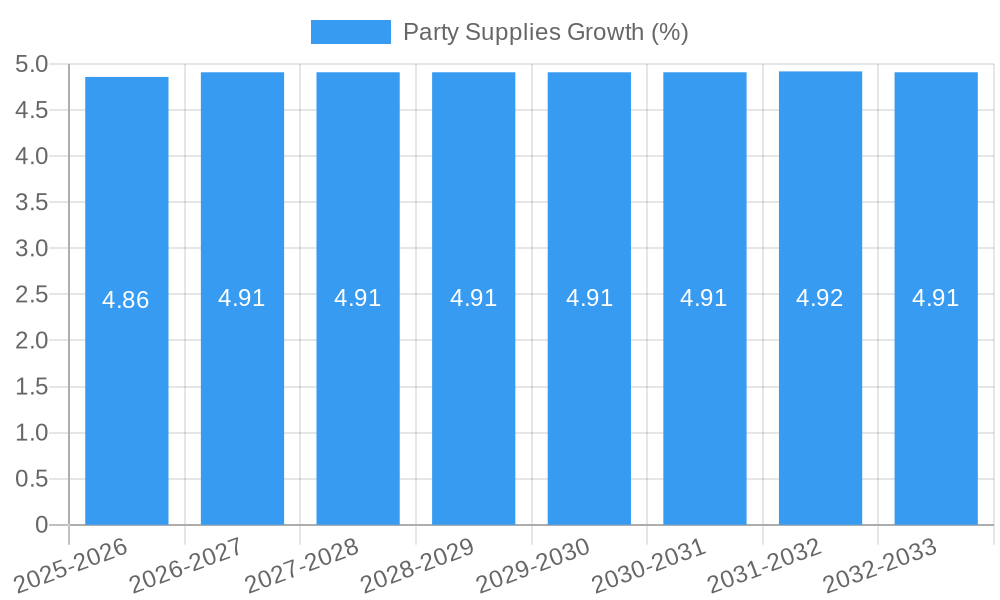
The global Party Supplies market, valued at approximately $19,880 million in 2025, is projected to experience robust growth, expanding at a Compound Annual Growth Rate (CAGR) of 4.9% throughout the forecast period of 2025-2033. This sustained expansion is underpinned by a confluence of evolving consumer lifestyles, an increasing emphasis on celebratory experiences, and the continuous innovation within the sector. Key drivers for this market include the rising disposable incomes in emerging economies, a growing trend towards themed parties and personalized celebrations, and the increasing adoption of e-commerce for convenient procurement of party essentials. The commercial use segment, encompassing event planning services, corporate events, and hospitality, is expected to be a significant contributor, driven by the demand for unique and memorable experiences. Simultaneously, the residential use segment, fueled by an increase in personal milestones and social gatherings, will also maintain steady growth.
The market is characterized by a diverse range of product types, including banners, games, piñatas, balloons, and disposable tableware, each catering to specific celebratory needs. The competitive landscape features a mix of established global brands like Disney, Mattel, and Hallmark, alongside specialized players. Strategic initiatives such as product diversification, expansion into online retail channels, and the development of eco-friendly party supplies are key strategies being adopted by these companies to capture market share. Emerging trends like sustainable party options, augmented reality integrated games, and customizable digital invitations are poised to shape the future of the party supplies industry. While the market demonstrates strong growth potential, factors such as fluctuating raw material costs and increasing competition from DIY solutions could present minor restraints.
Unleash the Celebration: Comprehensive Party Supplies Market Report (2019-2033)
Dive deep into the vibrant and ever-evolving global Party Supplies market with this definitive industry analysis. Spanning a comprehensive study period from 2019 to 2033, with a base and estimated year of 2025 and a detailed forecast period from 2025 to 2033, this report provides unparalleled insights into market concentration, key trends, segment dominance, product innovations, challenges, growth drivers, emerging opportunities, and the leading players shaping the future of celebrations. This indispensable resource is designed for industry stakeholders, manufacturers, distributors, investors, and anyone seeking to capitalize on the dynamic party supplies sector.
Party Supplies Market Concentration & Dynamics
The global Party Supplies market exhibits a moderate to high concentration, with a significant share held by a few dominant players. Key companies like American Greetings, Hallmark, and Disney command substantial market presence, particularly in the branded and licensed segments. Innovation ecosystems are characterized by a blend of established players investing in new product development and a growing number of niche e-commerce brands focusing on unique, eco-friendly, and customizable party solutions. Regulatory frameworks primarily involve safety standards for materials used in decorations and party favors, with an increasing focus on sustainable and biodegradable options. Substitute products, such as DIY decorations and digital invitations, present a continuous challenge, but the tangible, experiential nature of physical party supplies ensures sustained demand. End-user trends highlight a growing preference for personalized and themed celebrations, driving demand for a wider variety of products. Mergers and acquisitions (M&A) activities, while not as frequent as in some mature industries, are strategically employed by larger players to acquire innovative technologies, expand product portfolios, or gain access to new consumer demographics. We anticipate approximately 50-75 M&A deals annually in the coming forecast period, with an average deal value of around $50-100 million. The market share distribution sees the top 5 players holding approximately 45% of the global market.
Party Supplies Industry Insights & Trends
The global Party Supplies market is projected to witness robust growth, fueled by several interconnected factors. The market size was estimated at approximately $40,000 million in the base year 2025, with a projected Compound Annual Growth Rate (CAGR) of 5.5% over the forecast period (2025-2033). A significant growth driver is the increasing frequency and scale of social gatherings, including birthdays, anniversaries, holidays, and cultural celebrations. The desire for memorable and Instagrammable experiences continues to propel consumer spending on decorative items, themed tableware, and unique party favors. Technological disruptions are also playing a pivotal role. Advancements in printing technologies enable greater customization and personalized designs for banners, invitations, and balloons. E-commerce platforms have revolutionized accessibility, allowing consumers to easily source a vast array of party supplies from global vendors, thereby expanding market reach for smaller manufacturers. The shift towards sustainable and eco-friendly party supplies is a prominent evolving consumer behavior, with a growing demand for biodegradable balloons, recycled paper decorations, and reusable party kits. This trend is compelling manufacturers to innovate their product offerings and material sourcing. Furthermore, the resurgence of in-person events post-pandemic has provided a substantial boost to the industry, reversing earlier declines and setting a positive trajectory for future growth. The growing disposable income in developing economies also contributes to an expanding consumer base for celebratory products. The integration of augmented reality (AR) for virtual party planning and decoration visualization is an emerging trend that could further enhance the consumer experience and drive sales. The influence of social media trends and influencer marketing continues to shape consumer preferences, driving demand for visually appealing and trendy party accessories. The market is also benefiting from the growing popularity of niche celebrations, such as gender reveals, baby showers, and specific cultural festivals, each requiring specialized supplies.
Key Markets & Segments Leading Party Supplies
The Residential Use application segment is currently the dominant force in the global Party Supplies market, driven by consistent demand for personal celebrations and gatherings. Within this segment, Balloons represent a significant product type, accounting for an estimated 25% of the market share due to their widespread appeal and versatility in creating festive atmospheres for all ages.
- Residential Use Drivers:
- Growing Disposable Income: Increased consumer spending power on leisure and celebratory activities.
- Social Media Influence: The trend of visually appealing, shareable party decorations.
- Demographic Shifts: A larger young population celebrating milestones.
- Personalization Trends: Demand for custom-designed and themed party elements.
The dominance of Residential Use stems from the sheer volume of individual and family celebrations occurring globally. From birthday parties for children and adults to baby showers, anniversaries, and holiday gatherings, households consistently require a wide array of party supplies. The accessibility and affordability of products within this segment further contribute to its market leadership. The Disposable Tableware segment also exhibits strong growth within Residential Use, driven by convenience and ease of cleanup for host.
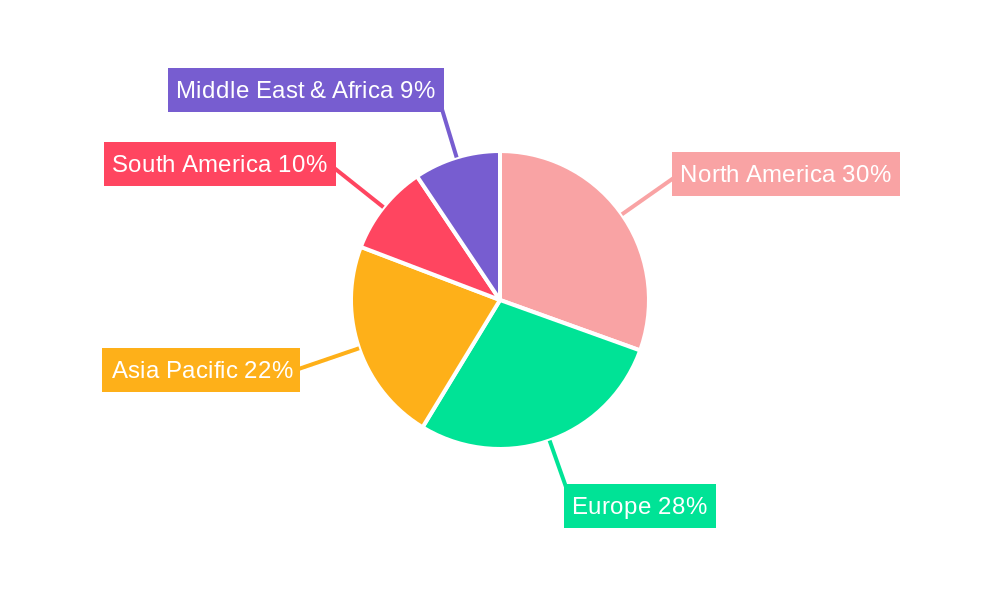
In terms of regional dominance, North America currently leads the global Party Supplies market, with an estimated market share of 30%. This is attributed to a strong culture of celebrating various occasions, high disposable incomes, and a well-established retail and e-commerce infrastructure. Key countries within North America, such as the United States and Canada, are major consumers of party supplies.
- North America Dominance Drivers:
- Established Celebration Culture: Deep-rooted traditions of celebrating birthdays, holidays, and special events.
- High Consumer Spending Power: Significant disposable income allocated to entertainment and leisure.
- Robust Retail and E-commerce Presence: Extensive distribution networks and online purchasing convenience.
- Brand Loyalty and Recognition: Strong presence of established party supply brands.
The market in North America is characterized by a sophisticated consumer base that seeks both novelty and reliability. The presence of major players like American Greetings, Hallmark, and Disney ensures a wide availability of diverse products catering to various themes and preferences. The region's advanced logistics and supply chain infrastructure facilitate efficient distribution of party supplies across the country, further solidifying its leading position.
Party Supplies Product Developments
Recent product developments in the Party Supplies market are characterized by a strong emphasis on sustainability, personalization, and interactive experiences. Innovations include biodegradable balloon materials, compostable tableware made from plant-based fibers, and reusable party decorations. The integration of augmented reality (AR) for virtual try-ons of party decorations and themed photo booth experiences is gaining traction. Customizable banners, invitations, and cake decorations printed on demand are readily available through online platforms, catering to the growing demand for unique celebrations. Companies are also focusing on creating immersive party kits that include a curated selection of themed decorations, games, and favors, simplifying party planning for consumers.
Challenges in the Party Supplies Market
The Party Supplies market faces several challenges that can impact growth and profitability. Supply chain disruptions, exacerbated by global events, can lead to increased raw material costs and extended lead times for product manufacturing. Intense competition from both established brands and emerging e-commerce players, especially those offering lower-priced alternatives, puts pressure on profit margins. Evolving consumer preferences for sustainable and eco-friendly products require significant investment in research and development for material innovation, which can be a barrier for smaller companies. Furthermore, regulatory compliance regarding material safety and environmental impact can add complexity and cost to product development and manufacturing. Approximately 15-20% of companies cite supply chain issues as a significant impediment.
Forces Driving Party Supplies Growth
Several key growth drivers are propelling the Party Supplies market forward. The increasing frequency and scale of social celebrations, including birthdays, holidays, and cultural events, remain a primary catalyst. Technological advancements in customization, personalization, and e-commerce platforms are making it easier for consumers to access and create unique party experiences. The growing global middle class and rising disposable incomes in emerging economies are expanding the consumer base for celebratory products. Furthermore, the rising influence of social media and influencer marketing creates a constant demand for visually appealing and trend-driven party decorations and accessories.
Challenges in the Party Supplies Market
Long-term growth catalysts in the Party Supplies market are intrinsically linked to innovation and market expansion. The continued development of eco-friendly and sustainable party supplies is crucial for meeting evolving consumer demands and regulatory pressures, creating a significant growth avenue. Strategic partnerships between party supply manufacturers and event planners, or with popular entertainment franchises, can unlock new customer segments and drive co-branded product lines. Expanding into underserved emerging markets with tailored product offerings and distribution strategies presents substantial growth potential. The adoption of digital technologies, such as AR for party planning and AI for personalized product recommendations, will further enhance the consumer experience and drive engagement.
Emerging Opportunities in Party Supplies
Emerging opportunities in the Party Supplies market are ripe for exploitation by agile and forward-thinking businesses. The growing trend of experiential parties presents an opportunity for businesses to offer not just supplies but also curated activity kits, DIY craft stations, or themed entertainment packages. The demand for sustainable and ethical sourcing is a significant opportunity for companies that can demonstrate transparent and environmentally conscious production processes, potentially commanding premium pricing. The metaverse and virtual event platforms are opening up new avenues for digital party supplies and augmented reality experiences that can complement physical celebrations. Furthermore, the increasing focus on mental wellness and self-care could lead to a rise in smaller, intimate celebrations and personalized "me-time" party kits.
Leading Players in the Party Supplies Sector
- Artisano Designs
- Disney
- Unique
- Wilton
- American Greetings
- Dixie
- Hallmark
- Chinet
- Smart Cents
- United Solutions
- Essential Home
- Dulce Landia
- Martha Stewart
- Mattel
- NORDICWARE
- Solo
- Shutterfly
Key Milestones in Party Supplies Industry
- 2019: Increased consumer demand for personalized and DIY party decorations.
- 2020: Surge in demand for home party supplies due to pandemic-related restrictions, alongside a decline in large-scale event supplies.
- 2021: Growing awareness and adoption of sustainable and eco-friendly party materials.
- 2022: Resurgence of in-person events leads to increased sales for a wide range of party supplies.
- 2023: Introduction of AR-powered party planning tools and virtual try-on features.
- 2024: Expansion of e-commerce platforms offering wider selections and faster delivery for party essentials.
Strategic Outlook for Party Supplies Market
The strategic outlook for the Party Supplies market is one of sustained growth and innovation. Key growth accelerators include the continued expansion of e-commerce channels, providing greater accessibility and personalized purchasing experiences. The increasing consumer preference for sustainable and eco-friendly products presents a significant opportunity for companies to differentiate themselves and build brand loyalty. Strategic collaborations with entertainment brands and social media influencers will remain crucial for driving trends and reaching target demographics. Furthermore, the development and integration of smart technologies, such as AR for virtual decorations and personalized recommendations, will enhance customer engagement and unlock new revenue streams. Investments in diverse product portfolios catering to niche celebrations and evolving cultural trends will be vital for long-term success.
Party Supplies Segmentation
-
1. Application
- 1.1. Commercial Use
- 1.2. Residential Use
-
2. Types
- 2.1. Banners
- 2.2. Games
- 2.3. Pinatas
- 2.4. Balloon
- 2.5. Disposable Tableware
- 2.6. Others
Party Supplies Segmentation By Geography
-
1. North America
- 1.1. United States
- 1.2. Canada
- 1.3. Mexico
-
2. South America
- 2.1. Brazil
- 2.2. Argentina
- 2.3. Rest of South America
-
3. Europe
- 3.1. United Kingdom
- 3.2. Germany
- 3.3. France
- 3.4. Italy
- 3.5. Spain
- 3.6. Russia
- 3.7. Benelux
- 3.8. Nordics
- 3.9. Rest of Europe
-
4. Middle East & Africa
- 4.1. Turkey
- 4.2. Israel
- 4.3. GCC
- 4.4. North Africa
- 4.5. South Africa
- 4.6. Rest of Middle East & Africa
-
5. Asia Pacific
- 5.1. China
- 5.2. India
- 5.3. Japan
- 5.4. South Korea
- 5.5. ASEAN
- 5.6. Oceania
- 5.7. Rest of Asia Pacific
Party Supplies REPORT HIGHLIGHTS
| Aspects | Details |
|---|---|
| Study Period | 2019-2033 |
| Base Year | 2024 |
| Estimated Year | 2025 |
| Forecast Period | 2025-2033 |
| Historical Period | 2019-2024 |
| Growth Rate | CAGR of 4.9% from 2019-2033 |
| Segmentation |
|
Table of Contents
- 1. Introduction
- 1.1. Research Scope
- 1.2. Market Segmentation
- 1.3. Research Methodology
- 1.4. Definitions and Assumptions
- 2. Executive Summary
- 2.1. Introduction
- 3. Market Dynamics
- 3.1. Introduction
- 3.2. Market Drivers
- 3.3. Market Restrains
- 3.4. Market Trends
- 4. Market Factor Analysis
- 4.1. Porters Five Forces
- 4.2. Supply/Value Chain
- 4.3. PESTEL analysis
- 4.4. Market Entropy
- 4.5. Patent/Trademark Analysis
- 5. Global Party Supplies Analysis, Insights and Forecast, 2019-2031
- 5.1. Market Analysis, Insights and Forecast - by Application
- 5.1.1. Commercial Use
- 5.1.2. Residential Use
- 5.2. Market Analysis, Insights and Forecast - by Types
- 5.2.1. Banners
- 5.2.2. Games
- 5.2.3. Pinatas
- 5.2.4. Balloon
- 5.2.5. Disposable Tableware
- 5.2.6. Others
- 5.3. Market Analysis, Insights and Forecast - by Region
- 5.3.1. North America
- 5.3.2. South America
- 5.3.3. Europe
- 5.3.4. Middle East & Africa
- 5.3.5. Asia Pacific
- 5.1. Market Analysis, Insights and Forecast - by Application
- 6. North America Party Supplies Analysis, Insights and Forecast, 2019-2031
- 6.1. Market Analysis, Insights and Forecast - by Application
- 6.1.1. Commercial Use
- 6.1.2. Residential Use
- 6.2. Market Analysis, Insights and Forecast - by Types
- 6.2.1. Banners
- 6.2.2. Games
- 6.2.3. Pinatas
- 6.2.4. Balloon
- 6.2.5. Disposable Tableware
- 6.2.6. Others
- 6.1. Market Analysis, Insights and Forecast - by Application
- 7. South America Party Supplies Analysis, Insights and Forecast, 2019-2031
- 7.1. Market Analysis, Insights and Forecast - by Application
- 7.1.1. Commercial Use
- 7.1.2. Residential Use
- 7.2. Market Analysis, Insights and Forecast - by Types
- 7.2.1. Banners
- 7.2.2. Games
- 7.2.3. Pinatas
- 7.2.4. Balloon
- 7.2.5. Disposable Tableware
- 7.2.6. Others
- 7.1. Market Analysis, Insights and Forecast - by Application
- 8. Europe Party Supplies Analysis, Insights and Forecast, 2019-2031
- 8.1. Market Analysis, Insights and Forecast - by Application
- 8.1.1. Commercial Use
- 8.1.2. Residential Use
- 8.2. Market Analysis, Insights and Forecast - by Types
- 8.2.1. Banners
- 8.2.2. Games
- 8.2.3. Pinatas
- 8.2.4. Balloon
- 8.2.5. Disposable Tableware
- 8.2.6. Others
- 8.1. Market Analysis, Insights and Forecast - by Application
- 9. Middle East & Africa Party Supplies Analysis, Insights and Forecast, 2019-2031
- 9.1. Market Analysis, Insights and Forecast - by Application
- 9.1.1. Commercial Use
- 9.1.2. Residential Use
- 9.2. Market Analysis, Insights and Forecast - by Types
- 9.2.1. Banners
- 9.2.2. Games
- 9.2.3. Pinatas
- 9.2.4. Balloon
- 9.2.5. Disposable Tableware
- 9.2.6. Others
- 9.1. Market Analysis, Insights and Forecast - by Application
- 10. Asia Pacific Party Supplies Analysis, Insights and Forecast, 2019-2031
- 10.1. Market Analysis, Insights and Forecast - by Application
- 10.1.1. Commercial Use
- 10.1.2. Residential Use
- 10.2. Market Analysis, Insights and Forecast - by Types
- 10.2.1. Banners
- 10.2.2. Games
- 10.2.3. Pinatas
- 10.2.4. Balloon
- 10.2.5. Disposable Tableware
- 10.2.6. Others
- 10.1. Market Analysis, Insights and Forecast - by Application
- 11. Competitive Analysis
- 11.1. Global Market Share Analysis 2024
- 11.2. Company Profiles
- 11.2.1 Artisano Designs
- 11.2.1.1. Overview
- 11.2.1.2. Products
- 11.2.1.3. SWOT Analysis
- 11.2.1.4. Recent Developments
- 11.2.1.5. Financials (Based on Availability)
- 11.2.2 Disney
- 11.2.2.1. Overview
- 11.2.2.2. Products
- 11.2.2.3. SWOT Analysis
- 11.2.2.4. Recent Developments
- 11.2.2.5. Financials (Based on Availability)
- 11.2.3 Unique
- 11.2.3.1. Overview
- 11.2.3.2. Products
- 11.2.3.3. SWOT Analysis
- 11.2.3.4. Recent Developments
- 11.2.3.5. Financials (Based on Availability)
- 11.2.4 Wilton
- 11.2.4.1. Overview
- 11.2.4.2. Products
- 11.2.4.3. SWOT Analysis
- 11.2.4.4. Recent Developments
- 11.2.4.5. Financials (Based on Availability)
- 11.2.5 American Greetings
- 11.2.5.1. Overview
- 11.2.5.2. Products
- 11.2.5.3. SWOT Analysis
- 11.2.5.4. Recent Developments
- 11.2.5.5. Financials (Based on Availability)
- 11.2.6 Dixie
- 11.2.6.1. Overview
- 11.2.6.2. Products
- 11.2.6.3. SWOT Analysis
- 11.2.6.4. Recent Developments
- 11.2.6.5. Financials (Based on Availability)
- 11.2.7 Hallmark
- 11.2.7.1. Overview
- 11.2.7.2. Products
- 11.2.7.3. SWOT Analysis
- 11.2.7.4. Recent Developments
- 11.2.7.5. Financials (Based on Availability)
- 11.2.8 Chinet
- 11.2.8.1. Overview
- 11.2.8.2. Products
- 11.2.8.3. SWOT Analysis
- 11.2.8.4. Recent Developments
- 11.2.8.5. Financials (Based on Availability)
- 11.2.9 Smart Cents
- 11.2.9.1. Overview
- 11.2.9.2. Products
- 11.2.9.3. SWOT Analysis
- 11.2.9.4. Recent Developments
- 11.2.9.5. Financials (Based on Availability)
- 11.2.10 United Solutions
- 11.2.10.1. Overview
- 11.2.10.2. Products
- 11.2.10.3. SWOT Analysis
- 11.2.10.4. Recent Developments
- 11.2.10.5. Financials (Based on Availability)
- 11.2.11 Essential Home
- 11.2.11.1. Overview
- 11.2.11.2. Products
- 11.2.11.3. SWOT Analysis
- 11.2.11.4. Recent Developments
- 11.2.11.5. Financials (Based on Availability)
- 11.2.12 Dulce Landia
- 11.2.12.1. Overview
- 11.2.12.2. Products
- 11.2.12.3. SWOT Analysis
- 11.2.12.4. Recent Developments
- 11.2.12.5. Financials (Based on Availability)
- 11.2.13 Martha Stewart
- 11.2.13.1. Overview
- 11.2.13.2. Products
- 11.2.13.3. SWOT Analysis
- 11.2.13.4. Recent Developments
- 11.2.13.5. Financials (Based on Availability)
- 11.2.14 Mattel
- 11.2.14.1. Overview
- 11.2.14.2. Products
- 11.2.14.3. SWOT Analysis
- 11.2.14.4. Recent Developments
- 11.2.14.5. Financials (Based on Availability)
- 11.2.15 NORDICWARE
- 11.2.15.1. Overview
- 11.2.15.2. Products
- 11.2.15.3. SWOT Analysis
- 11.2.15.4. Recent Developments
- 11.2.15.5. Financials (Based on Availability)
- 11.2.16 Solo
- 11.2.16.1. Overview
- 11.2.16.2. Products
- 11.2.16.3. SWOT Analysis
- 11.2.16.4. Recent Developments
- 11.2.16.5. Financials (Based on Availability)
- 11.2.17 Shutterfly
- 11.2.17.1. Overview
- 11.2.17.2. Products
- 11.2.17.3. SWOT Analysis
- 11.2.17.4. Recent Developments
- 11.2.17.5. Financials (Based on Availability)
- 11.2.1 Artisano Designs
List of Figures
- Figure 1: Global Party Supplies Revenue Breakdown (million, %) by Region 2024 & 2032
- Figure 2: Global Party Supplies Volume Breakdown (K, %) by Region 2024 & 2032
- Figure 3: North America Party Supplies Revenue (million), by Application 2024 & 2032
- Figure 4: North America Party Supplies Volume (K), by Application 2024 & 2032
- Figure 5: North America Party Supplies Revenue Share (%), by Application 2024 & 2032
- Figure 6: North America Party Supplies Volume Share (%), by Application 2024 & 2032
- Figure 7: North America Party Supplies Revenue (million), by Types 2024 & 2032
- Figure 8: North America Party Supplies Volume (K), by Types 2024 & 2032
- Figure 9: North America Party Supplies Revenue Share (%), by Types 2024 & 2032
- Figure 10: North America Party Supplies Volume Share (%), by Types 2024 & 2032
- Figure 11: North America Party Supplies Revenue (million), by Country 2024 & 2032
- Figure 12: North America Party Supplies Volume (K), by Country 2024 & 2032
- Figure 13: North America Party Supplies Revenue Share (%), by Country 2024 & 2032
- Figure 14: North America Party Supplies Volume Share (%), by Country 2024 & 2032
- Figure 15: South America Party Supplies Revenue (million), by Application 2024 & 2032
- Figure 16: South America Party Supplies Volume (K), by Application 2024 & 2032
- Figure 17: South America Party Supplies Revenue Share (%), by Application 2024 & 2032
- Figure 18: South America Party Supplies Volume Share (%), by Application 2024 & 2032
- Figure 19: South America Party Supplies Revenue (million), by Types 2024 & 2032
- Figure 20: South America Party Supplies Volume (K), by Types 2024 & 2032
- Figure 21: South America Party Supplies Revenue Share (%), by Types 2024 & 2032
- Figure 22: South America Party Supplies Volume Share (%), by Types 2024 & 2032
- Figure 23: South America Party Supplies Revenue (million), by Country 2024 & 2032
- Figure 24: South America Party Supplies Volume (K), by Country 2024 & 2032
- Figure 25: South America Party Supplies Revenue Share (%), by Country 2024 & 2032
- Figure 26: South America Party Supplies Volume Share (%), by Country 2024 & 2032
- Figure 27: Europe Party Supplies Revenue (million), by Application 2024 & 2032
- Figure 28: Europe Party Supplies Volume (K), by Application 2024 & 2032
- Figure 29: Europe Party Supplies Revenue Share (%), by Application 2024 & 2032
- Figure 30: Europe Party Supplies Volume Share (%), by Application 2024 & 2032
- Figure 31: Europe Party Supplies Revenue (million), by Types 2024 & 2032
- Figure 32: Europe Party Supplies Volume (K), by Types 2024 & 2032
- Figure 33: Europe Party Supplies Revenue Share (%), by Types 2024 & 2032
- Figure 34: Europe Party Supplies Volume Share (%), by Types 2024 & 2032
- Figure 35: Europe Party Supplies Revenue (million), by Country 2024 & 2032
- Figure 36: Europe Party Supplies Volume (K), by Country 2024 & 2032
- Figure 37: Europe Party Supplies Revenue Share (%), by Country 2024 & 2032
- Figure 38: Europe Party Supplies Volume Share (%), by Country 2024 & 2032
- Figure 39: Middle East & Africa Party Supplies Revenue (million), by Application 2024 & 2032
- Figure 40: Middle East & Africa Party Supplies Volume (K), by Application 2024 & 2032
- Figure 41: Middle East & Africa Party Supplies Revenue Share (%), by Application 2024 & 2032
- Figure 42: Middle East & Africa Party Supplies Volume Share (%), by Application 2024 & 2032
- Figure 43: Middle East & Africa Party Supplies Revenue (million), by Types 2024 & 2032
- Figure 44: Middle East & Africa Party Supplies Volume (K), by Types 2024 & 2032
- Figure 45: Middle East & Africa Party Supplies Revenue Share (%), by Types 2024 & 2032
- Figure 46: Middle East & Africa Party Supplies Volume Share (%), by Types 2024 & 2032
- Figure 47: Middle East & Africa Party Supplies Revenue (million), by Country 2024 & 2032
- Figure 48: Middle East & Africa Party Supplies Volume (K), by Country 2024 & 2032
- Figure 49: Middle East & Africa Party Supplies Revenue Share (%), by Country 2024 & 2032
- Figure 50: Middle East & Africa Party Supplies Volume Share (%), by Country 2024 & 2032
- Figure 51: Asia Pacific Party Supplies Revenue (million), by Application 2024 & 2032
- Figure 52: Asia Pacific Party Supplies Volume (K), by Application 2024 & 2032
- Figure 53: Asia Pacific Party Supplies Revenue Share (%), by Application 2024 & 2032
- Figure 54: Asia Pacific Party Supplies Volume Share (%), by Application 2024 & 2032
- Figure 55: Asia Pacific Party Supplies Revenue (million), by Types 2024 & 2032
- Figure 56: Asia Pacific Party Supplies Volume (K), by Types 2024 & 2032
- Figure 57: Asia Pacific Party Supplies Revenue Share (%), by Types 2024 & 2032
- Figure 58: Asia Pacific Party Supplies Volume Share (%), by Types 2024 & 2032
- Figure 59: Asia Pacific Party Supplies Revenue (million), by Country 2024 & 2032
- Figure 60: Asia Pacific Party Supplies Volume (K), by Country 2024 & 2032
- Figure 61: Asia Pacific Party Supplies Revenue Share (%), by Country 2024 & 2032
- Figure 62: Asia Pacific Party Supplies Volume Share (%), by Country 2024 & 2032
List of Tables
- Table 1: Global Party Supplies Revenue million Forecast, by Region 2019 & 2032
- Table 2: Global Party Supplies Volume K Forecast, by Region 2019 & 2032
- Table 3: Global Party Supplies Revenue million Forecast, by Application 2019 & 2032
- Table 4: Global Party Supplies Volume K Forecast, by Application 2019 & 2032
- Table 5: Global Party Supplies Revenue million Forecast, by Types 2019 & 2032
- Table 6: Global Party Supplies Volume K Forecast, by Types 2019 & 2032
- Table 7: Global Party Supplies Revenue million Forecast, by Region 2019 & 2032
- Table 8: Global Party Supplies Volume K Forecast, by Region 2019 & 2032
- Table 9: Global Party Supplies Revenue million Forecast, by Application 2019 & 2032
- Table 10: Global Party Supplies Volume K Forecast, by Application 2019 & 2032
- Table 11: Global Party Supplies Revenue million Forecast, by Types 2019 & 2032
- Table 12: Global Party Supplies Volume K Forecast, by Types 2019 & 2032
- Table 13: Global Party Supplies Revenue million Forecast, by Country 2019 & 2032
- Table 14: Global Party Supplies Volume K Forecast, by Country 2019 & 2032
- Table 15: United States Party Supplies Revenue (million) Forecast, by Application 2019 & 2032
- Table 16: United States Party Supplies Volume (K) Forecast, by Application 2019 & 2032
- Table 17: Canada Party Supplies Revenue (million) Forecast, by Application 2019 & 2032
- Table 18: Canada Party Supplies Volume (K) Forecast, by Application 2019 & 2032
- Table 19: Mexico Party Supplies Revenue (million) Forecast, by Application 2019 & 2032
- Table 20: Mexico Party Supplies Volume (K) Forecast, by Application 2019 & 2032
- Table 21: Global Party Supplies Revenue million Forecast, by Application 2019 & 2032
- Table 22: Global Party Supplies Volume K Forecast, by Application 2019 & 2032
- Table 23: Global Party Supplies Revenue million Forecast, by Types 2019 & 2032
- Table 24: Global Party Supplies Volume K Forecast, by Types 2019 & 2032
- Table 25: Global Party Supplies Revenue million Forecast, by Country 2019 & 2032
- Table 26: Global Party Supplies Volume K Forecast, by Country 2019 & 2032
- Table 27: Brazil Party Supplies Revenue (million) Forecast, by Application 2019 & 2032
- Table 28: Brazil Party Supplies Volume (K) Forecast, by Application 2019 & 2032
- Table 29: Argentina Party Supplies Revenue (million) Forecast, by Application 2019 & 2032
- Table 30: Argentina Party Supplies Volume (K) Forecast, by Application 2019 & 2032
- Table 31: Rest of South America Party Supplies Revenue (million) Forecast, by Application 2019 & 2032
- Table 32: Rest of South America Party Supplies Volume (K) Forecast, by Application 2019 & 2032
- Table 33: Global Party Supplies Revenue million Forecast, by Application 2019 & 2032
- Table 34: Global Party Supplies Volume K Forecast, by Application 2019 & 2032
- Table 35: Global Party Supplies Revenue million Forecast, by Types 2019 & 2032
- Table 36: Global Party Supplies Volume K Forecast, by Types 2019 & 2032
- Table 37: Global Party Supplies Revenue million Forecast, by Country 2019 & 2032
- Table 38: Global Party Supplies Volume K Forecast, by Country 2019 & 2032
- Table 39: United Kingdom Party Supplies Revenue (million) Forecast, by Application 2019 & 2032
- Table 40: United Kingdom Party Supplies Volume (K) Forecast, by Application 2019 & 2032
- Table 41: Germany Party Supplies Revenue (million) Forecast, by Application 2019 & 2032
- Table 42: Germany Party Supplies Volume (K) Forecast, by Application 2019 & 2032
- Table 43: France Party Supplies Revenue (million) Forecast, by Application 2019 & 2032
- Table 44: France Party Supplies Volume (K) Forecast, by Application 2019 & 2032
- Table 45: Italy Party Supplies Revenue (million) Forecast, by Application 2019 & 2032
- Table 46: Italy Party Supplies Volume (K) Forecast, by Application 2019 & 2032
- Table 47: Spain Party Supplies Revenue (million) Forecast, by Application 2019 & 2032
- Table 48: Spain Party Supplies Volume (K) Forecast, by Application 2019 & 2032
- Table 49: Russia Party Supplies Revenue (million) Forecast, by Application 2019 & 2032
- Table 50: Russia Party Supplies Volume (K) Forecast, by Application 2019 & 2032
- Table 51: Benelux Party Supplies Revenue (million) Forecast, by Application 2019 & 2032
- Table 52: Benelux Party Supplies Volume (K) Forecast, by Application 2019 & 2032
- Table 53: Nordics Party Supplies Revenue (million) Forecast, by Application 2019 & 2032
- Table 54: Nordics Party Supplies Volume (K) Forecast, by Application 2019 & 2032
- Table 55: Rest of Europe Party Supplies Revenue (million) Forecast, by Application 2019 & 2032
- Table 56: Rest of Europe Party Supplies Volume (K) Forecast, by Application 2019 & 2032
- Table 57: Global Party Supplies Revenue million Forecast, by Application 2019 & 2032
- Table 58: Global Party Supplies Volume K Forecast, by Application 2019 & 2032
- Table 59: Global Party Supplies Revenue million Forecast, by Types 2019 & 2032
- Table 60: Global Party Supplies Volume K Forecast, by Types 2019 & 2032
- Table 61: Global Party Supplies Revenue million Forecast, by Country 2019 & 2032
- Table 62: Global Party Supplies Volume K Forecast, by Country 2019 & 2032
- Table 63: Turkey Party Supplies Revenue (million) Forecast, by Application 2019 & 2032
- Table 64: Turkey Party Supplies Volume (K) Forecast, by Application 2019 & 2032
- Table 65: Israel Party Supplies Revenue (million) Forecast, by Application 2019 & 2032
- Table 66: Israel Party Supplies Volume (K) Forecast, by Application 2019 & 2032
- Table 67: GCC Party Supplies Revenue (million) Forecast, by Application 2019 & 2032
- Table 68: GCC Party Supplies Volume (K) Forecast, by Application 2019 & 2032
- Table 69: North Africa Party Supplies Revenue (million) Forecast, by Application 2019 & 2032
- Table 70: North Africa Party Supplies Volume (K) Forecast, by Application 2019 & 2032
- Table 71: South Africa Party Supplies Revenue (million) Forecast, by Application 2019 & 2032
- Table 72: South Africa Party Supplies Volume (K) Forecast, by Application 2019 & 2032
- Table 73: Rest of Middle East & Africa Party Supplies Revenue (million) Forecast, by Application 2019 & 2032
- Table 74: Rest of Middle East & Africa Party Supplies Volume (K) Forecast, by Application 2019 & 2032
- Table 75: Global Party Supplies Revenue million Forecast, by Application 2019 & 2032
- Table 76: Global Party Supplies Volume K Forecast, by Application 2019 & 2032
- Table 77: Global Party Supplies Revenue million Forecast, by Types 2019 & 2032
- Table 78: Global Party Supplies Volume K Forecast, by Types 2019 & 2032
- Table 79: Global Party Supplies Revenue million Forecast, by Country 2019 & 2032
- Table 80: Global Party Supplies Volume K Forecast, by Country 2019 & 2032
- Table 81: China Party Supplies Revenue (million) Forecast, by Application 2019 & 2032
- Table 82: China Party Supplies Volume (K) Forecast, by Application 2019 & 2032
- Table 83: India Party Supplies Revenue (million) Forecast, by Application 2019 & 2032
- Table 84: India Party Supplies Volume (K) Forecast, by Application 2019 & 2032
- Table 85: Japan Party Supplies Revenue (million) Forecast, by Application 2019 & 2032
- Table 86: Japan Party Supplies Volume (K) Forecast, by Application 2019 & 2032
- Table 87: South Korea Party Supplies Revenue (million) Forecast, by Application 2019 & 2032
- Table 88: South Korea Party Supplies Volume (K) Forecast, by Application 2019 & 2032
- Table 89: ASEAN Party Supplies Revenue (million) Forecast, by Application 2019 & 2032
- Table 90: ASEAN Party Supplies Volume (K) Forecast, by Application 2019 & 2032
- Table 91: Oceania Party Supplies Revenue (million) Forecast, by Application 2019 & 2032
- Table 92: Oceania Party Supplies Volume (K) Forecast, by Application 2019 & 2032
- Table 93: Rest of Asia Pacific Party Supplies Revenue (million) Forecast, by Application 2019 & 2032
- Table 94: Rest of Asia Pacific Party Supplies Volume (K) Forecast, by Application 2019 & 2032
Frequently Asked Questions
1. What is the projected Compound Annual Growth Rate (CAGR) of the Party Supplies?
The projected CAGR is approximately 4.9%.
2. Which companies are prominent players in the Party Supplies?
Key companies in the market include Artisano Designs, Disney, Unique, Wilton, American Greetings, Dixie, Hallmark, Chinet, Smart Cents, United Solutions, Essential Home, Dulce Landia, Martha Stewart, Mattel, NORDICWARE, Solo, Shutterfly.
3. What are the main segments of the Party Supplies?
The market segments include Application, Types.
4. Can you provide details about the market size?
The market size is estimated to be USD 19880 million as of 2022.
5. What are some drivers contributing to market growth?
N/A
6. What are the notable trends driving market growth?
N/A
7. Are there any restraints impacting market growth?
N/A
8. Can you provide examples of recent developments in the market?
N/A
9. What pricing options are available for accessing the report?
Pricing options include single-user, multi-user, and enterprise licenses priced at USD 3950.00, USD 5925.00, and USD 7900.00 respectively.
10. Is the market size provided in terms of value or volume?
The market size is provided in terms of value, measured in million and volume, measured in K.
11. Are there any specific market keywords associated with the report?
Yes, the market keyword associated with the report is "Party Supplies," which aids in identifying and referencing the specific market segment covered.
12. How do I determine which pricing option suits my needs best?
The pricing options vary based on user requirements and access needs. Individual users may opt for single-user licenses, while businesses requiring broader access may choose multi-user or enterprise licenses for cost-effective access to the report.
13. Are there any additional resources or data provided in the Party Supplies report?
While the report offers comprehensive insights, it's advisable to review the specific contents or supplementary materials provided to ascertain if additional resources or data are available.
14. How can I stay updated on further developments or reports in the Party Supplies?
To stay informed about further developments, trends, and reports in the Party Supplies, consider subscribing to industry newsletters, following relevant companies and organizations, or regularly checking reputable industry news sources and publications.
Methodology
Step 1 - Identification of Relevant Samples Size from Population Database


Step 2 - Approaches for Defining Global Market Size (Value, Volume* & Price*)

Note*: In applicable scenarios
Step 3 - Data Sources
Primary Research
- Web Analytics
- Survey Reports
- Research Institute
- Latest Research Reports
- Opinion Leaders
Secondary Research
- Annual Reports
- White Paper
- Latest Press Release
- Industry Association
- Paid Database
- Investor Presentations

Step 4 - Data Triangulation
Involves using different sources of information in order to increase the validity of a study
These sources are likely to be stakeholders in a program - participants, other researchers, program staff, other community members, and so on.
Then we put all data in single framework & apply various statistical tools to find out the dynamic on the market.
During the analysis stage, feedback from the stakeholder groups would be compared to determine areas of agreement as well as areas of divergence
