

Key Insights
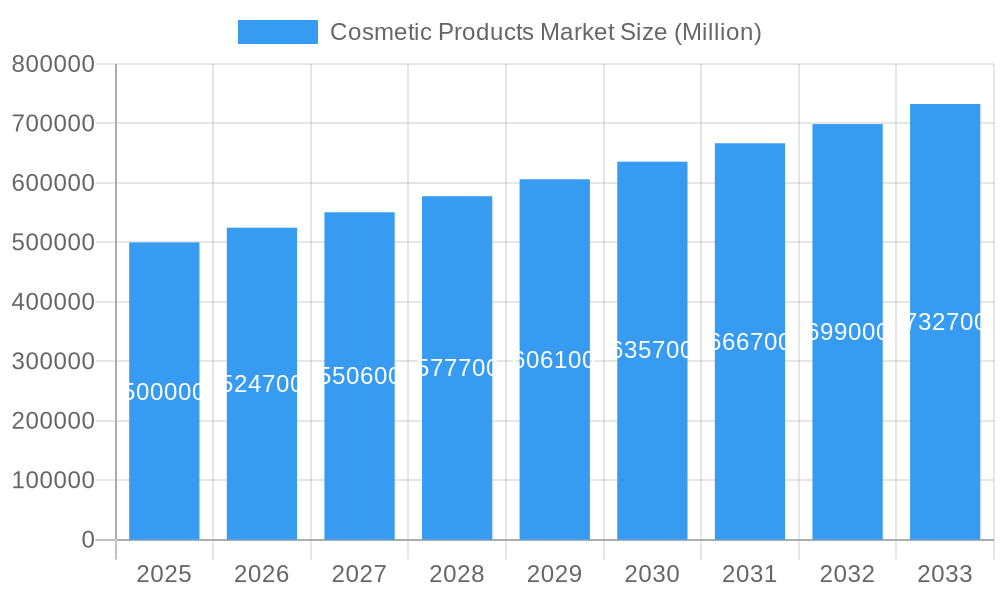
The global cosmetic products market is poised for significant expansion, projected to reach $67.54 billion by 2033, driven by a Compound Annual Growth Rate (CAGR) of 6.01% from the base year 2025. Key growth accelerators include rising disposable incomes in emerging economies, fostering increased expenditure on beauty and personal care. The pervasive influence of social media and beauty influencers is actively shaping consumer purchasing decisions, stimulating demand for novel and trend-driven products. Innovations in cosmetic formulations, emphasizing natural and organic ingredients, coupled with advancements in personalized beauty solutions, are aligning with evolving consumer preferences and contributing to market uplift. The premium segment is anticipated to outpace the mass segment, reflecting a growing demand for high-quality, luxury offerings. E-commerce channels are demonstrating robust growth, offering superior convenience and reach compared to traditional retail, and are instrumental in propelling market advancement.
Cosmetic Products Market Market Size (In Billion)
Conversely, market expansion is tempered by several restraints. Volatility in raw material pricing and economic unpredictability can affect production expenditures and consumer purchasing power. Heightened consumer awareness regarding the environmental impact of cosmetic products and stringent ingredient safety regulations are compelling manufacturers towards sustainable and eco-friendly practices, presenting both challenges and avenues for innovation. Intense competition among established and emerging brands necessitates ongoing product development and strategic marketing initiatives. While North America and Europe currently lead the market, the Asia-Pacific region is projected to experience substantial growth, fueled by increasing urbanization and rising beauty consciousness in developing nations. Market segmentation by product type (e.g., facial, eye, lip, nail makeup) and distribution channel (e.g., hypermarkets, specialty stores, online, pharmacies) highlights diverse consumer behaviors, offering strategic opportunities for targeted marketing and product innovation.
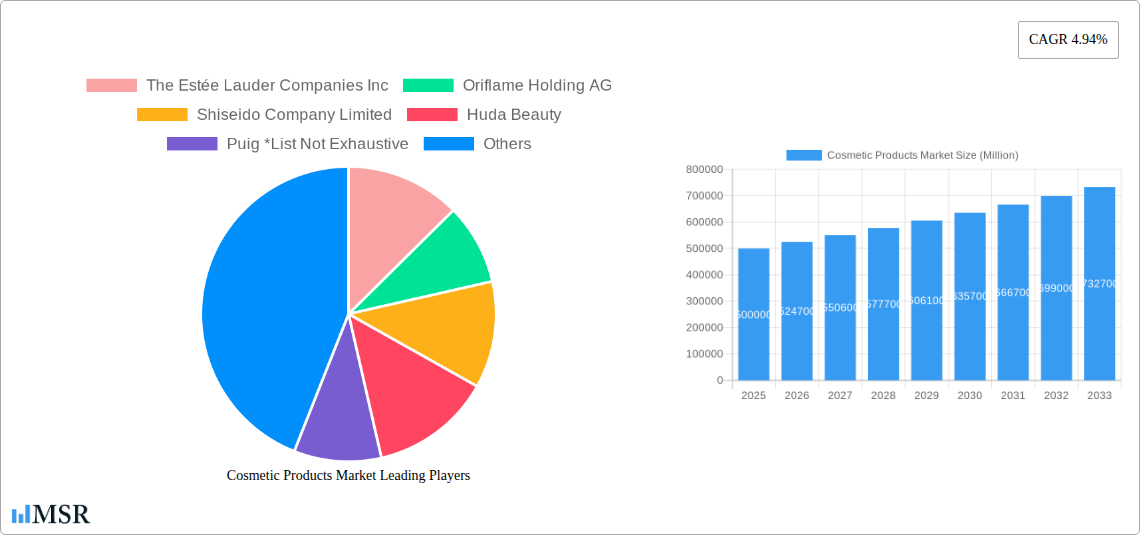
Cosmetic Products Market Company Market Share
Unlock the Secrets to Success in the Booming Cosmetic Products Market: A Comprehensive Report (2019-2033)
This in-depth report provides a comprehensive analysis of the global Cosmetic Products Market, offering invaluable insights for stakeholders across the value chain. From market size and segmentation to key players and future trends, this report is your essential guide to navigating this dynamic industry. With a detailed study period spanning 2019-2033 (Base Year: 2025, Forecast Period: 2025-2033), this report offers actionable intelligence for informed decision-making. The report leverages data from the historical period (2019-2024) and provides estimations for 2025.
Cosmetic Products Market Market Concentration & Dynamics
The global cosmetic products market is characterized by a complex interplay of factors influencing its concentration and overall dynamics. Market share is highly fragmented, with a few dominant players like L'Oréal S.A. and The Estée Lauder Companies Inc. holding significant portions, while numerous smaller brands and niche players contribute to the overall market vibrancy. The market's concentration ratio (CRx) is estimated at xx in 2025, indicating a moderately competitive landscape. This competitive landscape is further shaped by a dynamic innovation ecosystem, characterized by continuous product development, ingredient innovation, and technological advancements in formulation and application. Stringent regulatory frameworks governing product safety and labeling across various regions significantly influence market operations. The presence of substitute products, including natural and organic cosmetics, challenges established brands to adapt and innovate. Evolving end-user trends, including increasing awareness of sustainability and ethical sourcing, drive demand for eco-friendly and cruelty-free products. Finally, the market witnesses consistent M&A activity, with an estimated xx number of deals in 2024, reflecting strategic expansion and consolidation efforts among leading players. This activity further shapes market dynamics and concentration levels.
Cosmetic Products Market Industry Insights & Trends
The global cosmetic products market exhibits robust growth, driven by several key factors. Rising disposable incomes, particularly in emerging economies, fuel increased spending on beauty and personal care. The market size reached an estimated xx Million in 2024 and is projected to reach xx Million by 2033, registering a CAGR of xx% during the forecast period. Technological disruptions, including the rise of e-commerce, personalized beauty solutions, and advanced formulations using AI and big data analytics, are transforming the industry landscape. Evolving consumer behaviors, with a growing focus on natural ingredients, personalized beauty routines, and sustainable practices, influence product innovation and marketing strategies. The increasing popularity of social media and influencer marketing significantly impacts consumer preferences and brand loyalty. The market also witnesses a growing demand for specialized products, catering to specific skin types, concerns, and demographics, further contributing to overall market growth and expansion.
Key Markets & Segments Leading Cosmetic Products Market
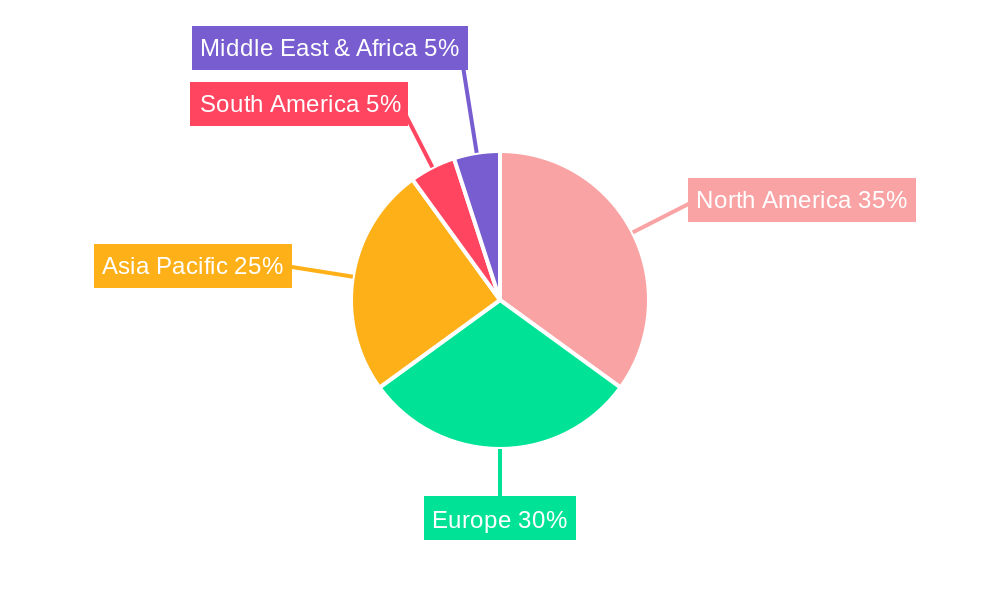
The global cosmetic products market is geographically diverse, with significant regional variations in market size and growth rates. North America and Europe currently hold dominant positions, driven by high per capita consumption and established distribution networks. However, Asia Pacific, particularly China and India, are emerging as high-growth regions, fueled by rising disposable incomes and increasing adoption of Western beauty trends.
- Dominant Segments:
- Product Type: Facial make-up products dominate the market, followed by eye, lip, and nail make-up products.
- Category: The premium segment shows higher growth potential due to increasing consumer spending on high-quality products and sophisticated formulations.
- Distribution Channel: Online retail stores are experiencing rapid expansion, alongside established channels like hypermarkets/supermarkets and specialty stores. Pharmacies and drug stores represent a significant but relatively stable channel.
Drivers of Regional Dominance:
- North America & Europe: High per capita income, established retail infrastructure, early adoption of new products and trends, advanced technological infrastructure.
- Asia Pacific: Rapid economic growth, burgeoning middle class, increasing disposable incomes, growing interest in Western beauty standards.
Cosmetic Products Market Product Developments
The cosmetic products market witnesses continuous product innovation, driven by advancements in formulation technology, ingredient sourcing, and consumer demand for specialized solutions. New product launches frequently feature natural and organic ingredients, sustainable packaging, and personalized formulations catering to specific skin types and concerns. Technological advancements are resulting in more effective, targeted, and user-friendly products. Companies are increasingly leveraging artificial intelligence and big data analytics to personalize product recommendations and enhance the customer experience, fostering greater customer loyalty and driving sales. This competitive innovation landscape creates constant pressure for companies to differentiate their products through cutting-edge technology and unique formulations.
Challenges in the Cosmetic Products Market Market
The cosmetic products market faces several challenges, including increasing regulatory scrutiny regarding ingredient safety and labeling, leading to higher compliance costs and potential product recalls. Supply chain disruptions can significantly impact production and distribution, affecting product availability and pricing. Intense competition among established and emerging brands necessitates continuous innovation and marketing efforts to maintain market share and brand relevance. Fluctuating raw material prices also affect profitability, requiring strategic sourcing and cost-management strategies. These factors can collectively restrict market growth and profitability for individual players.
Forces Driving Cosmetic Products Market Growth
Several key factors drive the growth of the cosmetic products market. Technological advancements in formulation, packaging, and distribution are creating more effective, personalized, and convenient products. Economic growth, particularly in developing economies, fuels increased consumer spending on personal care and beauty. Favorable regulatory environments supporting innovation and consumer protection encourage market expansion. The growing influence of social media and digital marketing allows brands to reach broader consumer segments and build stronger brand loyalty. These collaborative forces contribute significantly to an expansion of the cosmetic market.
Challenges in the Cosmetic Products Market Market
Long-term growth in the cosmetic products market hinges on sustained innovation in product formulations and packaging, focusing on natural and sustainable ingredients. Strategic partnerships with retailers and distributors are crucial for enhancing market reach and brand visibility. Expanding into new and emerging markets, such as regions with growing middle classes and disposable incomes, presents substantial growth opportunities. These combined efforts ensure sustained future growth in this dynamic market.
Emerging Opportunities in Cosmetic Products Market
Emerging opportunities in the cosmetic products market include the growth of personalized beauty, driven by advancements in genomics and customized formulations. The increasing demand for sustainable and ethically sourced ingredients creates opportunities for brands focused on eco-friendly practices. New technologies, like augmented reality (AR) and virtual reality (VR), offer innovative ways for brands to engage with consumers and enhance the shopping experience. The expansion into underpenetrated markets in developing economies holds significant promise for future market growth. These present lucrative pathways for growth in the cosmetic industry.
Leading Players in the Cosmetic Products Market Sector
- The Estée Lauder Companies Inc
- Oriflame Holding AG
- Shiseido Company Limited
- Huda Beauty
- Puig *List Not Exhaustive
- L'Oréal S A
- Revlon Inc
- Natura & Co
- LVMH Moët Hennessy Louis Vuitton
- JAB Cosmetics B V (Coty Inc )
Key Milestones in Cosmetic Products Market Industry
- May 2022: Estée Lauder and Shoppers Stop launched an exclusive SS Beauty store in Mumbai, strengthening their partnership in the Indian market.
- May 2022: Estée Lauder's M.A.C Cosmetics and Netflix collaborated on a limited-edition Stranger Things makeup collection, leveraging pop culture for brand visibility and sales.
- May 2022: L'Oréal's Maybelline New York launched Super Stay Vinyl Ink Liquid Lip Color, introducing a long-lasting product in a competitive market.
Strategic Outlook for Cosmetic Products Market Market
The future of the cosmetic products market looks promising, with continued growth driven by evolving consumer preferences, technological advancements, and strategic expansions into new markets. Brands that effectively leverage digital marketing, personalize product offerings, and focus on sustainability will capture larger market shares. Strategic acquisitions and partnerships will play a vital role in consolidating market dominance and expanding product portfolios. The industry's long-term potential is significant, presenting substantial opportunities for companies that can adapt to the changing landscape and cater to the evolving needs of consumers.
Cosmetic Products Market Segmentation
-
1. Product Type
- 1.1. Facial Make-up Products
- 1.2. Eye Make-up Products
- 1.3. Lip Make-up Products
- 1.4. Nail Make-up Products
-
2. Category
- 2.1. Mass
- 2.2. Premium
-
3. Distribution Channel
- 3.1. Hypermarkets/Supermarkets
- 3.2. Specialty Stores
- 3.3. Online Retail Stores
- 3.4. Pharmacies and Drug Stores
- 3.5. Other Distribution Channels
Cosmetic Products Market Segmentation By Geography
-
1. North America
- 1.1. United States
- 1.2. Canada
- 1.3. Mexico
- 1.4. Rest of North America
-
2. Europe
- 2.1. United Kingdom
- 2.2. Germany
- 2.3. Spain
- 2.4. France
- 2.5. Italy
- 2.6. Russia
- 2.7. Rest of Europe
-
3. Asia Pacific
- 3.1. China
- 3.2. Japan
- 3.3. India
- 3.4. Australia
- 3.5. Rest of Asia Pacific
-
4. South America
- 4.1. Brazil
- 4.2. Argentina
- 4.3. Rest of South America
- 5. Middle East
-
6. United Arab Emirates
- 6.1. South Africa
- 6.2. Rest of Middle East
Cosmetic Products Market Regional Market Share
Geographic Coverage of Cosmetic Products Market
Cosmetic Products Market REPORT HIGHLIGHTS
| Aspects | Details |
|---|---|
| Study Period | 2020-2034 |
| Base Year | 2025 |
| Estimated Year | 2026 |
| Forecast Period | 2026-2034 |
| Historical Period | 2020-2025 |
| Growth Rate | CAGR of 6.01% from 2020-2034 |
| Segmentation |
|
Table of Contents
- 1. Introduction
- 1.1. Research Scope
- 1.2. Market Segmentation
- 1.3. Research Objective
- 1.4. Definitions and Assumptions
- 2. Executive Summary
- 2.1. Market Snapshot
- 3. Market Dynamics
- 3.1. Market Drivers
- 3.2. Market Restrains
- 3.3. Market Trends
- 3.4. Market Opportunities
- 4. Market Factor Analysis
- 4.1. Porters Five Forces
- 4.1.1. Bargaining Power of Suppliers
- 4.1.2. Bargaining Power of Buyers
- 4.1.3. Threat of New Entrants
- 4.1.4. Threat of Substitutes
- 4.1.5. Competitive Rivalry
- 4.2. PESTEL analysis
- 4.3. BCG Analysis
- 4.3.1. Stars (High Growth, High Market Share)
- 4.3.2. Cash Cows (Low Growth, High Market Share)
- 4.3.3. Question Mark (High Growth, Low Market Share)
- 4.3.4. Dogs (Low Growth, Low Market Share)
- 4.4. Ansoff Matrix Analysis
- 4.5. Supply Chain Analysis
- 4.6. Regulatory Landscape
- 4.7. Current Market Potential and Opportunity Assessment (TAM–SAM–SOM Framework)
- 4.8. MSR Analyst Note
- 4.1. Porters Five Forces
- 5. Market Analysis, Insights and Forecast 2021-2033
- 5.1. Market Analysis, Insights and Forecast - by Product Type
- 5.1.1. Facial Make-up Products
- 5.1.2. Eye Make-up Products
- 5.1.3. Lip Make-up Products
- 5.1.4. Nail Make-up Products
- 5.2. Market Analysis, Insights and Forecast - by Category
- 5.2.1. Mass
- 5.2.2. Premium
- 5.3. Market Analysis, Insights and Forecast - by Distribution Channel
- 5.3.1. Hypermarkets/Supermarkets
- 5.3.2. Specialty Stores
- 5.3.3. Online Retail Stores
- 5.3.4. Pharmacies and Drug Stores
- 5.3.5. Other Distribution Channels
- 5.4. Market Analysis, Insights and Forecast - by Region
- 5.4.1. North America
- 5.4.2. Europe
- 5.4.3. Asia Pacific
- 5.4.4. South America
- 5.4.5. Middle East
- 5.4.6. United Arab Emirates
- 5.1. Market Analysis, Insights and Forecast - by Product Type
- 6. Global Cosmetic Products Market Analysis, Insights and Forecast, 2021-2033
- 6.1. Market Analysis, Insights and Forecast - by Product Type
- 6.1.1. Facial Make-up Products
- 6.1.2. Eye Make-up Products
- 6.1.3. Lip Make-up Products
- 6.1.4. Nail Make-up Products
- 6.2. Market Analysis, Insights and Forecast - by Category
- 6.2.1. Mass
- 6.2.2. Premium
- 6.3. Market Analysis, Insights and Forecast - by Distribution Channel
- 6.3.1. Hypermarkets/Supermarkets
- 6.3.2. Specialty Stores
- 6.3.3. Online Retail Stores
- 6.3.4. Pharmacies and Drug Stores
- 6.3.5. Other Distribution Channels
- 6.1. Market Analysis, Insights and Forecast - by Product Type
- 7. North America Cosmetic Products Market Analysis, Insights and Forecast, 2020-2032
- 7.1. Market Analysis, Insights and Forecast - by Product Type
- 7.1.1. Facial Make-up Products
- 7.1.2. Eye Make-up Products
- 7.1.3. Lip Make-up Products
- 7.1.4. Nail Make-up Products
- 7.2. Market Analysis, Insights and Forecast - by Category
- 7.2.1. Mass
- 7.2.2. Premium
- 7.3. Market Analysis, Insights and Forecast - by Distribution Channel
- 7.3.1. Hypermarkets/Supermarkets
- 7.3.2. Specialty Stores
- 7.3.3. Online Retail Stores
- 7.3.4. Pharmacies and Drug Stores
- 7.3.5. Other Distribution Channels
- 7.1. Market Analysis, Insights and Forecast - by Product Type
- 8. Europe Cosmetic Products Market Analysis, Insights and Forecast, 2020-2032
- 8.1. Market Analysis, Insights and Forecast - by Product Type
- 8.1.1. Facial Make-up Products
- 8.1.2. Eye Make-up Products
- 8.1.3. Lip Make-up Products
- 8.1.4. Nail Make-up Products
- 8.2. Market Analysis, Insights and Forecast - by Category
- 8.2.1. Mass
- 8.2.2. Premium
- 8.3. Market Analysis, Insights and Forecast - by Distribution Channel
- 8.3.1. Hypermarkets/Supermarkets
- 8.3.2. Specialty Stores
- 8.3.3. Online Retail Stores
- 8.3.4. Pharmacies and Drug Stores
- 8.3.5. Other Distribution Channels
- 8.1. Market Analysis, Insights and Forecast - by Product Type
- 9. Asia Pacific Cosmetic Products Market Analysis, Insights and Forecast, 2020-2032
- 9.1. Market Analysis, Insights and Forecast - by Product Type
- 9.1.1. Facial Make-up Products
- 9.1.2. Eye Make-up Products
- 9.1.3. Lip Make-up Products
- 9.1.4. Nail Make-up Products
- 9.2. Market Analysis, Insights and Forecast - by Category
- 9.2.1. Mass
- 9.2.2. Premium
- 9.3. Market Analysis, Insights and Forecast - by Distribution Channel
- 9.3.1. Hypermarkets/Supermarkets
- 9.3.2. Specialty Stores
- 9.3.3. Online Retail Stores
- 9.3.4. Pharmacies and Drug Stores
- 9.3.5. Other Distribution Channels
- 9.1. Market Analysis, Insights and Forecast - by Product Type
- 10. South America Cosmetic Products Market Analysis, Insights and Forecast, 2020-2032
- 10.1. Market Analysis, Insights and Forecast - by Product Type
- 10.1.1. Facial Make-up Products
- 10.1.2. Eye Make-up Products
- 10.1.3. Lip Make-up Products
- 10.1.4. Nail Make-up Products
- 10.2. Market Analysis, Insights and Forecast - by Category
- 10.2.1. Mass
- 10.2.2. Premium
- 10.3. Market Analysis, Insights and Forecast - by Distribution Channel
- 10.3.1. Hypermarkets/Supermarkets
- 10.3.2. Specialty Stores
- 10.3.3. Online Retail Stores
- 10.3.4. Pharmacies and Drug Stores
- 10.3.5. Other Distribution Channels
- 10.1. Market Analysis, Insights and Forecast - by Product Type
- 11. Middle East Cosmetic Products Market Analysis, Insights and Forecast, 2020-2032
- 11.1. Market Analysis, Insights and Forecast - by Product Type
- 11.1.1. Facial Make-up Products
- 11.1.2. Eye Make-up Products
- 11.1.3. Lip Make-up Products
- 11.1.4. Nail Make-up Products
- 11.2. Market Analysis, Insights and Forecast - by Category
- 11.2.1. Mass
- 11.2.2. Premium
- 11.3. Market Analysis, Insights and Forecast - by Distribution Channel
- 11.3.1. Hypermarkets/Supermarkets
- 11.3.2. Specialty Stores
- 11.3.3. Online Retail Stores
- 11.3.4. Pharmacies and Drug Stores
- 11.3.5. Other Distribution Channels
- 11.1. Market Analysis, Insights and Forecast - by Product Type
- 12. United Arab Emirates Cosmetic Products Market Analysis, Insights and Forecast, 2020-2032
- 12.1. Market Analysis, Insights and Forecast - by Product Type
- 12.1.1. Facial Make-up Products
- 12.1.2. Eye Make-up Products
- 12.1.3. Lip Make-up Products
- 12.1.4. Nail Make-up Products
- 12.2. Market Analysis, Insights and Forecast - by Category
- 12.2.1. Mass
- 12.2.2. Premium
- 12.3. Market Analysis, Insights and Forecast - by Distribution Channel
- 12.3.1. Hypermarkets/Supermarkets
- 12.3.2. Specialty Stores
- 12.3.3. Online Retail Stores
- 12.3.4. Pharmacies and Drug Stores
- 12.3.5. Other Distribution Channels
- 12.1. Market Analysis, Insights and Forecast - by Product Type
- 13. Competitive Analysis
- 13.1. Company Profiles
- 13.1.1 The Estée Lauder Companies Inc
- 13.1.1.1. Company Overview
- 13.1.1.2. Products
- 13.1.1.3. Company Financials
- 13.1.1.4. SWOT Analysis
- 13.1.2 Oriflame Holding AG
- 13.1.2.1. Company Overview
- 13.1.2.2. Products
- 13.1.2.3. Company Financials
- 13.1.2.4. SWOT Analysis
- 13.1.3 Shiseido Company Limited
- 13.1.3.1. Company Overview
- 13.1.3.2. Products
- 13.1.3.3. Company Financials
- 13.1.3.4. SWOT Analysis
- 13.1.4 Huda Beauty
- 13.1.4.1. Company Overview
- 13.1.4.2. Products
- 13.1.4.3. Company Financials
- 13.1.4.4. SWOT Analysis
- 13.1.5 Puig *List Not Exhaustive
- 13.1.5.1. Company Overview
- 13.1.5.2. Products
- 13.1.5.3. Company Financials
- 13.1.5.4. SWOT Analysis
- 13.1.6 L'Oréal S A
- 13.1.6.1. Company Overview
- 13.1.6.2. Products
- 13.1.6.3. Company Financials
- 13.1.6.4. SWOT Analysis
- 13.1.7 Revlon Inc
- 13.1.7.1. Company Overview
- 13.1.7.2. Products
- 13.1.7.3. Company Financials
- 13.1.7.4. SWOT Analysis
- 13.1.8 Natura & Co
- 13.1.8.1. Company Overview
- 13.1.8.2. Products
- 13.1.8.3. Company Financials
- 13.1.8.4. SWOT Analysis
- 13.1.9 LVMH Moët Hennessy Louis Vuitton
- 13.1.9.1. Company Overview
- 13.1.9.2. Products
- 13.1.9.3. Company Financials
- 13.1.9.4. SWOT Analysis
- 13.1.10 JAB Cosmetics B V (Coty Inc )
- 13.1.10.1. Company Overview
- 13.1.10.2. Products
- 13.1.10.3. Company Financials
- 13.1.10.4. SWOT Analysis
- 13.1.1 The Estée Lauder Companies Inc
- 13.2. Market Entropy
- 13.2.1 Company's Key Areas Served
- 13.2.2 Recent Developments
- 13.3. Company Market Share Analysis 2025
- 13.3.1 Top 5 Companies Market Share Analysis
- 13.3.2 Top 3 Companies Market Share Analysis
- 13.4. List of Potential Customers
- 14. Research Methodology
List of Figures
- Figure 1: Global Cosmetic Products Market Revenue Breakdown (billion, %) by Region 2025 & 2033
- Figure 2: North America Cosmetic Products Market Revenue (billion), by Product Type 2025 & 2033
- Figure 3: North America Cosmetic Products Market Revenue Share (%), by Product Type 2025 & 2033
- Figure 4: North America Cosmetic Products Market Revenue (billion), by Category 2025 & 2033
- Figure 5: North America Cosmetic Products Market Revenue Share (%), by Category 2025 & 2033
- Figure 6: North America Cosmetic Products Market Revenue (billion), by Distribution Channel 2025 & 2033
- Figure 7: North America Cosmetic Products Market Revenue Share (%), by Distribution Channel 2025 & 2033
- Figure 8: North America Cosmetic Products Market Revenue (billion), by Country 2025 & 2033
- Figure 9: North America Cosmetic Products Market Revenue Share (%), by Country 2025 & 2033
- Figure 10: Europe Cosmetic Products Market Revenue (billion), by Product Type 2025 & 2033
- Figure 11: Europe Cosmetic Products Market Revenue Share (%), by Product Type 2025 & 2033
- Figure 12: Europe Cosmetic Products Market Revenue (billion), by Category 2025 & 2033
- Figure 13: Europe Cosmetic Products Market Revenue Share (%), by Category 2025 & 2033
- Figure 14: Europe Cosmetic Products Market Revenue (billion), by Distribution Channel 2025 & 2033
- Figure 15: Europe Cosmetic Products Market Revenue Share (%), by Distribution Channel 2025 & 2033
- Figure 16: Europe Cosmetic Products Market Revenue (billion), by Country 2025 & 2033
- Figure 17: Europe Cosmetic Products Market Revenue Share (%), by Country 2025 & 2033
- Figure 18: Asia Pacific Cosmetic Products Market Revenue (billion), by Product Type 2025 & 2033
- Figure 19: Asia Pacific Cosmetic Products Market Revenue Share (%), by Product Type 2025 & 2033
- Figure 20: Asia Pacific Cosmetic Products Market Revenue (billion), by Category 2025 & 2033
- Figure 21: Asia Pacific Cosmetic Products Market Revenue Share (%), by Category 2025 & 2033
- Figure 22: Asia Pacific Cosmetic Products Market Revenue (billion), by Distribution Channel 2025 & 2033
- Figure 23: Asia Pacific Cosmetic Products Market Revenue Share (%), by Distribution Channel 2025 & 2033
- Figure 24: Asia Pacific Cosmetic Products Market Revenue (billion), by Country 2025 & 2033
- Figure 25: Asia Pacific Cosmetic Products Market Revenue Share (%), by Country 2025 & 2033
- Figure 26: South America Cosmetic Products Market Revenue (billion), by Product Type 2025 & 2033
- Figure 27: South America Cosmetic Products Market Revenue Share (%), by Product Type 2025 & 2033
- Figure 28: South America Cosmetic Products Market Revenue (billion), by Category 2025 & 2033
- Figure 29: South America Cosmetic Products Market Revenue Share (%), by Category 2025 & 2033
- Figure 30: South America Cosmetic Products Market Revenue (billion), by Distribution Channel 2025 & 2033
- Figure 31: South America Cosmetic Products Market Revenue Share (%), by Distribution Channel 2025 & 2033
- Figure 32: South America Cosmetic Products Market Revenue (billion), by Country 2025 & 2033
- Figure 33: South America Cosmetic Products Market Revenue Share (%), by Country 2025 & 2033
- Figure 34: Middle East Cosmetic Products Market Revenue (billion), by Product Type 2025 & 2033
- Figure 35: Middle East Cosmetic Products Market Revenue Share (%), by Product Type 2025 & 2033
- Figure 36: Middle East Cosmetic Products Market Revenue (billion), by Category 2025 & 2033
- Figure 37: Middle East Cosmetic Products Market Revenue Share (%), by Category 2025 & 2033
- Figure 38: Middle East Cosmetic Products Market Revenue (billion), by Distribution Channel 2025 & 2033
- Figure 39: Middle East Cosmetic Products Market Revenue Share (%), by Distribution Channel 2025 & 2033
- Figure 40: Middle East Cosmetic Products Market Revenue (billion), by Country 2025 & 2033
- Figure 41: Middle East Cosmetic Products Market Revenue Share (%), by Country 2025 & 2033
- Figure 42: United Arab Emirates Cosmetic Products Market Revenue (billion), by Product Type 2025 & 2033
- Figure 43: United Arab Emirates Cosmetic Products Market Revenue Share (%), by Product Type 2025 & 2033
- Figure 44: United Arab Emirates Cosmetic Products Market Revenue (billion), by Category 2025 & 2033
- Figure 45: United Arab Emirates Cosmetic Products Market Revenue Share (%), by Category 2025 & 2033
- Figure 46: United Arab Emirates Cosmetic Products Market Revenue (billion), by Distribution Channel 2025 & 2033
- Figure 47: United Arab Emirates Cosmetic Products Market Revenue Share (%), by Distribution Channel 2025 & 2033
- Figure 48: United Arab Emirates Cosmetic Products Market Revenue (billion), by Country 2025 & 2033
- Figure 49: United Arab Emirates Cosmetic Products Market Revenue Share (%), by Country 2025 & 2033
List of Tables
- Table 1: Global Cosmetic Products Market Revenue billion Forecast, by Product Type 2020 & 2033
- Table 2: Global Cosmetic Products Market Revenue billion Forecast, by Category 2020 & 2033
- Table 3: Global Cosmetic Products Market Revenue billion Forecast, by Distribution Channel 2020 & 2033
- Table 4: Global Cosmetic Products Market Revenue billion Forecast, by Region 2020 & 2033
- Table 5: Global Cosmetic Products Market Revenue billion Forecast, by Product Type 2020 & 2033
- Table 6: Global Cosmetic Products Market Revenue billion Forecast, by Category 2020 & 2033
- Table 7: Global Cosmetic Products Market Revenue billion Forecast, by Distribution Channel 2020 & 2033
- Table 8: Global Cosmetic Products Market Revenue billion Forecast, by Country 2020 & 2033
- Table 9: United States Cosmetic Products Market Revenue (billion) Forecast, by Application 2020 & 2033
- Table 10: Canada Cosmetic Products Market Revenue (billion) Forecast, by Application 2020 & 2033
- Table 11: Mexico Cosmetic Products Market Revenue (billion) Forecast, by Application 2020 & 2033
- Table 12: Rest of North America Cosmetic Products Market Revenue (billion) Forecast, by Application 2020 & 2033
- Table 13: Global Cosmetic Products Market Revenue billion Forecast, by Product Type 2020 & 2033
- Table 14: Global Cosmetic Products Market Revenue billion Forecast, by Category 2020 & 2033
- Table 15: Global Cosmetic Products Market Revenue billion Forecast, by Distribution Channel 2020 & 2033
- Table 16: Global Cosmetic Products Market Revenue billion Forecast, by Country 2020 & 2033
- Table 17: United Kingdom Cosmetic Products Market Revenue (billion) Forecast, by Application 2020 & 2033
- Table 18: Germany Cosmetic Products Market Revenue (billion) Forecast, by Application 2020 & 2033
- Table 19: Spain Cosmetic Products Market Revenue (billion) Forecast, by Application 2020 & 2033
- Table 20: France Cosmetic Products Market Revenue (billion) Forecast, by Application 2020 & 2033
- Table 21: Italy Cosmetic Products Market Revenue (billion) Forecast, by Application 2020 & 2033
- Table 22: Russia Cosmetic Products Market Revenue (billion) Forecast, by Application 2020 & 2033
- Table 23: Rest of Europe Cosmetic Products Market Revenue (billion) Forecast, by Application 2020 & 2033
- Table 24: Global Cosmetic Products Market Revenue billion Forecast, by Product Type 2020 & 2033
- Table 25: Global Cosmetic Products Market Revenue billion Forecast, by Category 2020 & 2033
- Table 26: Global Cosmetic Products Market Revenue billion Forecast, by Distribution Channel 2020 & 2033
- Table 27: Global Cosmetic Products Market Revenue billion Forecast, by Country 2020 & 2033
- Table 28: China Cosmetic Products Market Revenue (billion) Forecast, by Application 2020 & 2033
- Table 29: Japan Cosmetic Products Market Revenue (billion) Forecast, by Application 2020 & 2033
- Table 30: India Cosmetic Products Market Revenue (billion) Forecast, by Application 2020 & 2033
- Table 31: Australia Cosmetic Products Market Revenue (billion) Forecast, by Application 2020 & 2033
- Table 32: Rest of Asia Pacific Cosmetic Products Market Revenue (billion) Forecast, by Application 2020 & 2033
- Table 33: Global Cosmetic Products Market Revenue billion Forecast, by Product Type 2020 & 2033
- Table 34: Global Cosmetic Products Market Revenue billion Forecast, by Category 2020 & 2033
- Table 35: Global Cosmetic Products Market Revenue billion Forecast, by Distribution Channel 2020 & 2033
- Table 36: Global Cosmetic Products Market Revenue billion Forecast, by Country 2020 & 2033
- Table 37: Brazil Cosmetic Products Market Revenue (billion) Forecast, by Application 2020 & 2033
- Table 38: Argentina Cosmetic Products Market Revenue (billion) Forecast, by Application 2020 & 2033
- Table 39: Rest of South America Cosmetic Products Market Revenue (billion) Forecast, by Application 2020 & 2033
- Table 40: Global Cosmetic Products Market Revenue billion Forecast, by Product Type 2020 & 2033
- Table 41: Global Cosmetic Products Market Revenue billion Forecast, by Category 2020 & 2033
- Table 42: Global Cosmetic Products Market Revenue billion Forecast, by Distribution Channel 2020 & 2033
- Table 43: Global Cosmetic Products Market Revenue billion Forecast, by Country 2020 & 2033
- Table 44: Global Cosmetic Products Market Revenue billion Forecast, by Product Type 2020 & 2033
- Table 45: Global Cosmetic Products Market Revenue billion Forecast, by Category 2020 & 2033
- Table 46: Global Cosmetic Products Market Revenue billion Forecast, by Distribution Channel 2020 & 2033
- Table 47: Global Cosmetic Products Market Revenue billion Forecast, by Country 2020 & 2033
- Table 48: South Africa Cosmetic Products Market Revenue (billion) Forecast, by Application 2020 & 2033
- Table 49: Rest of Middle East Cosmetic Products Market Revenue (billion) Forecast, by Application 2020 & 2033
Frequently Asked Questions
1. What is the projected Compound Annual Growth Rate (CAGR) of the Cosmetic Products Market?
The projected CAGR is approximately 6.01%.
2. Which companies are prominent players in the Cosmetic Products Market?
Key companies in the market include The Estée Lauder Companies Inc, Oriflame Holding AG, Shiseido Company Limited, Huda Beauty, Puig *List Not Exhaustive, L'Oréal S A, Revlon Inc, Natura & Co, LVMH Moët Hennessy Louis Vuitton, JAB Cosmetics B V (Coty Inc ).
3. What are the main segments of the Cosmetic Products Market?
The market segments include Product Type, Category, Distribution Channel.
4. Can you provide details about the market size?
The market size is estimated to be USD 67.54 billion as of 2022.
5. What are some drivers contributing to market growth?
Sustainable Fashion Trend; Strategic Expansion With Respect To E-commerce Subscription.
6. What are the notable trends driving market growth?
Inclination Toward Organic. Vegan and Cruelty-Free Cosmetic Products.
7. Are there any restraints impacting market growth?
High Cost of Rented Apparel Maintenance.
8. Can you provide examples of recent developments in the market?
May 2022: Estée Lauder with Shoppers Stop opened an exclusive SS Beauty store in Mumbai. With this establishment, the two companies have strengthened their partnership in India. The SS beauty store will offer only Estée Lauder brands like MAC Cosmetics, Clinique, Bobbi Brown, Jo Malone, Estee Lauder, Smashbox, and Tom Ford.
9. What pricing options are available for accessing the report?
Pricing options include single-user, multi-user, and enterprise licenses priced at USD 4750, USD 5250, and USD 8750 respectively.
10. Is the market size provided in terms of value or volume?
The market size is provided in terms of value, measured in billion.
11. Are there any specific market keywords associated with the report?
Yes, the market keyword associated with the report is "Cosmetic Products Market," which aids in identifying and referencing the specific market segment covered.
12. How do I determine which pricing option suits my needs best?
The pricing options vary based on user requirements and access needs. Individual users may opt for single-user licenses, while businesses requiring broader access may choose multi-user or enterprise licenses for cost-effective access to the report.
13. Are there any additional resources or data provided in the Cosmetic Products Market report?
While the report offers comprehensive insights, it's advisable to review the specific contents or supplementary materials provided to ascertain if additional resources or data are available.
14. How can I stay updated on further developments or reports in the Cosmetic Products Market?
To stay informed about further developments, trends, and reports in the Cosmetic Products Market, consider subscribing to industry newsletters, following relevant companies and organizations, or regularly checking reputable industry news sources and publications.
Methodology
Step 1 - Identification of Relevant Samples Size from Population Database


Step 2 - Approaches for Defining Global Market Size (Value, Volume* & Price*)

Note*: In applicable scenarios
Step 3 - Data Sources
Primary Research
- Web Analytics
- Survey Reports
- Research Institute
- Latest Research Reports
- Opinion Leaders
Secondary Research
- Annual Reports
- White Paper
- Latest Press Release
- Industry Association
- Paid Database
- Investor Presentations

Step 4 - Data Triangulation
Involves using different sources of information in order to increase the validity of a study
These sources are likely to be stakeholders in a program - participants, other researchers, program staff, other community members, and so on.
Then we put all data in single framework & apply various statistical tools to find out the dynamic on the market.
During the analysis stage, feedback from the stakeholder groups would be compared to determine areas of agreement as well as areas of divergence