

Key Insights
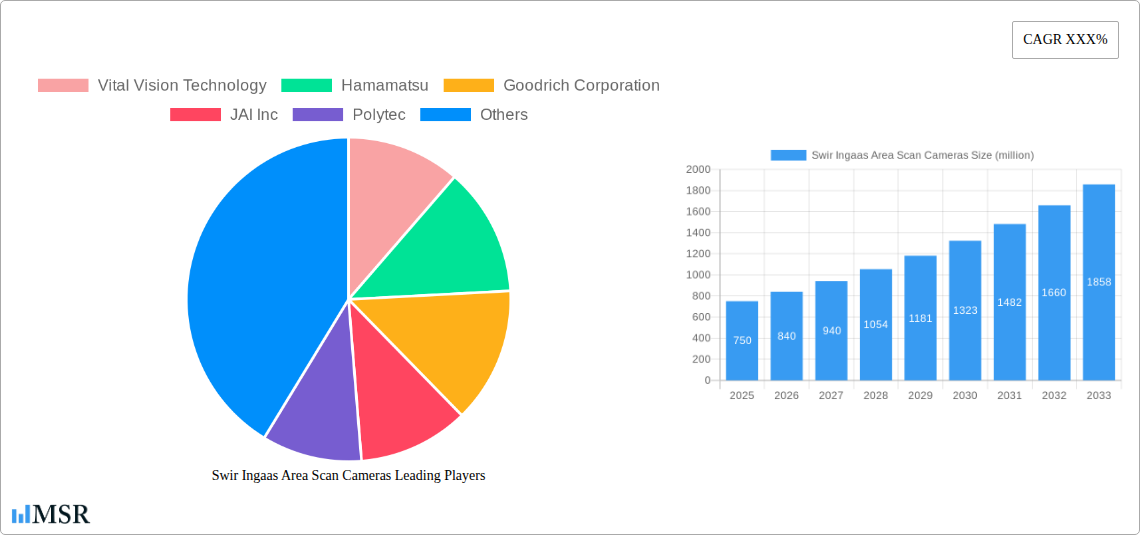
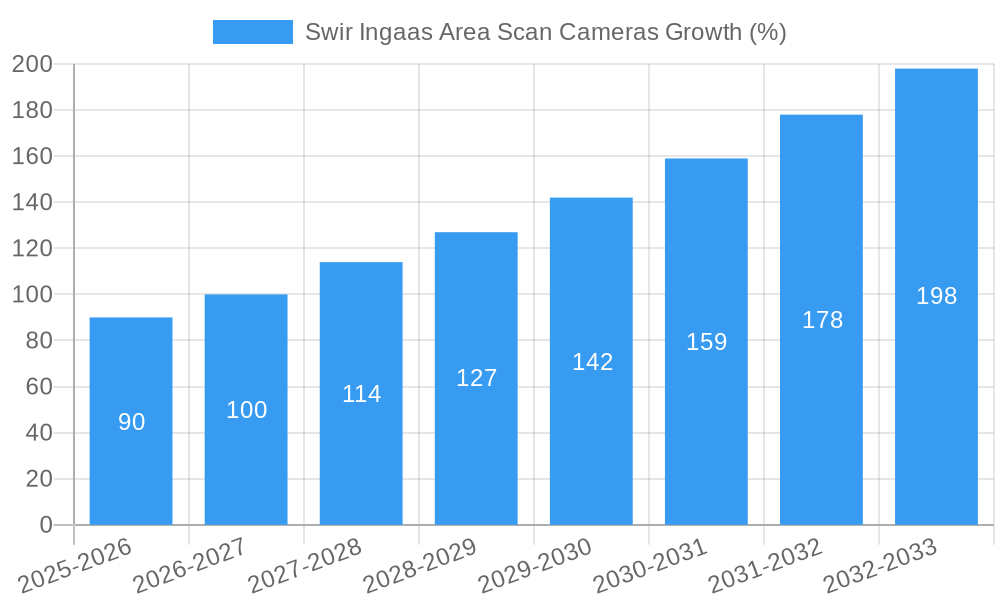
The SWIR InGaAs area scan camera market is experiencing robust growth, driven by increasing demand across diverse sectors. Advancements in InGaAs sensor technology, offering superior sensitivity and resolution in the short-wave infrared (SWIR) spectrum, are a primary catalyst. Applications leveraging SWIR imaging, such as precision agriculture (crop health monitoring), industrial automation (defect detection), and medical diagnostics (non-invasive imaging), are fueling market expansion. The market is further propelled by the miniaturization of cameras, making them more adaptable and cost-effective for integration into various systems. While initial high costs of InGaAs sensors posed a restraint, ongoing technological advancements and economies of scale are gradually mitigating this challenge. We estimate the market size to be approximately $750 million in 2025, with a Compound Annual Growth Rate (CAGR) of 12% projected through 2033. This growth is expected to be driven by strong adoption in the aforementioned key application areas and an increasing demand for high-quality imaging solutions in various industries.
Segmentation analysis reveals a substantial contribution from industrial automation, driven by the need for real-time, non-contact inspection and quality control. The medical sector presents significant growth potential, as SWIR imaging finds increasing utility in advanced diagnostic procedures. Furthermore, the geographical distribution shows strong performance in North America and Europe, due to advanced technology adoption and robust research & development activities. However, emerging economies in Asia-Pacific are poised for significant growth, fueled by rising industrialization and government investments in advanced technologies. Companies like FLIR Systems, Teledyne Technologies, and Hamamatsu Photonics are key players, strategically positioning themselves through technological innovations, strategic partnerships, and market expansions. The competitive landscape remains dynamic, with ongoing innovation impacting pricing strategies and driving improvements in resolution, sensitivity, and functionality.
Unlock Growth Potential: The Comprehensive SwIR InGaAs Area Scan Cameras Market Report (2019-2033)
This in-depth report provides a comprehensive analysis of the global SwIR InGaAs Area Scan Cameras market, offering actionable insights for industry stakeholders, investors, and strategic decision-makers. Covering the period from 2019 to 2033, with a focus on 2025, this report unveils market dynamics, technological advancements, and key players shaping the future of this rapidly evolving sector. The study period is 2019-2033, with 2025 as the base and estimated year, and 2025-2033 as the forecast period. The historical period covers 2019-2024. The report's value lies in its detailed examination of market concentration, leading companies, emerging trends, and opportunities for significant growth.
SwIR InGaAs Area Scan Cameras Market Concentration & Dynamics
The SwIR InGaAs Area Scan Cameras market exhibits a moderately concentrated landscape, with a few major players holding significant market share. While precise figures are proprietary to the full report, we estimate that the top five companies control approximately xx% of the market in 2025. This concentration is influenced by factors such as high barriers to entry (significant R&D investment and specialized manufacturing capabilities), strong brand recognition, and established distribution networks.
- Market Share: The top three players collectively hold an estimated xx% market share in 2025.
- Innovation Ecosystems: Collaboration between universities, research institutions, and industry players fuels innovation.
- Regulatory Frameworks: Government regulations concerning data privacy and safety standards influence market growth. xx million in government funding is expected to support the sector by 2033.
- Substitute Products: Competition comes from alternative imaging technologies, but the unique advantages of SwIR InGaAs sensors (higher sensitivity, better spectral range) limit the impact.
- End-User Trends: Increasing demand from diverse sectors, including defense, medical, and industrial automation, drives market expansion.
- M&A Activities: An estimated xx M&A deals were recorded in the historical period (2019-2024). Consolidation is expected to continue, driving further market concentration.
SwIR InGaAs Area Scan Cameras Industry Insights & Trends
The global SwIR InGaAs Area Scan Cameras market is experiencing robust growth, driven by technological advancements, increasing demand across various applications, and favorable government regulations. The market size is projected to reach xx million by 2025, exhibiting a CAGR of xx% during the forecast period (2025-2033). Key drivers include the rising adoption of automation in industrial settings, growing demand for high-resolution imaging in defense applications, and the increasing use of advanced spectral imaging in medical diagnostics. Technological disruptions, such as the development of more sensitive and compact sensors, will continue to propel market growth. The ongoing development of AI-driven image processing techniques further enhances the capabilities and market appeal of these cameras. Consumer behavior is shifting towards higher quality and more versatile imaging solutions, creating opportunities for manufacturers to innovate and cater to specialized needs.
Key Markets & Segments Leading SwIR InGaAs Area Scan Cameras
The North American region currently dominates the SwIR InGaAs Area Scan Cameras market, representing an estimated xx% of the global market share in 2025. This dominance is attributed to several key factors:
Drivers for North American Dominance:
- Strong presence of key players and robust R&D investments.
- High adoption rates in defense and aerospace sectors.
- Significant government funding for advanced imaging technologies.
- Well-established infrastructure for technology adoption and deployment.
Detailed Dominance Analysis: The region's advanced technological capabilities and substantial investment in defense and aerospace applications propel the demand for high-performance SwIR InGaAs area scan cameras. The strong presence of major companies in the region also contributes to its market leadership. However, the Asia-Pacific region is expected to witness the fastest growth rate during the forecast period due to increasing industrialization and investment in advanced technologies.
SwIR InGaAs Area Scan Cameras Product Developments
Significant advancements in sensor technology, including improved sensitivity, resolution, and reduced size and cost, are driving product innovation in the SwIR InGaAs Area Scan Cameras market. New applications are continuously emerging, particularly in areas such as hyperspectral imaging, food safety inspection, and advanced driver-assistance systems (ADAS). These developments enhance the competitive edge of manufacturers by catering to the evolving demands of diverse industries. The integration of AI-powered features, like real-time object recognition and analysis, further expands the functionality and applications of these cameras.
Challenges in the SwIR InGaAs Area Scan Cameras Market
The SwIR InGaAs Area Scan Cameras market faces challenges such as high manufacturing costs, complex supply chains vulnerable to disruptions, and intense competition from established players. Regulatory compliance costs also present a hurdle, impacting profitability. These challenges, if not effectively managed, could impede market growth. The xx million loss suffered by the industry in 2024 due to supply chain issues highlights the risks involved.
Forces Driving SwIR InGaAs Area Scan Cameras Growth
Several factors are fueling the growth of the SwIR InGaAs Area Scan Cameras market. Firstly, the increasing demand for precise and high-speed imaging solutions in various industries (automotive, defense, medical) fuels innovation and adoption. Secondly, technological advancements, particularly in sensor technology and image processing, enhance the capabilities and affordability of these cameras. Finally, government support, through funding and regulations, fosters market development and adoption.
Long-Term Growth Catalysts in the SwIR InGaAs Area Scan Cameras Market
Long-term growth will be driven by continuous innovation in sensor technology, strategic partnerships between manufacturers and end-users, and expansion into new emerging markets. The development of next-generation sensors with improved performance characteristics and lower production costs will be crucial. Strategic collaborations will accelerate the adoption of SwIR imaging in new applications.
Emerging Opportunities in SwIR InGaAs Area Scan Cameras
Emerging opportunities include the development of smaller, more power-efficient cameras for mobile applications, the growing integration of AI and machine learning capabilities for advanced image analysis, and expansion into new sectors like precision agriculture and environmental monitoring. This expansion into new areas will be crucial for continued market growth.
Leading Players in the SwIR InGaAs Area Scan Cameras Sector
- Vital Vision Technology
- Hamamatsu
- Goodrich Corporation
- JAI Inc
- Polytec
- Princeton Infrared Technologies Inc
- Photonic Science Engineering Limited
- XenICs
- FLIR Systems
- Teledyne Technologies International Corp
- Shanxi Guohui Optoelectronic Technology Co Ltd
Key Milestones in SwIR InGaAs Area Scan Cameras Industry
- 2020: Significant advancements in sensor technology lead to higher resolution and sensitivity in SwIR cameras.
- 2022: Introduction of AI-powered image analysis capabilities improves the efficiency and accuracy of applications.
- 2023: Several key players announce strategic partnerships to expand market reach and develop new applications.
- 2024: xx million investment in R&D from leading players accelerates innovation.
- 2025: Anticipated launch of xx new SwIR camera models with enhanced features.
Strategic Outlook for SwIR InGaAs Area Scan Cameras Market
The future of the SwIR InGaAs Area Scan Cameras market is bright. Continuous technological advancements, coupled with rising demand from various industries, promise strong growth. Strategic partnerships, expansion into new applications, and a focus on cost reduction will be crucial for manufacturers to capitalize on emerging opportunities. The market's growth potential is significant, driven by increasing demand for advanced imaging solutions across diverse sectors.
Swir Ingaas Area Scan Cameras Segmentation
-
1. Application
- 1.1. Industrial Manufacturing
- 1.2. Aerospace
- 1.3. National Defense
- 1.4. Scientific Research
- 1.5. Life Sciences
-
2. Type
- 2.1. Non-cooled
- 2.2. Cooled
Swir Ingaas Area Scan Cameras Segmentation By Geography
-
1. North America
- 1.1. United States
- 1.2. Canada
- 1.3. Mexico
-
2. South America
- 2.1. Brazil
- 2.2. Argentina
- 2.3. Rest of South America
-
3. Europe
- 3.1. United Kingdom
- 3.2. Germany
- 3.3. France
- 3.4. Italy
- 3.5. Spain
- 3.6. Russia
- 3.7. Benelux
- 3.8. Nordics
- 3.9. Rest of Europe
-
4. Middle East & Africa
- 4.1. Turkey
- 4.2. Israel
- 4.3. GCC
- 4.4. North Africa
- 4.5. South Africa
- 4.6. Rest of Middle East & Africa
-
5. Asia Pacific
- 5.1. China
- 5.2. India
- 5.3. Japan
- 5.4. South Korea
- 5.5. ASEAN
- 5.6. Oceania
- 5.7. Rest of Asia Pacific

Swir Ingaas Area Scan Cameras REPORT HIGHLIGHTS
| Aspects | Details |
|---|---|
| Study Period | 2019-2033 |
| Base Year | 2024 |
| Estimated Year | 2025 |
| Forecast Period | 2025-2033 |
| Historical Period | 2019-2024 |
| Growth Rate | CAGR of XXX% from 2019-2033 |
| Segmentation |
|
Table of Contents
- 1. Introduction
- 1.1. Research Scope
- 1.2. Market Segmentation
- 1.3. Research Methodology
- 1.4. Definitions and Assumptions
- 2. Executive Summary
- 2.1. Introduction
- 3. Market Dynamics
- 3.1. Introduction
- 3.2. Market Drivers
- 3.3. Market Restrains
- 3.4. Market Trends
- 4. Market Factor Analysis
- 4.1. Porters Five Forces
- 4.2. Supply/Value Chain
- 4.3. PESTEL analysis
- 4.4. Market Entropy
- 4.5. Patent/Trademark Analysis
- 5. Global Swir Ingaas Area Scan Cameras Analysis, Insights and Forecast, 2019-2031
- 5.1. Market Analysis, Insights and Forecast - by Application
- 5.1.1. Industrial Manufacturing
- 5.1.2. Aerospace
- 5.1.3. National Defense
- 5.1.4. Scientific Research
- 5.1.5. Life Sciences
- 5.2. Market Analysis, Insights and Forecast - by Type
- 5.2.1. Non-cooled
- 5.2.2. Cooled
- 5.3. Market Analysis, Insights and Forecast - by Region
- 5.3.1. North America
- 5.3.2. South America
- 5.3.3. Europe
- 5.3.4. Middle East & Africa
- 5.3.5. Asia Pacific
- 5.1. Market Analysis, Insights and Forecast - by Application
- 6. North America Swir Ingaas Area Scan Cameras Analysis, Insights and Forecast, 2019-2031
- 6.1. Market Analysis, Insights and Forecast - by Application
- 6.1.1. Industrial Manufacturing
- 6.1.2. Aerospace
- 6.1.3. National Defense
- 6.1.4. Scientific Research
- 6.1.5. Life Sciences
- 6.2. Market Analysis, Insights and Forecast - by Type
- 6.2.1. Non-cooled
- 6.2.2. Cooled
- 6.1. Market Analysis, Insights and Forecast - by Application
- 7. South America Swir Ingaas Area Scan Cameras Analysis, Insights and Forecast, 2019-2031
- 7.1. Market Analysis, Insights and Forecast - by Application
- 7.1.1. Industrial Manufacturing
- 7.1.2. Aerospace
- 7.1.3. National Defense
- 7.1.4. Scientific Research
- 7.1.5. Life Sciences
- 7.2. Market Analysis, Insights and Forecast - by Type
- 7.2.1. Non-cooled
- 7.2.2. Cooled
- 7.1. Market Analysis, Insights and Forecast - by Application
- 8. Europe Swir Ingaas Area Scan Cameras Analysis, Insights and Forecast, 2019-2031
- 8.1. Market Analysis, Insights and Forecast - by Application
- 8.1.1. Industrial Manufacturing
- 8.1.2. Aerospace
- 8.1.3. National Defense
- 8.1.4. Scientific Research
- 8.1.5. Life Sciences
- 8.2. Market Analysis, Insights and Forecast - by Type
- 8.2.1. Non-cooled
- 8.2.2. Cooled
- 8.1. Market Analysis, Insights and Forecast - by Application
- 9. Middle East & Africa Swir Ingaas Area Scan Cameras Analysis, Insights and Forecast, 2019-2031
- 9.1. Market Analysis, Insights and Forecast - by Application
- 9.1.1. Industrial Manufacturing
- 9.1.2. Aerospace
- 9.1.3. National Defense
- 9.1.4. Scientific Research
- 9.1.5. Life Sciences
- 9.2. Market Analysis, Insights and Forecast - by Type
- 9.2.1. Non-cooled
- 9.2.2. Cooled
- 9.1. Market Analysis, Insights and Forecast - by Application
- 10. Asia Pacific Swir Ingaas Area Scan Cameras Analysis, Insights and Forecast, 2019-2031
- 10.1. Market Analysis, Insights and Forecast - by Application
- 10.1.1. Industrial Manufacturing
- 10.1.2. Aerospace
- 10.1.3. National Defense
- 10.1.4. Scientific Research
- 10.1.5. Life Sciences
- 10.2. Market Analysis, Insights and Forecast - by Type
- 10.2.1. Non-cooled
- 10.2.2. Cooled
- 10.1. Market Analysis, Insights and Forecast - by Application
- 11. Competitive Analysis
- 11.1. Global Market Share Analysis 2024
- 11.2. Company Profiles
- 11.2.1 Vital Vision Technology
- 11.2.1.1. Overview
- 11.2.1.2. Products
- 11.2.1.3. SWOT Analysis
- 11.2.1.4. Recent Developments
- 11.2.1.5. Financials (Based on Availability)
- 11.2.2 Hamamatsu
- 11.2.2.1. Overview
- 11.2.2.2. Products
- 11.2.2.3. SWOT Analysis
- 11.2.2.4. Recent Developments
- 11.2.2.5. Financials (Based on Availability)
- 11.2.3 Goodrich Corporation
- 11.2.3.1. Overview
- 11.2.3.2. Products
- 11.2.3.3. SWOT Analysis
- 11.2.3.4. Recent Developments
- 11.2.3.5. Financials (Based on Availability)
- 11.2.4 JAI Inc
- 11.2.4.1. Overview
- 11.2.4.2. Products
- 11.2.4.3. SWOT Analysis
- 11.2.4.4. Recent Developments
- 11.2.4.5. Financials (Based on Availability)
- 11.2.5 Polytec
- 11.2.5.1. Overview
- 11.2.5.2. Products
- 11.2.5.3. SWOT Analysis
- 11.2.5.4. Recent Developments
- 11.2.5.5. Financials (Based on Availability)
- 11.2.6 Princeton Infrared Technologies Inc
- 11.2.6.1. Overview
- 11.2.6.2. Products
- 11.2.6.3. SWOT Analysis
- 11.2.6.4. Recent Developments
- 11.2.6.5. Financials (Based on Availability)
- 11.2.7 Photonic Science Engineering Limited
- 11.2.7.1. Overview
- 11.2.7.2. Products
- 11.2.7.3. SWOT Analysis
- 11.2.7.4. Recent Developments
- 11.2.7.5. Financials (Based on Availability)
- 11.2.8 XenICs
- 11.2.8.1. Overview
- 11.2.8.2. Products
- 11.2.8.3. SWOT Analysis
- 11.2.8.4. Recent Developments
- 11.2.8.5. Financials (Based on Availability)
- 11.2.9 FLIR Systems
- 11.2.9.1. Overview
- 11.2.9.2. Products
- 11.2.9.3. SWOT Analysis
- 11.2.9.4. Recent Developments
- 11.2.9.5. Financials (Based on Availability)
- 11.2.10 Teledyne Technologies International Corp
- 11.2.10.1. Overview
- 11.2.10.2. Products
- 11.2.10.3. SWOT Analysis
- 11.2.10.4. Recent Developments
- 11.2.10.5. Financials (Based on Availability)
- 11.2.11 Shanxi Guohui Optoelectronic Technology Co Ltd
- 11.2.11.1. Overview
- 11.2.11.2. Products
- 11.2.11.3. SWOT Analysis
- 11.2.11.4. Recent Developments
- 11.2.11.5. Financials (Based on Availability)
- 11.2.1 Vital Vision Technology
List of Figures
- Figure 1: Global Swir Ingaas Area Scan Cameras Revenue Breakdown (million, %) by Region 2024 & 2032
- Figure 2: North America Swir Ingaas Area Scan Cameras Revenue (million), by Application 2024 & 2032
- Figure 3: North America Swir Ingaas Area Scan Cameras Revenue Share (%), by Application 2024 & 2032
- Figure 4: North America Swir Ingaas Area Scan Cameras Revenue (million), by Type 2024 & 2032
- Figure 5: North America Swir Ingaas Area Scan Cameras Revenue Share (%), by Type 2024 & 2032
- Figure 6: North America Swir Ingaas Area Scan Cameras Revenue (million), by Country 2024 & 2032
- Figure 7: North America Swir Ingaas Area Scan Cameras Revenue Share (%), by Country 2024 & 2032
- Figure 8: South America Swir Ingaas Area Scan Cameras Revenue (million), by Application 2024 & 2032
- Figure 9: South America Swir Ingaas Area Scan Cameras Revenue Share (%), by Application 2024 & 2032
- Figure 10: South America Swir Ingaas Area Scan Cameras Revenue (million), by Type 2024 & 2032
- Figure 11: South America Swir Ingaas Area Scan Cameras Revenue Share (%), by Type 2024 & 2032
- Figure 12: South America Swir Ingaas Area Scan Cameras Revenue (million), by Country 2024 & 2032
- Figure 13: South America Swir Ingaas Area Scan Cameras Revenue Share (%), by Country 2024 & 2032
- Figure 14: Europe Swir Ingaas Area Scan Cameras Revenue (million), by Application 2024 & 2032
- Figure 15: Europe Swir Ingaas Area Scan Cameras Revenue Share (%), by Application 2024 & 2032
- Figure 16: Europe Swir Ingaas Area Scan Cameras Revenue (million), by Type 2024 & 2032
- Figure 17: Europe Swir Ingaas Area Scan Cameras Revenue Share (%), by Type 2024 & 2032
- Figure 18: Europe Swir Ingaas Area Scan Cameras Revenue (million), by Country 2024 & 2032
- Figure 19: Europe Swir Ingaas Area Scan Cameras Revenue Share (%), by Country 2024 & 2032
- Figure 20: Middle East & Africa Swir Ingaas Area Scan Cameras Revenue (million), by Application 2024 & 2032
- Figure 21: Middle East & Africa Swir Ingaas Area Scan Cameras Revenue Share (%), by Application 2024 & 2032
- Figure 22: Middle East & Africa Swir Ingaas Area Scan Cameras Revenue (million), by Type 2024 & 2032
- Figure 23: Middle East & Africa Swir Ingaas Area Scan Cameras Revenue Share (%), by Type 2024 & 2032
- Figure 24: Middle East & Africa Swir Ingaas Area Scan Cameras Revenue (million), by Country 2024 & 2032
- Figure 25: Middle East & Africa Swir Ingaas Area Scan Cameras Revenue Share (%), by Country 2024 & 2032
- Figure 26: Asia Pacific Swir Ingaas Area Scan Cameras Revenue (million), by Application 2024 & 2032
- Figure 27: Asia Pacific Swir Ingaas Area Scan Cameras Revenue Share (%), by Application 2024 & 2032
- Figure 28: Asia Pacific Swir Ingaas Area Scan Cameras Revenue (million), by Type 2024 & 2032
- Figure 29: Asia Pacific Swir Ingaas Area Scan Cameras Revenue Share (%), by Type 2024 & 2032
- Figure 30: Asia Pacific Swir Ingaas Area Scan Cameras Revenue (million), by Country 2024 & 2032
- Figure 31: Asia Pacific Swir Ingaas Area Scan Cameras Revenue Share (%), by Country 2024 & 2032
List of Tables
- Table 1: Global Swir Ingaas Area Scan Cameras Revenue million Forecast, by Region 2019 & 2032
- Table 2: Global Swir Ingaas Area Scan Cameras Revenue million Forecast, by Application 2019 & 2032
- Table 3: Global Swir Ingaas Area Scan Cameras Revenue million Forecast, by Type 2019 & 2032
- Table 4: Global Swir Ingaas Area Scan Cameras Revenue million Forecast, by Region 2019 & 2032
- Table 5: Global Swir Ingaas Area Scan Cameras Revenue million Forecast, by Application 2019 & 2032
- Table 6: Global Swir Ingaas Area Scan Cameras Revenue million Forecast, by Type 2019 & 2032
- Table 7: Global Swir Ingaas Area Scan Cameras Revenue million Forecast, by Country 2019 & 2032
- Table 8: United States Swir Ingaas Area Scan Cameras Revenue (million) Forecast, by Application 2019 & 2032
- Table 9: Canada Swir Ingaas Area Scan Cameras Revenue (million) Forecast, by Application 2019 & 2032
- Table 10: Mexico Swir Ingaas Area Scan Cameras Revenue (million) Forecast, by Application 2019 & 2032
- Table 11: Global Swir Ingaas Area Scan Cameras Revenue million Forecast, by Application 2019 & 2032
- Table 12: Global Swir Ingaas Area Scan Cameras Revenue million Forecast, by Type 2019 & 2032
- Table 13: Global Swir Ingaas Area Scan Cameras Revenue million Forecast, by Country 2019 & 2032
- Table 14: Brazil Swir Ingaas Area Scan Cameras Revenue (million) Forecast, by Application 2019 & 2032
- Table 15: Argentina Swir Ingaas Area Scan Cameras Revenue (million) Forecast, by Application 2019 & 2032
- Table 16: Rest of South America Swir Ingaas Area Scan Cameras Revenue (million) Forecast, by Application 2019 & 2032
- Table 17: Global Swir Ingaas Area Scan Cameras Revenue million Forecast, by Application 2019 & 2032
- Table 18: Global Swir Ingaas Area Scan Cameras Revenue million Forecast, by Type 2019 & 2032
- Table 19: Global Swir Ingaas Area Scan Cameras Revenue million Forecast, by Country 2019 & 2032
- Table 20: United Kingdom Swir Ingaas Area Scan Cameras Revenue (million) Forecast, by Application 2019 & 2032
- Table 21: Germany Swir Ingaas Area Scan Cameras Revenue (million) Forecast, by Application 2019 & 2032
- Table 22: France Swir Ingaas Area Scan Cameras Revenue (million) Forecast, by Application 2019 & 2032
- Table 23: Italy Swir Ingaas Area Scan Cameras Revenue (million) Forecast, by Application 2019 & 2032
- Table 24: Spain Swir Ingaas Area Scan Cameras Revenue (million) Forecast, by Application 2019 & 2032
- Table 25: Russia Swir Ingaas Area Scan Cameras Revenue (million) Forecast, by Application 2019 & 2032
- Table 26: Benelux Swir Ingaas Area Scan Cameras Revenue (million) Forecast, by Application 2019 & 2032
- Table 27: Nordics Swir Ingaas Area Scan Cameras Revenue (million) Forecast, by Application 2019 & 2032
- Table 28: Rest of Europe Swir Ingaas Area Scan Cameras Revenue (million) Forecast, by Application 2019 & 2032
- Table 29: Global Swir Ingaas Area Scan Cameras Revenue million Forecast, by Application 2019 & 2032
- Table 30: Global Swir Ingaas Area Scan Cameras Revenue million Forecast, by Type 2019 & 2032
- Table 31: Global Swir Ingaas Area Scan Cameras Revenue million Forecast, by Country 2019 & 2032
- Table 32: Turkey Swir Ingaas Area Scan Cameras Revenue (million) Forecast, by Application 2019 & 2032
- Table 33: Israel Swir Ingaas Area Scan Cameras Revenue (million) Forecast, by Application 2019 & 2032
- Table 34: GCC Swir Ingaas Area Scan Cameras Revenue (million) Forecast, by Application 2019 & 2032
- Table 35: North Africa Swir Ingaas Area Scan Cameras Revenue (million) Forecast, by Application 2019 & 2032
- Table 36: South Africa Swir Ingaas Area Scan Cameras Revenue (million) Forecast, by Application 2019 & 2032
- Table 37: Rest of Middle East & Africa Swir Ingaas Area Scan Cameras Revenue (million) Forecast, by Application 2019 & 2032
- Table 38: Global Swir Ingaas Area Scan Cameras Revenue million Forecast, by Application 2019 & 2032
- Table 39: Global Swir Ingaas Area Scan Cameras Revenue million Forecast, by Type 2019 & 2032
- Table 40: Global Swir Ingaas Area Scan Cameras Revenue million Forecast, by Country 2019 & 2032
- Table 41: China Swir Ingaas Area Scan Cameras Revenue (million) Forecast, by Application 2019 & 2032
- Table 42: India Swir Ingaas Area Scan Cameras Revenue (million) Forecast, by Application 2019 & 2032
- Table 43: Japan Swir Ingaas Area Scan Cameras Revenue (million) Forecast, by Application 2019 & 2032
- Table 44: South Korea Swir Ingaas Area Scan Cameras Revenue (million) Forecast, by Application 2019 & 2032
- Table 45: ASEAN Swir Ingaas Area Scan Cameras Revenue (million) Forecast, by Application 2019 & 2032
- Table 46: Oceania Swir Ingaas Area Scan Cameras Revenue (million) Forecast, by Application 2019 & 2032
- Table 47: Rest of Asia Pacific Swir Ingaas Area Scan Cameras Revenue (million) Forecast, by Application 2019 & 2032
Frequently Asked Questions
1. What is the projected Compound Annual Growth Rate (CAGR) of the Swir Ingaas Area Scan Cameras?
The projected CAGR is approximately XXX%.
2. Which companies are prominent players in the Swir Ingaas Area Scan Cameras?
Key companies in the market include Vital Vision Technology, Hamamatsu, Goodrich Corporation, JAI Inc, Polytec, Princeton Infrared Technologies Inc, Photonic Science Engineering Limited, XenICs, FLIR Systems, Teledyne Technologies International Corp, Shanxi Guohui Optoelectronic Technology Co Ltd.
3. What are the main segments of the Swir Ingaas Area Scan Cameras?
The market segments include Application, Type.
4. Can you provide details about the market size?
The market size is estimated to be USD XXX million as of 2022.
5. What are some drivers contributing to market growth?
N/A
6. What are the notable trends driving market growth?
N/A
7. Are there any restraints impacting market growth?
N/A
8. Can you provide examples of recent developments in the market?
N/A
9. What pricing options are available for accessing the report?
Pricing options include single-user, multi-user, and enterprise licenses priced at USD 4250.00, USD 6375.00, and USD 8500.00 respectively.
10. Is the market size provided in terms of value or volume?
The market size is provided in terms of value, measured in million.
11. Are there any specific market keywords associated with the report?
Yes, the market keyword associated with the report is "Swir Ingaas Area Scan Cameras," which aids in identifying and referencing the specific market segment covered.
12. How do I determine which pricing option suits my needs best?
The pricing options vary based on user requirements and access needs. Individual users may opt for single-user licenses, while businesses requiring broader access may choose multi-user or enterprise licenses for cost-effective access to the report.
13. Are there any additional resources or data provided in the Swir Ingaas Area Scan Cameras report?
While the report offers comprehensive insights, it's advisable to review the specific contents or supplementary materials provided to ascertain if additional resources or data are available.
14. How can I stay updated on further developments or reports in the Swir Ingaas Area Scan Cameras?
To stay informed about further developments, trends, and reports in the Swir Ingaas Area Scan Cameras, consider subscribing to industry newsletters, following relevant companies and organizations, or regularly checking reputable industry news sources and publications.
Methodology
Step 1 - Identification of Relevant Samples Size from Population Database


Step 2 - Approaches for Defining Global Market Size (Value, Volume* & Price*)

Note*: In applicable scenarios
Step 3 - Data Sources
Primary Research
- Web Analytics
- Survey Reports
- Research Institute
- Latest Research Reports
- Opinion Leaders
Secondary Research
- Annual Reports
- White Paper
- Latest Press Release
- Industry Association
- Paid Database
- Investor Presentations

Step 4 - Data Triangulation
Involves using different sources of information in order to increase the validity of a study
These sources are likely to be stakeholders in a program - participants, other researchers, program staff, other community members, and so on.
Then we put all data in single framework & apply various statistical tools to find out the dynamic on the market.
During the analysis stage, feedback from the stakeholder groups would be compared to determine areas of agreement as well as areas of divergence
