
Key Insights
The global smart energy meter market is experiencing robust expansion, propelled by a strong demand for energy efficiency, comprehensive grid modernization efforts, and the rapid integration of renewable energy sources. Projections indicate a Compound Annual Growth Rate (CAGR) of 7.9%. This upward trajectory is further supported by government mandates promoting smart grid infrastructure and the growing imperative for real-time energy consumption monitoring to achieve cost reductions and enhance sustainability. While the residential segment currently dominates, the commercial and industrial sectors are anticipated to witness substantial growth, driven by significant energy saving potentials and optimized energy management strategies. Leading companies such as Itron, Landis+Gyr, and Holley are at the forefront of innovation, delivering advanced metering infrastructure (AMI) solutions featuring enhanced data analytics and remote meter reading capabilities. The competitive landscape is dynamic, featuring both established international corporations and regional manufacturers competing for market share. North America and Asia-Pacific are demonstrating strong growth due to early adoption and extensive infrastructure development. However, significant initial investment costs and data security concerns present challenges to widespread adoption. The future growth trajectory will likely be shaped by the integration of smart meters into broader smart home and smart city ecosystems, unlocking new avenues for value-added services and data monetization.
Smart Energy Meter Industry Market Size (In Billion)
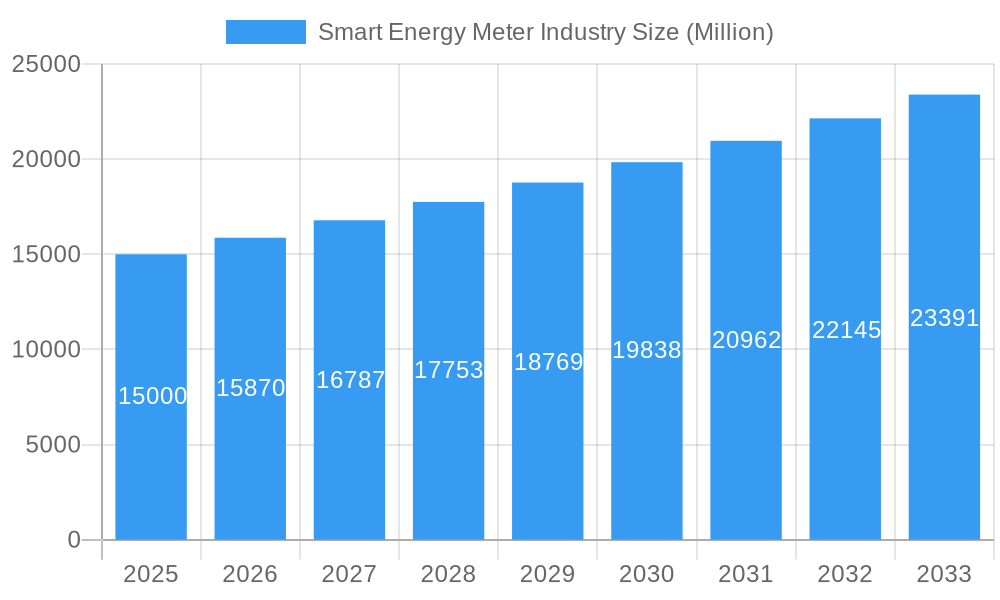
The market is projected to achieve a substantial size by 2033, significantly surpassing the 2025 estimate of 30.92 billion, driven by the anticipated CAGR. This expansion will be further fueled by ongoing technological advancements, including the integration of Artificial Intelligence (AI) and Machine Learning (ML) for predictive maintenance and refined energy forecasting. The increasing adoption of smart grid technologies and the critical need for enhanced grid stability will continue to be major demand drivers. The seamless integration of smart meters with renewable energy sources, such as solar and wind power, will play a pivotal role in market expansion. Addressing challenges like cybersecurity threats and the necessity for robust communication infrastructure is paramount for ensuring the reliable and widespread deployment of smart energy meters. The segmentation by end-user (residential, commercial, industrial) is expected to evolve, with a potential intensification of focus on the industrial sector as businesses prioritize energy consumption optimization and operational cost reduction.
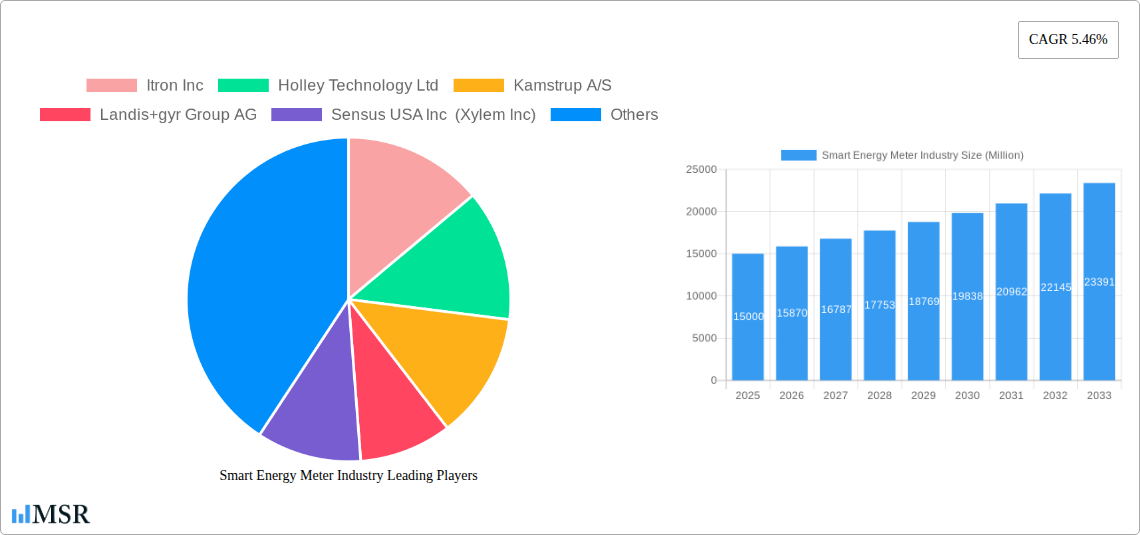
Smart Energy Meter Industry Company Market Share
Smart Energy Meter Industry Market Report: 2019-2033
This comprehensive report provides an in-depth analysis of the global smart energy meter industry, encompassing market size, growth drivers, key players, and future trends. With a study period spanning 2019-2033, a base year of 2025, and a forecast period of 2025-2033, this report offers actionable insights for industry stakeholders, investors, and strategic decision-makers. The market is projected to reach xx Million by 2033, exhibiting a CAGR of xx% during the forecast period.
Smart Energy Meter Industry Market Concentration & Dynamics
The smart energy meter market is characterized by a moderately concentrated landscape, with several major players holding significant market share. Itron Inc., Landis+gyr Group AG, and Kamstrup A/S are among the leading global players, commanding a combined market share of approximately xx%. However, the market also features a significant number of regional and national players, particularly in rapidly developing economies like China and India. Innovation in smart metering technology is driven by continuous advancements in communication protocols (e.g., LTE-M, NB-IoT), data analytics capabilities, and integration with renewable energy sources. Regulatory frameworks, particularly government mandates for smart grid deployments and energy efficiency initiatives, are crucial in shaping market growth. Substitute products, while limited, include traditional electromechanical meters, but their market share is steadily declining due to the advantages offered by smart meters. M&A activity in the sector has been moderate, with approximately xx deals recorded between 2019 and 2024. End-user trends show a growing preference for advanced metering infrastructure (AMI) solutions that offer real-time consumption data and remote meter management capabilities, driving demand for smart meters across residential, commercial, and industrial sectors.
Smart Energy Meter Industry Industry Insights & Trends
The global smart energy meter market is experiencing robust growth, fueled by several key factors. The increasing adoption of smart grids worldwide is a significant driver, as utilities seek to enhance grid reliability, improve operational efficiency, and reduce energy losses. Technological advancements, such as the integration of advanced communication technologies and data analytics, are further accelerating market growth. The rising demand for real-time energy consumption data, enabling better energy management and reduced bills, is boosting consumer adoption. Moreover, government regulations and initiatives promoting energy efficiency and smart city development are creating a favorable environment for smart meter deployment. The market size reached approximately xx Million in 2024 and is projected to reach xx Million by 2033. This growth is attributed to rising electricity consumption, particularly in developing nations, coupled with the need for better grid infrastructure management.
Key Markets & Segments Leading Smart Energy Meter Industry
The residential segment constitutes the largest share of the smart energy meter market, driven by factors like increasing awareness of energy consumption and the desire for cost savings among consumers. The rapid urbanization and growth of the middle class are further contributing factors. However, the commercial and industrial segments are expected to show significant growth in the coming years due to the increasing demand for energy efficiency in commercial buildings and industrial facilities.
- Residential: Driven by rising energy costs and consumer awareness of energy management.
- Commercial: Fueled by the need for optimized energy consumption in buildings and businesses.
- Industrial: Driven by demand for enhanced operational efficiency and cost reduction strategies.
Geographically, North America and Europe currently hold a significant share of the market, owing to well-established smart grid infrastructure and strong regulatory support. However, Asia-Pacific, especially countries like India and China, is poised for exponential growth driven by rapid urbanization and government initiatives supporting smart grid development.
Smart Energy Meter Industry Product Developments
Recent product innovations include the incorporation of advanced communication technologies, such as narrowband IoT (NB-IoT) and LTE-M, enabling seamless data transmission and improved grid management. Smart meters are increasingly integrated with advanced analytics capabilities, providing valuable insights into energy consumption patterns. The development of next-generation smart meters with enhanced security features and advanced data processing capabilities is a key focus area. This enhances their market relevance, positioning them as essential components in modern smart grids.
Challenges in the Smart Energy Meter Industry Market
The smart energy meter market faces several challenges, including high initial investment costs, concerns about data security and privacy, and the need for robust cybersecurity infrastructure. Supply chain disruptions, especially the scarcity of crucial electronic components, have also impacted production capacity, leading to increased costs. In addition, the complexity of integrating smart meters with existing grid infrastructure and the potential for interoperability issues can create obstacles to widespread adoption. The lack of standardization across various smart meter technologies also creates integration difficulties.
Forces Driving Smart Energy Meter Industry Growth
Several factors are driving the growth of the smart energy meter market, including government initiatives and subsidies for smart grid deployment, increasing consumer demand for energy efficiency and cost reduction, and technological advancements that enhance meter functionality and reliability. The growing adoption of renewable energy sources, coupled with the need for effective grid management, is also significantly boosting the demand for smart meters. Moreover, advancements in data analytics and artificial intelligence (AI) are creating opportunities for improved grid management and enhanced customer services.
Long-Term Growth Catalysts in the Smart Energy Meter Industry
Long-term growth in the smart energy meter industry will be driven by continued innovation in areas like advanced metering infrastructure (AMI) and the integration of smart meters with other smart city technologies. Strategic partnerships between meter manufacturers, utility companies, and software providers will play a crucial role in accelerating market adoption. Expanding into emerging markets with significant electrification potential offers substantial growth opportunities. Investments in research and development, focusing on next-generation technologies, will be vital to maintaining a competitive edge.
Emerging Opportunities in Smart Energy Meter Industry
Emerging opportunities lie in the development of smart meters integrated with energy storage systems and demand-side management technologies. The expansion into new markets, such as developing countries with limited grid infrastructure, presents considerable potential. The integration of smart meters with home automation systems and the adoption of advanced data analytics for predictive maintenance are promising areas of growth. The increasing use of blockchain technology for improved security and transparency in energy trading is a key opportunity.
Leading Players in the Smart Energy Meter Industry Sector
- Itron Inc.
- Holley Technology Ltd
- Kamstrup A/S
- Landis+gyr Group AG
- Sensus USA Inc (Xylem Inc)
- Nanjing Xinlian Electronics Co Ltd
- Sagemcom SAS
- Jiangsu Linyang Energy Co Ltd
- Elster Group GMBH (Honeywell International Inc )
- Ningbo Sanxing Electric Co Ltd
- Shenzhen Hemei Group Co Ltd
- Wasion Group Holdings
- Hexing Electric Company Ltd
Key Milestones in Smart Energy Meter Industry Industry
- August 2022: Adani Electricity Mumbai Limited (AEML) announced a USD 60 million investment to install seven lakh smart meters in Mumbai by the end of 2023. This significantly boosts the Indian smart meter market.
- April 2021: Itron launched a new residential smart electricity meter (eHZ-B) for German utilities, supporting the European energy transition and advanced metering infrastructure. This highlights the focus on technological advancements within the industry.
Strategic Outlook for Smart Energy Meter Industry Market
The future of the smart energy meter market is bright, driven by the ongoing expansion of smart grid initiatives globally. The convergence of smart meters with other smart city technologies, such as smart lighting and smart transportation, will create new revenue streams and growth opportunities. Companies that can successfully innovate, adapt to evolving regulatory landscapes, and build robust partnerships will be well-positioned to capitalize on the long-term growth potential of this dynamic market.
Smart Energy Meter Industry Segmentation
-
1. End-user
- 1.1. Residential
- 1.2. Commercial
- 1.3. Industrial
Smart Energy Meter Industry Segmentation By Geography
-
1. North America
- 1.1. United States
- 1.2. Canada
-
2. Europe
- 2.1. United Kingdom
- 2.2. Spain
- 2.3. Germany
- 2.4. Italy
- 2.5. France
- 2.6. Turkey
- 2.7. Nordics
- 2.8. Benelux
- 2.9. Rest of Europe
-
3. Asia Pacific
- 3.1. China
- 3.2. India
- 3.3. Japan
- 3.4. Australia and New Zealand
- 3.5. South Korea
- 3.6. Southeast Asia
- 4. Rest of Asia Pacific
-
5. Latin America
- 5.1. Brazil
- 5.2. Mexico
- 5.3. Columbia
- 5.4. Chile
- 5.5. Rest of Latin America
- 6. Middle East
-
7. GCC
- 7.1. South Africa
- 7.2. Egypt
- 7.3. Rest of Africa
- 7.4. Rest of Middle East
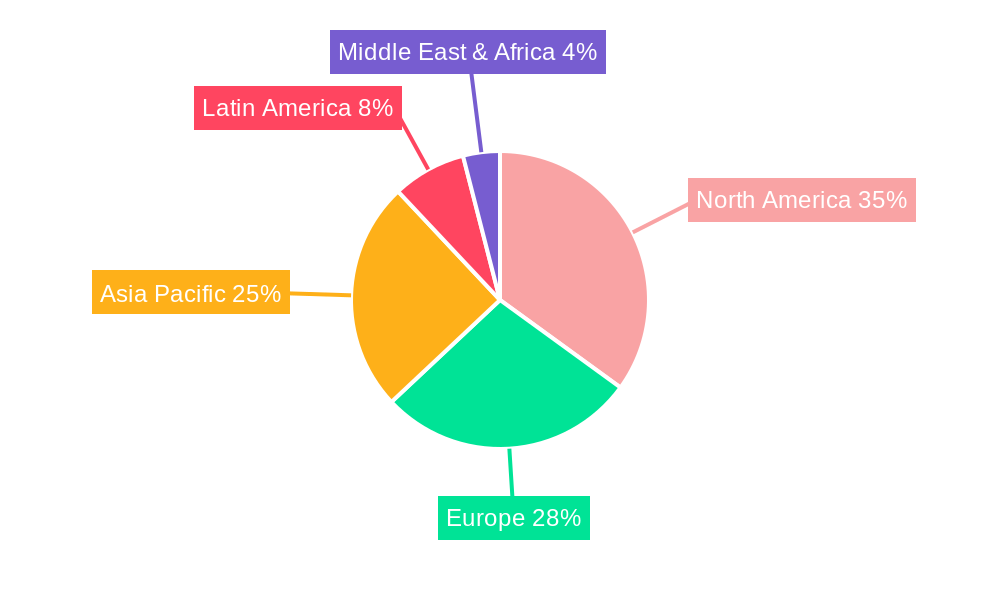
Smart Energy Meter Industry Regional Market Share
Geographic Coverage of Smart Energy Meter Industry
Smart Energy Meter Industry REPORT HIGHLIGHTS
| Aspects | Details |
|---|---|
| Study Period | 2020-2034 |
| Base Year | 2025 |
| Estimated Year | 2026 |
| Forecast Period | 2026-2034 |
| Historical Period | 2020-2025 |
| Growth Rate | CAGR of 7.9% from 2020-2034 |
| Segmentation |
|
Table of Contents
- 1. Introduction
- 1.1. Research Scope
- 1.2. Market Segmentation
- 1.3. Research Methodology
- 1.4. Definitions and Assumptions
- 2. Executive Summary
- 2.1. Introduction
- 3. Market Dynamics
- 3.1. Introduction
- 3.2. Market Drivers
- 3.2.1. Supportive Government Regulations in Key Regions; Rise in Smart City Deployment
- 3.3. Market Restrains
- 3.3.1. High Costs and Security Concerns; Integration Difficulties with Smart Meters
- 3.4. Market Trends
- 3.4.1. Residential Segment to Register Significant Growing
- 4. Market Factor Analysis
- 4.1. Porters Five Forces
- 4.2. Supply/Value Chain
- 4.3. PESTEL analysis
- 4.4. Market Entropy
- 4.5. Patent/Trademark Analysis
- 5. Global Smart Energy Meter Industry Analysis, Insights and Forecast, 2020-2032
- 5.1. Market Analysis, Insights and Forecast - by End-user
- 5.1.1. Residential
- 5.1.2. Commercial
- 5.1.3. Industrial
- 5.2. Market Analysis, Insights and Forecast - by Region
- 5.2.1. North America
- 5.2.2. Europe
- 5.2.3. Asia Pacific
- 5.2.4. Rest of Asia Pacific
- 5.2.5. Latin America
- 5.2.6. Middle East
- 5.2.7. GCC
- 5.1. Market Analysis, Insights and Forecast - by End-user
- 6. North America Smart Energy Meter Industry Analysis, Insights and Forecast, 2020-2032
- 6.1. Market Analysis, Insights and Forecast - by End-user
- 6.1.1. Residential
- 6.1.2. Commercial
- 6.1.3. Industrial
- 6.1. Market Analysis, Insights and Forecast - by End-user
- 7. Europe Smart Energy Meter Industry Analysis, Insights and Forecast, 2020-2032
- 7.1. Market Analysis, Insights and Forecast - by End-user
- 7.1.1. Residential
- 7.1.2. Commercial
- 7.1.3. Industrial
- 7.1. Market Analysis, Insights and Forecast - by End-user
- 8. Asia Pacific Smart Energy Meter Industry Analysis, Insights and Forecast, 2020-2032
- 8.1. Market Analysis, Insights and Forecast - by End-user
- 8.1.1. Residential
- 8.1.2. Commercial
- 8.1.3. Industrial
- 8.1. Market Analysis, Insights and Forecast - by End-user
- 9. Rest of Asia Pacific Smart Energy Meter Industry Analysis, Insights and Forecast, 2020-2032
- 9.1. Market Analysis, Insights and Forecast - by End-user
- 9.1.1. Residential
- 9.1.2. Commercial
- 9.1.3. Industrial
- 9.1. Market Analysis, Insights and Forecast - by End-user
- 10. Latin America Smart Energy Meter Industry Analysis, Insights and Forecast, 2020-2032
- 10.1. Market Analysis, Insights and Forecast - by End-user
- 10.1.1. Residential
- 10.1.2. Commercial
- 10.1.3. Industrial
- 10.1. Market Analysis, Insights and Forecast - by End-user
- 11. Middle East Smart Energy Meter Industry Analysis, Insights and Forecast, 2020-2032
- 11.1. Market Analysis, Insights and Forecast - by End-user
- 11.1.1. Residential
- 11.1.2. Commercial
- 11.1.3. Industrial
- 11.1. Market Analysis, Insights and Forecast - by End-user
- 12. GCC Smart Energy Meter Industry Analysis, Insights and Forecast, 2020-2032
- 12.1. Market Analysis, Insights and Forecast - by End-user
- 12.1.1. Residential
- 12.1.2. Commercial
- 12.1.3. Industrial
- 12.1. Market Analysis, Insights and Forecast - by End-user
- 13. North America Smart Energy Meter Industry Analysis, Insights and Forecast, 2020-2032
- 13.1. Market Analysis, Insights and Forecast - By Country/Sub-region
- 13.1.1 United States
- 13.1.2 Canada
- 14. Europe Smart Energy Meter Industry Analysis, Insights and Forecast, 2020-2032
- 14.1. Market Analysis, Insights and Forecast - By Country/Sub-region
- 14.1.1 United Kingdom
- 14.1.2 Spain
- 14.1.3 Germany
- 14.1.4 Italy
- 14.1.5 France
- 14.1.6 Turkey
- 14.1.7 Nordics
- 14.1.8 Benelux
- 14.1.9 Rest of Europe
- 15. Asia Pacific Smart Energy Meter Industry Analysis, Insights and Forecast, 2020-2032
- 15.1. Market Analysis, Insights and Forecast - By Country/Sub-region
- 15.1.1 China
- 15.1.2 India
- 15.1.3 Japan
- 15.1.4 Australia and New Zealand
- 15.1.5 South Korea
- 15.1.6 Southeast Asia
- 16. Rest of Asia Pacific Smart Energy Meter Industry Analysis, Insights and Forecast, 2020-2032
- 16.1. Market Analysis, Insights and Forecast - By Country/Sub-region
- 16.1.1.
- 17. Latin America Smart Energy Meter Industry Analysis, Insights and Forecast, 2020-2032
- 17.1. Market Analysis, Insights and Forecast - By Country/Sub-region
- 17.1.1 Brazil
- 17.1.2 Mexico
- 17.1.3 Columbia
- 17.1.4 Chile
- 17.1.5 Rest of Latin America
- 18. Middle East Smart Energy Meter Industry Analysis, Insights and Forecast, 2020-2032
- 18.1. Market Analysis, Insights and Forecast - By Country/Sub-region
- 18.1.1.
- 19. GCC Smart Energy Meter Industry Analysis, Insights and Forecast, 2020-2032
- 19.1. Market Analysis, Insights and Forecast - By Country/Sub-region
- 19.1.1 South Africa
- 19.1.2 Egypt
- 19.1.3 Rest of Africa
- 19.1.4 Rest of Middle East
- 20. Competitive Analysis
- 20.1. Global Market Share Analysis 2025
- 20.2. Company Profiles
- 20.2.1 Itron Inc
- 20.2.1.1. Overview
- 20.2.1.2. Products
- 20.2.1.3. SWOT Analysis
- 20.2.1.4. Recent Developments
- 20.2.1.5. Financials (Based on Availability)
- 20.2.2 Holley Technology Ltd
- 20.2.2.1. Overview
- 20.2.2.2. Products
- 20.2.2.3. SWOT Analysis
- 20.2.2.4. Recent Developments
- 20.2.2.5. Financials (Based on Availability)
- 20.2.3 Kamstrup A/S
- 20.2.3.1. Overview
- 20.2.3.2. Products
- 20.2.3.3. SWOT Analysis
- 20.2.3.4. Recent Developments
- 20.2.3.5. Financials (Based on Availability)
- 20.2.4 Landis+gyr Group AG
- 20.2.4.1. Overview
- 20.2.4.2. Products
- 20.2.4.3. SWOT Analysis
- 20.2.4.4. Recent Developments
- 20.2.4.5. Financials (Based on Availability)
- 20.2.5 Sensus USA Inc (Xylem Inc)
- 20.2.5.1. Overview
- 20.2.5.2. Products
- 20.2.5.3. SWOT Analysis
- 20.2.5.4. Recent Developments
- 20.2.5.5. Financials (Based on Availability)
- 20.2.6 Nanjing Xinlian Electronics Co Ltd
- 20.2.6.1. Overview
- 20.2.6.2. Products
- 20.2.6.3. SWOT Analysis
- 20.2.6.4. Recent Developments
- 20.2.6.5. Financials (Based on Availability)
- 20.2.7 Sagemcom SAS
- 20.2.7.1. Overview
- 20.2.7.2. Products
- 20.2.7.3. SWOT Analysis
- 20.2.7.4. Recent Developments
- 20.2.7.5. Financials (Based on Availability)
- 20.2.8 Jiangsu Linyang Energy Co Ltd
- 20.2.8.1. Overview
- 20.2.8.2. Products
- 20.2.8.3. SWOT Analysis
- 20.2.8.4. Recent Developments
- 20.2.8.5. Financials (Based on Availability)
- 20.2.9 Elster Group GMBH (Honeywell International Inc )
- 20.2.9.1. Overview
- 20.2.9.2. Products
- 20.2.9.3. SWOT Analysis
- 20.2.9.4. Recent Developments
- 20.2.9.5. Financials (Based on Availability)
- 20.2.10 Ningbo Sanxing Electric Co Ltd
- 20.2.10.1. Overview
- 20.2.10.2. Products
- 20.2.10.3. SWOT Analysis
- 20.2.10.4. Recent Developments
- 20.2.10.5. Financials (Based on Availability)
- 20.2.11 Shenzhen Hemei Group Co Ltd*List Not Exhaustive
- 20.2.11.1. Overview
- 20.2.11.2. Products
- 20.2.11.3. SWOT Analysis
- 20.2.11.4. Recent Developments
- 20.2.11.5. Financials (Based on Availability)
- 20.2.12 Wasion Group Holdings
- 20.2.12.1. Overview
- 20.2.12.2. Products
- 20.2.12.3. SWOT Analysis
- 20.2.12.4. Recent Developments
- 20.2.12.5. Financials (Based on Availability)
- 20.2.13 Hexing Electric Company Ltd
- 20.2.13.1. Overview
- 20.2.13.2. Products
- 20.2.13.3. SWOT Analysis
- 20.2.13.4. Recent Developments
- 20.2.13.5. Financials (Based on Availability)
- 20.2.1 Itron Inc
List of Figures
- Figure 1: Global Smart Energy Meter Industry Revenue Breakdown (billion, %) by Region 2025 & 2033
- Figure 2: Global Smart Energy Meter Industry Volume Breakdown (Million, %) by Region 2025 & 2033
- Figure 3: North America Smart Energy Meter Industry Revenue (billion), by Country 2025 & 2033
- Figure 4: North America Smart Energy Meter Industry Volume (Million), by Country 2025 & 2033
- Figure 5: North America Smart Energy Meter Industry Revenue Share (%), by Country 2025 & 2033
- Figure 6: North America Smart Energy Meter Industry Volume Share (%), by Country 2025 & 2033
- Figure 7: Europe Smart Energy Meter Industry Revenue (billion), by Country 2025 & 2033
- Figure 8: Europe Smart Energy Meter Industry Volume (Million), by Country 2025 & 2033
- Figure 9: Europe Smart Energy Meter Industry Revenue Share (%), by Country 2025 & 2033
- Figure 10: Europe Smart Energy Meter Industry Volume Share (%), by Country 2025 & 2033
- Figure 11: Asia Pacific Smart Energy Meter Industry Revenue (billion), by Country 2025 & 2033
- Figure 12: Asia Pacific Smart Energy Meter Industry Volume (Million), by Country 2025 & 2033
- Figure 13: Asia Pacific Smart Energy Meter Industry Revenue Share (%), by Country 2025 & 2033
- Figure 14: Asia Pacific Smart Energy Meter Industry Volume Share (%), by Country 2025 & 2033
- Figure 15: Rest of Asia Pacific Smart Energy Meter Industry Revenue (billion), by Country 2025 & 2033
- Figure 16: Rest of Asia Pacific Smart Energy Meter Industry Volume (Million), by Country 2025 & 2033
- Figure 17: Rest of Asia Pacific Smart Energy Meter Industry Revenue Share (%), by Country 2025 & 2033
- Figure 18: Rest of Asia Pacific Smart Energy Meter Industry Volume Share (%), by Country 2025 & 2033
- Figure 19: Latin America Smart Energy Meter Industry Revenue (billion), by Country 2025 & 2033
- Figure 20: Latin America Smart Energy Meter Industry Volume (Million), by Country 2025 & 2033
- Figure 21: Latin America Smart Energy Meter Industry Revenue Share (%), by Country 2025 & 2033
- Figure 22: Latin America Smart Energy Meter Industry Volume Share (%), by Country 2025 & 2033
- Figure 23: Middle East Smart Energy Meter Industry Revenue (billion), by Country 2025 & 2033
- Figure 24: Middle East Smart Energy Meter Industry Volume (Million), by Country 2025 & 2033
- Figure 25: Middle East Smart Energy Meter Industry Revenue Share (%), by Country 2025 & 2033
- Figure 26: Middle East Smart Energy Meter Industry Volume Share (%), by Country 2025 & 2033
- Figure 27: GCC Smart Energy Meter Industry Revenue (billion), by Country 2025 & 2033
- Figure 28: GCC Smart Energy Meter Industry Volume (Million), by Country 2025 & 2033
- Figure 29: GCC Smart Energy Meter Industry Revenue Share (%), by Country 2025 & 2033
- Figure 30: GCC Smart Energy Meter Industry Volume Share (%), by Country 2025 & 2033
- Figure 31: North America Smart Energy Meter Industry Revenue (billion), by End-user 2025 & 2033
- Figure 32: North America Smart Energy Meter Industry Volume (Million), by End-user 2025 & 2033
- Figure 33: North America Smart Energy Meter Industry Revenue Share (%), by End-user 2025 & 2033
- Figure 34: North America Smart Energy Meter Industry Volume Share (%), by End-user 2025 & 2033
- Figure 35: North America Smart Energy Meter Industry Revenue (billion), by Country 2025 & 2033
- Figure 36: North America Smart Energy Meter Industry Volume (Million), by Country 2025 & 2033
- Figure 37: North America Smart Energy Meter Industry Revenue Share (%), by Country 2025 & 2033
- Figure 38: North America Smart Energy Meter Industry Volume Share (%), by Country 2025 & 2033
- Figure 39: Europe Smart Energy Meter Industry Revenue (billion), by End-user 2025 & 2033
- Figure 40: Europe Smart Energy Meter Industry Volume (Million), by End-user 2025 & 2033
- Figure 41: Europe Smart Energy Meter Industry Revenue Share (%), by End-user 2025 & 2033
- Figure 42: Europe Smart Energy Meter Industry Volume Share (%), by End-user 2025 & 2033
- Figure 43: Europe Smart Energy Meter Industry Revenue (billion), by Country 2025 & 2033
- Figure 44: Europe Smart Energy Meter Industry Volume (Million), by Country 2025 & 2033
- Figure 45: Europe Smart Energy Meter Industry Revenue Share (%), by Country 2025 & 2033
- Figure 46: Europe Smart Energy Meter Industry Volume Share (%), by Country 2025 & 2033
- Figure 47: Asia Pacific Smart Energy Meter Industry Revenue (billion), by End-user 2025 & 2033
- Figure 48: Asia Pacific Smart Energy Meter Industry Volume (Million), by End-user 2025 & 2033
- Figure 49: Asia Pacific Smart Energy Meter Industry Revenue Share (%), by End-user 2025 & 2033
- Figure 50: Asia Pacific Smart Energy Meter Industry Volume Share (%), by End-user 2025 & 2033
- Figure 51: Asia Pacific Smart Energy Meter Industry Revenue (billion), by Country 2025 & 2033
- Figure 52: Asia Pacific Smart Energy Meter Industry Volume (Million), by Country 2025 & 2033
- Figure 53: Asia Pacific Smart Energy Meter Industry Revenue Share (%), by Country 2025 & 2033
- Figure 54: Asia Pacific Smart Energy Meter Industry Volume Share (%), by Country 2025 & 2033
- Figure 55: Rest of Asia Pacific Smart Energy Meter Industry Revenue (billion), by End-user 2025 & 2033
- Figure 56: Rest of Asia Pacific Smart Energy Meter Industry Volume (Million), by End-user 2025 & 2033
- Figure 57: Rest of Asia Pacific Smart Energy Meter Industry Revenue Share (%), by End-user 2025 & 2033
- Figure 58: Rest of Asia Pacific Smart Energy Meter Industry Volume Share (%), by End-user 2025 & 2033
- Figure 59: Rest of Asia Pacific Smart Energy Meter Industry Revenue (billion), by Country 2025 & 2033
- Figure 60: Rest of Asia Pacific Smart Energy Meter Industry Volume (Million), by Country 2025 & 2033
- Figure 61: Rest of Asia Pacific Smart Energy Meter Industry Revenue Share (%), by Country 2025 & 2033
- Figure 62: Rest of Asia Pacific Smart Energy Meter Industry Volume Share (%), by Country 2025 & 2033
- Figure 63: Latin America Smart Energy Meter Industry Revenue (billion), by End-user 2025 & 2033
- Figure 64: Latin America Smart Energy Meter Industry Volume (Million), by End-user 2025 & 2033
- Figure 65: Latin America Smart Energy Meter Industry Revenue Share (%), by End-user 2025 & 2033
- Figure 66: Latin America Smart Energy Meter Industry Volume Share (%), by End-user 2025 & 2033
- Figure 67: Latin America Smart Energy Meter Industry Revenue (billion), by Country 2025 & 2033
- Figure 68: Latin America Smart Energy Meter Industry Volume (Million), by Country 2025 & 2033
- Figure 69: Latin America Smart Energy Meter Industry Revenue Share (%), by Country 2025 & 2033
- Figure 70: Latin America Smart Energy Meter Industry Volume Share (%), by Country 2025 & 2033
- Figure 71: Middle East Smart Energy Meter Industry Revenue (billion), by End-user 2025 & 2033
- Figure 72: Middle East Smart Energy Meter Industry Volume (Million), by End-user 2025 & 2033
- Figure 73: Middle East Smart Energy Meter Industry Revenue Share (%), by End-user 2025 & 2033
- Figure 74: Middle East Smart Energy Meter Industry Volume Share (%), by End-user 2025 & 2033
- Figure 75: Middle East Smart Energy Meter Industry Revenue (billion), by Country 2025 & 2033
- Figure 76: Middle East Smart Energy Meter Industry Volume (Million), by Country 2025 & 2033
- Figure 77: Middle East Smart Energy Meter Industry Revenue Share (%), by Country 2025 & 2033
- Figure 78: Middle East Smart Energy Meter Industry Volume Share (%), by Country 2025 & 2033
- Figure 79: GCC Smart Energy Meter Industry Revenue (billion), by End-user 2025 & 2033
- Figure 80: GCC Smart Energy Meter Industry Volume (Million), by End-user 2025 & 2033
- Figure 81: GCC Smart Energy Meter Industry Revenue Share (%), by End-user 2025 & 2033
- Figure 82: GCC Smart Energy Meter Industry Volume Share (%), by End-user 2025 & 2033
- Figure 83: GCC Smart Energy Meter Industry Revenue (billion), by Country 2025 & 2033
- Figure 84: GCC Smart Energy Meter Industry Volume (Million), by Country 2025 & 2033
- Figure 85: GCC Smart Energy Meter Industry Revenue Share (%), by Country 2025 & 2033
- Figure 86: GCC Smart Energy Meter Industry Volume Share (%), by Country 2025 & 2033
List of Tables
- Table 1: Global Smart Energy Meter Industry Revenue billion Forecast, by Region 2020 & 2033
- Table 2: Global Smart Energy Meter Industry Volume Million Forecast, by Region 2020 & 2033
- Table 3: Global Smart Energy Meter Industry Revenue billion Forecast, by End-user 2020 & 2033
- Table 4: Global Smart Energy Meter Industry Volume Million Forecast, by End-user 2020 & 2033
- Table 5: Global Smart Energy Meter Industry Revenue billion Forecast, by Region 2020 & 2033
- Table 6: Global Smart Energy Meter Industry Volume Million Forecast, by Region 2020 & 2033
- Table 7: Global Smart Energy Meter Industry Revenue billion Forecast, by Country 2020 & 2033
- Table 8: Global Smart Energy Meter Industry Volume Million Forecast, by Country 2020 & 2033
- Table 9: United States Smart Energy Meter Industry Revenue (billion) Forecast, by Application 2020 & 2033
- Table 10: United States Smart Energy Meter Industry Volume (Million) Forecast, by Application 2020 & 2033
- Table 11: Canada Smart Energy Meter Industry Revenue (billion) Forecast, by Application 2020 & 2033
- Table 12: Canada Smart Energy Meter Industry Volume (Million) Forecast, by Application 2020 & 2033
- Table 13: Global Smart Energy Meter Industry Revenue billion Forecast, by Country 2020 & 2033
- Table 14: Global Smart Energy Meter Industry Volume Million Forecast, by Country 2020 & 2033
- Table 15: United Kingdom Smart Energy Meter Industry Revenue (billion) Forecast, by Application 2020 & 2033
- Table 16: United Kingdom Smart Energy Meter Industry Volume (Million) Forecast, by Application 2020 & 2033
- Table 17: Spain Smart Energy Meter Industry Revenue (billion) Forecast, by Application 2020 & 2033
- Table 18: Spain Smart Energy Meter Industry Volume (Million) Forecast, by Application 2020 & 2033
- Table 19: Germany Smart Energy Meter Industry Revenue (billion) Forecast, by Application 2020 & 2033
- Table 20: Germany Smart Energy Meter Industry Volume (Million) Forecast, by Application 2020 & 2033
- Table 21: Italy Smart Energy Meter Industry Revenue (billion) Forecast, by Application 2020 & 2033
- Table 22: Italy Smart Energy Meter Industry Volume (Million) Forecast, by Application 2020 & 2033
- Table 23: France Smart Energy Meter Industry Revenue (billion) Forecast, by Application 2020 & 2033
- Table 24: France Smart Energy Meter Industry Volume (Million) Forecast, by Application 2020 & 2033
- Table 25: Turkey Smart Energy Meter Industry Revenue (billion) Forecast, by Application 2020 & 2033
- Table 26: Turkey Smart Energy Meter Industry Volume (Million) Forecast, by Application 2020 & 2033
- Table 27: Nordics Smart Energy Meter Industry Revenue (billion) Forecast, by Application 2020 & 2033
- Table 28: Nordics Smart Energy Meter Industry Volume (Million) Forecast, by Application 2020 & 2033
- Table 29: Benelux Smart Energy Meter Industry Revenue (billion) Forecast, by Application 2020 & 2033
- Table 30: Benelux Smart Energy Meter Industry Volume (Million) Forecast, by Application 2020 & 2033
- Table 31: Rest of Europe Smart Energy Meter Industry Revenue (billion) Forecast, by Application 2020 & 2033
- Table 32: Rest of Europe Smart Energy Meter Industry Volume (Million) Forecast, by Application 2020 & 2033
- Table 33: Global Smart Energy Meter Industry Revenue billion Forecast, by Country 2020 & 2033
- Table 34: Global Smart Energy Meter Industry Volume Million Forecast, by Country 2020 & 2033
- Table 35: China Smart Energy Meter Industry Revenue (billion) Forecast, by Application 2020 & 2033
- Table 36: China Smart Energy Meter Industry Volume (Million) Forecast, by Application 2020 & 2033
- Table 37: India Smart Energy Meter Industry Revenue (billion) Forecast, by Application 2020 & 2033
- Table 38: India Smart Energy Meter Industry Volume (Million) Forecast, by Application 2020 & 2033
- Table 39: Japan Smart Energy Meter Industry Revenue (billion) Forecast, by Application 2020 & 2033
- Table 40: Japan Smart Energy Meter Industry Volume (Million) Forecast, by Application 2020 & 2033
- Table 41: Australia and New Zealand Smart Energy Meter Industry Revenue (billion) Forecast, by Application 2020 & 2033
- Table 42: Australia and New Zealand Smart Energy Meter Industry Volume (Million) Forecast, by Application 2020 & 2033
- Table 43: South Korea Smart Energy Meter Industry Revenue (billion) Forecast, by Application 2020 & 2033
- Table 44: South Korea Smart Energy Meter Industry Volume (Million) Forecast, by Application 2020 & 2033
- Table 45: Southeast Asia Smart Energy Meter Industry Revenue (billion) Forecast, by Application 2020 & 2033
- Table 46: Southeast Asia Smart Energy Meter Industry Volume (Million) Forecast, by Application 2020 & 2033
- Table 47: Global Smart Energy Meter Industry Revenue billion Forecast, by Country 2020 & 2033
- Table 48: Global Smart Energy Meter Industry Volume Million Forecast, by Country 2020 & 2033
- Table 49: Smart Energy Meter Industry Revenue (billion) Forecast, by Application 2020 & 2033
- Table 50: Smart Energy Meter Industry Volume (Million) Forecast, by Application 2020 & 2033
- Table 51: Global Smart Energy Meter Industry Revenue billion Forecast, by Country 2020 & 2033
- Table 52: Global Smart Energy Meter Industry Volume Million Forecast, by Country 2020 & 2033
- Table 53: Brazil Smart Energy Meter Industry Revenue (billion) Forecast, by Application 2020 & 2033
- Table 54: Brazil Smart Energy Meter Industry Volume (Million) Forecast, by Application 2020 & 2033
- Table 55: Mexico Smart Energy Meter Industry Revenue (billion) Forecast, by Application 2020 & 2033
- Table 56: Mexico Smart Energy Meter Industry Volume (Million) Forecast, by Application 2020 & 2033
- Table 57: Columbia Smart Energy Meter Industry Revenue (billion) Forecast, by Application 2020 & 2033
- Table 58: Columbia Smart Energy Meter Industry Volume (Million) Forecast, by Application 2020 & 2033
- Table 59: Chile Smart Energy Meter Industry Revenue (billion) Forecast, by Application 2020 & 2033
- Table 60: Chile Smart Energy Meter Industry Volume (Million) Forecast, by Application 2020 & 2033
- Table 61: Rest of Latin America Smart Energy Meter Industry Revenue (billion) Forecast, by Application 2020 & 2033
- Table 62: Rest of Latin America Smart Energy Meter Industry Volume (Million) Forecast, by Application 2020 & 2033
- Table 63: Global Smart Energy Meter Industry Revenue billion Forecast, by Country 2020 & 2033
- Table 64: Global Smart Energy Meter Industry Volume Million Forecast, by Country 2020 & 2033
- Table 65: Smart Energy Meter Industry Revenue (billion) Forecast, by Application 2020 & 2033
- Table 66: Smart Energy Meter Industry Volume (Million) Forecast, by Application 2020 & 2033
- Table 67: Global Smart Energy Meter Industry Revenue billion Forecast, by Country 2020 & 2033
- Table 68: Global Smart Energy Meter Industry Volume Million Forecast, by Country 2020 & 2033
- Table 69: South Africa Smart Energy Meter Industry Revenue (billion) Forecast, by Application 2020 & 2033
- Table 70: South Africa Smart Energy Meter Industry Volume (Million) Forecast, by Application 2020 & 2033
- Table 71: Egypt Smart Energy Meter Industry Revenue (billion) Forecast, by Application 2020 & 2033
- Table 72: Egypt Smart Energy Meter Industry Volume (Million) Forecast, by Application 2020 & 2033
- Table 73: Rest of Africa Smart Energy Meter Industry Revenue (billion) Forecast, by Application 2020 & 2033
- Table 74: Rest of Africa Smart Energy Meter Industry Volume (Million) Forecast, by Application 2020 & 2033
- Table 75: Rest of Middle East Smart Energy Meter Industry Revenue (billion) Forecast, by Application 2020 & 2033
- Table 76: Rest of Middle East Smart Energy Meter Industry Volume (Million) Forecast, by Application 2020 & 2033
- Table 77: Global Smart Energy Meter Industry Revenue billion Forecast, by End-user 2020 & 2033
- Table 78: Global Smart Energy Meter Industry Volume Million Forecast, by End-user 2020 & 2033
- Table 79: Global Smart Energy Meter Industry Revenue billion Forecast, by Country 2020 & 2033
- Table 80: Global Smart Energy Meter Industry Volume Million Forecast, by Country 2020 & 2033
- Table 81: United States Smart Energy Meter Industry Revenue (billion) Forecast, by Application 2020 & 2033
- Table 82: United States Smart Energy Meter Industry Volume (Million) Forecast, by Application 2020 & 2033
- Table 83: Canada Smart Energy Meter Industry Revenue (billion) Forecast, by Application 2020 & 2033
- Table 84: Canada Smart Energy Meter Industry Volume (Million) Forecast, by Application 2020 & 2033
- Table 85: Global Smart Energy Meter Industry Revenue billion Forecast, by End-user 2020 & 2033
- Table 86: Global Smart Energy Meter Industry Volume Million Forecast, by End-user 2020 & 2033
- Table 87: Global Smart Energy Meter Industry Revenue billion Forecast, by Country 2020 & 2033
- Table 88: Global Smart Energy Meter Industry Volume Million Forecast, by Country 2020 & 2033
- Table 89: United Kingdom Smart Energy Meter Industry Revenue (billion) Forecast, by Application 2020 & 2033
- Table 90: United Kingdom Smart Energy Meter Industry Volume (Million) Forecast, by Application 2020 & 2033
- Table 91: Spain Smart Energy Meter Industry Revenue (billion) Forecast, by Application 2020 & 2033
- Table 92: Spain Smart Energy Meter Industry Volume (Million) Forecast, by Application 2020 & 2033
- Table 93: Germany Smart Energy Meter Industry Revenue (billion) Forecast, by Application 2020 & 2033
- Table 94: Germany Smart Energy Meter Industry Volume (Million) Forecast, by Application 2020 & 2033
- Table 95: Italy Smart Energy Meter Industry Revenue (billion) Forecast, by Application 2020 & 2033
- Table 96: Italy Smart Energy Meter Industry Volume (Million) Forecast, by Application 2020 & 2033
- Table 97: France Smart Energy Meter Industry Revenue (billion) Forecast, by Application 2020 & 2033
- Table 98: France Smart Energy Meter Industry Volume (Million) Forecast, by Application 2020 & 2033
- Table 99: Turkey Smart Energy Meter Industry Revenue (billion) Forecast, by Application 2020 & 2033
- Table 100: Turkey Smart Energy Meter Industry Volume (Million) Forecast, by Application 2020 & 2033
- Table 101: Nordics Smart Energy Meter Industry Revenue (billion) Forecast, by Application 2020 & 2033
- Table 102: Nordics Smart Energy Meter Industry Volume (Million) Forecast, by Application 2020 & 2033
- Table 103: Benelux Smart Energy Meter Industry Revenue (billion) Forecast, by Application 2020 & 2033
- Table 104: Benelux Smart Energy Meter Industry Volume (Million) Forecast, by Application 2020 & 2033
- Table 105: Rest of Europe Smart Energy Meter Industry Revenue (billion) Forecast, by Application 2020 & 2033
- Table 106: Rest of Europe Smart Energy Meter Industry Volume (Million) Forecast, by Application 2020 & 2033
- Table 107: Global Smart Energy Meter Industry Revenue billion Forecast, by End-user 2020 & 2033
- Table 108: Global Smart Energy Meter Industry Volume Million Forecast, by End-user 2020 & 2033
- Table 109: Global Smart Energy Meter Industry Revenue billion Forecast, by Country 2020 & 2033
- Table 110: Global Smart Energy Meter Industry Volume Million Forecast, by Country 2020 & 2033
- Table 111: China Smart Energy Meter Industry Revenue (billion) Forecast, by Application 2020 & 2033
- Table 112: China Smart Energy Meter Industry Volume (Million) Forecast, by Application 2020 & 2033
- Table 113: India Smart Energy Meter Industry Revenue (billion) Forecast, by Application 2020 & 2033
- Table 114: India Smart Energy Meter Industry Volume (Million) Forecast, by Application 2020 & 2033
- Table 115: Japan Smart Energy Meter Industry Revenue (billion) Forecast, by Application 2020 & 2033
- Table 116: Japan Smart Energy Meter Industry Volume (Million) Forecast, by Application 2020 & 2033
- Table 117: Australia and New Zealand Smart Energy Meter Industry Revenue (billion) Forecast, by Application 2020 & 2033
- Table 118: Australia and New Zealand Smart Energy Meter Industry Volume (Million) Forecast, by Application 2020 & 2033
- Table 119: South Korea Smart Energy Meter Industry Revenue (billion) Forecast, by Application 2020 & 2033
- Table 120: South Korea Smart Energy Meter Industry Volume (Million) Forecast, by Application 2020 & 2033
- Table 121: Southeast Asia Smart Energy Meter Industry Revenue (billion) Forecast, by Application 2020 & 2033
- Table 122: Southeast Asia Smart Energy Meter Industry Volume (Million) Forecast, by Application 2020 & 2033
- Table 123: Global Smart Energy Meter Industry Revenue billion Forecast, by End-user 2020 & 2033
- Table 124: Global Smart Energy Meter Industry Volume Million Forecast, by End-user 2020 & 2033
- Table 125: Global Smart Energy Meter Industry Revenue billion Forecast, by Country 2020 & 2033
- Table 126: Global Smart Energy Meter Industry Volume Million Forecast, by Country 2020 & 2033
- Table 127: Global Smart Energy Meter Industry Revenue billion Forecast, by End-user 2020 & 2033
- Table 128: Global Smart Energy Meter Industry Volume Million Forecast, by End-user 2020 & 2033
- Table 129: Global Smart Energy Meter Industry Revenue billion Forecast, by Country 2020 & 2033
- Table 130: Global Smart Energy Meter Industry Volume Million Forecast, by Country 2020 & 2033
- Table 131: Brazil Smart Energy Meter Industry Revenue (billion) Forecast, by Application 2020 & 2033
- Table 132: Brazil Smart Energy Meter Industry Volume (Million) Forecast, by Application 2020 & 2033
- Table 133: Mexico Smart Energy Meter Industry Revenue (billion) Forecast, by Application 2020 & 2033
- Table 134: Mexico Smart Energy Meter Industry Volume (Million) Forecast, by Application 2020 & 2033
- Table 135: Columbia Smart Energy Meter Industry Revenue (billion) Forecast, by Application 2020 & 2033
- Table 136: Columbia Smart Energy Meter Industry Volume (Million) Forecast, by Application 2020 & 2033
- Table 137: Chile Smart Energy Meter Industry Revenue (billion) Forecast, by Application 2020 & 2033
- Table 138: Chile Smart Energy Meter Industry Volume (Million) Forecast, by Application 2020 & 2033
- Table 139: Rest of Latin America Smart Energy Meter Industry Revenue (billion) Forecast, by Application 2020 & 2033
- Table 140: Rest of Latin America Smart Energy Meter Industry Volume (Million) Forecast, by Application 2020 & 2033
- Table 141: Global Smart Energy Meter Industry Revenue billion Forecast, by End-user 2020 & 2033
- Table 142: Global Smart Energy Meter Industry Volume Million Forecast, by End-user 2020 & 2033
- Table 143: Global Smart Energy Meter Industry Revenue billion Forecast, by Country 2020 & 2033
- Table 144: Global Smart Energy Meter Industry Volume Million Forecast, by Country 2020 & 2033
- Table 145: Global Smart Energy Meter Industry Revenue billion Forecast, by End-user 2020 & 2033
- Table 146: Global Smart Energy Meter Industry Volume Million Forecast, by End-user 2020 & 2033
- Table 147: Global Smart Energy Meter Industry Revenue billion Forecast, by Country 2020 & 2033
- Table 148: Global Smart Energy Meter Industry Volume Million Forecast, by Country 2020 & 2033
- Table 149: South Africa Smart Energy Meter Industry Revenue (billion) Forecast, by Application 2020 & 2033
- Table 150: South Africa Smart Energy Meter Industry Volume (Million) Forecast, by Application 2020 & 2033
- Table 151: Egypt Smart Energy Meter Industry Revenue (billion) Forecast, by Application 2020 & 2033
- Table 152: Egypt Smart Energy Meter Industry Volume (Million) Forecast, by Application 2020 & 2033
- Table 153: Rest of Africa Smart Energy Meter Industry Revenue (billion) Forecast, by Application 2020 & 2033
- Table 154: Rest of Africa Smart Energy Meter Industry Volume (Million) Forecast, by Application 2020 & 2033
- Table 155: Rest of Middle East Smart Energy Meter Industry Revenue (billion) Forecast, by Application 2020 & 2033
- Table 156: Rest of Middle East Smart Energy Meter Industry Volume (Million) Forecast, by Application 2020 & 2033
Frequently Asked Questions
1. What is the projected Compound Annual Growth Rate (CAGR) of the Smart Energy Meter Industry?
The projected CAGR is approximately 7.9%.
2. Which companies are prominent players in the Smart Energy Meter Industry?
Key companies in the market include Itron Inc, Holley Technology Ltd, Kamstrup A/S, Landis+gyr Group AG, Sensus USA Inc (Xylem Inc), Nanjing Xinlian Electronics Co Ltd, Sagemcom SAS, Jiangsu Linyang Energy Co Ltd, Elster Group GMBH (Honeywell International Inc ), Ningbo Sanxing Electric Co Ltd, Shenzhen Hemei Group Co Ltd*List Not Exhaustive, Wasion Group Holdings, Hexing Electric Company Ltd.
3. What are the main segments of the Smart Energy Meter Industry?
The market segments include End-user.
4. Can you provide details about the market size?
The market size is estimated to be USD 30.92 billion as of 2022.
5. What are some drivers contributing to market growth?
Supportive Government Regulations in Key Regions; Rise in Smart City Deployment.
6. What are the notable trends driving market growth?
Residential Segment to Register Significant Growing.
7. Are there any restraints impacting market growth?
High Costs and Security Concerns; Integration Difficulties with Smart Meters.
8. Can you provide examples of recent developments in the market?
August 2022 - Adani Electricity Mumbai Limited (AEML) announced its plan to invest approximately INR 500 crore (~USD 60 million) to install smart meters in Mumbai, India. The company plans to install approximately seven lakh smart meters in the region by the end of 2023. The smart electricity meter of the company would enable the customers to get real-time updates on power consumption.
9. What pricing options are available for accessing the report?
Pricing options include single-user, multi-user, and enterprise licenses priced at USD 4750, USD 5250, and USD 8750 respectively.
10. Is the market size provided in terms of value or volume?
The market size is provided in terms of value, measured in billion and volume, measured in Million.
11. Are there any specific market keywords associated with the report?
Yes, the market keyword associated with the report is "Smart Energy Meter Industry," which aids in identifying and referencing the specific market segment covered.
12. How do I determine which pricing option suits my needs best?
The pricing options vary based on user requirements and access needs. Individual users may opt for single-user licenses, while businesses requiring broader access may choose multi-user or enterprise licenses for cost-effective access to the report.
13. Are there any additional resources or data provided in the Smart Energy Meter Industry report?
While the report offers comprehensive insights, it's advisable to review the specific contents or supplementary materials provided to ascertain if additional resources or data are available.
14. How can I stay updated on further developments or reports in the Smart Energy Meter Industry?
To stay informed about further developments, trends, and reports in the Smart Energy Meter Industry, consider subscribing to industry newsletters, following relevant companies and organizations, or regularly checking reputable industry news sources and publications.
Methodology
Step 1 - Identification of Relevant Samples Size from Population Database


Step 2 - Approaches for Defining Global Market Size (Value, Volume* & Price*)

Note*: In applicable scenarios
Step 3 - Data Sources
Primary Research
- Web Analytics
- Survey Reports
- Research Institute
- Latest Research Reports
- Opinion Leaders
Secondary Research
- Annual Reports
- White Paper
- Latest Press Release
- Industry Association
- Paid Database
- Investor Presentations

Step 4 - Data Triangulation
Involves using different sources of information in order to increase the validity of a study
These sources are likely to be stakeholders in a program - participants, other researchers, program staff, other community members, and so on.
Then we put all data in single framework & apply various statistical tools to find out the dynamic on the market.
During the analysis stage, feedback from the stakeholder groups would be compared to determine areas of agreement as well as areas of divergence
