

Key Insights
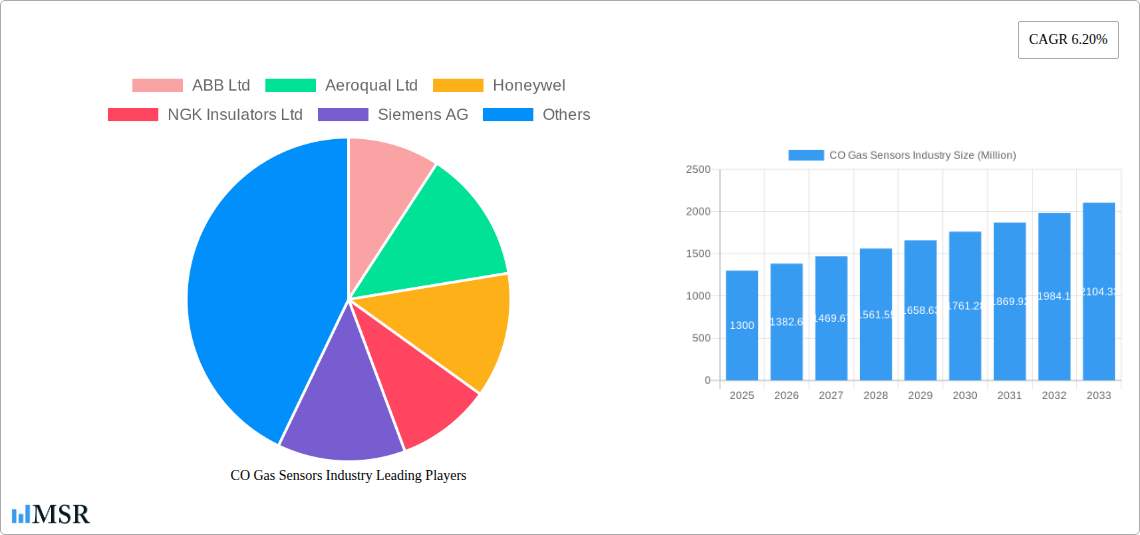
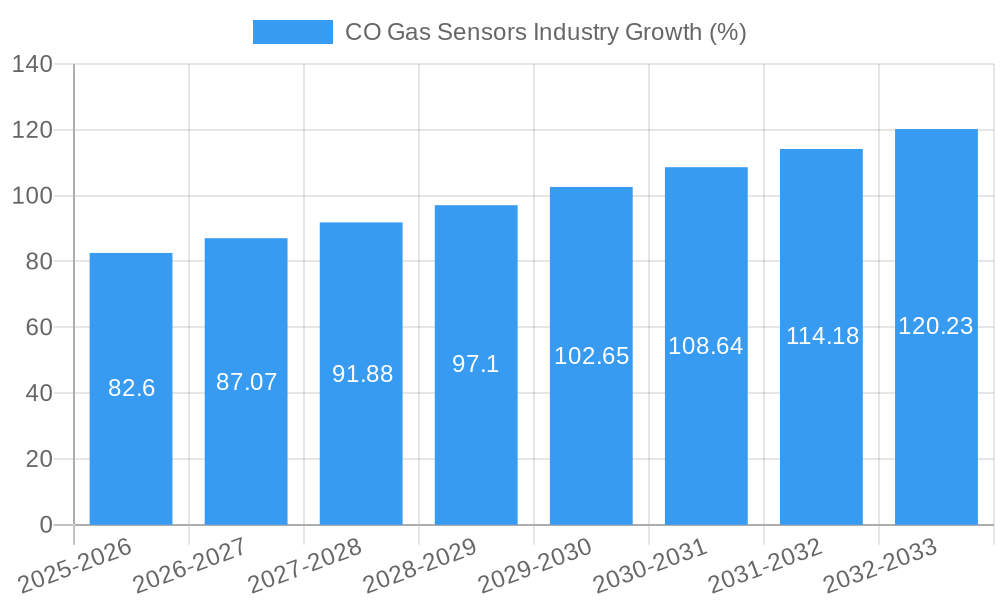
The global CO gas sensor market, valued at $1.30 billion in 2025, is projected to experience robust growth, exhibiting a compound annual growth rate (CAGR) of 6.2% from 2025 to 2033. This expansion is fueled by several key drivers. Increasing industrialization and urbanization lead to higher demand for effective safety and monitoring solutions in various sectors. Stringent environmental regulations globally mandate precise CO detection in industrial processes and vehicles, stimulating market growth. Furthermore, advancements in sensor technology, particularly in semiconductor and electrochemical sensors, are offering improved accuracy, sensitivity, and miniaturization, making them more cost-effective and adaptable to diverse applications. The automotive sector, a significant end-user, is witnessing rapid adoption due to stricter emission norms and the rising popularity of electric vehicles which require precise CO monitoring. The medical sector is also a key driver due to the growing need for reliable CO detection in healthcare facilities and portable devices. Despite this positive outlook, challenges remain. The high initial investment costs associated with advanced sensor technologies can hinder wider adoption, particularly in smaller businesses. Additionally, the need for frequent sensor calibration and maintenance can impact the overall cost of ownership.
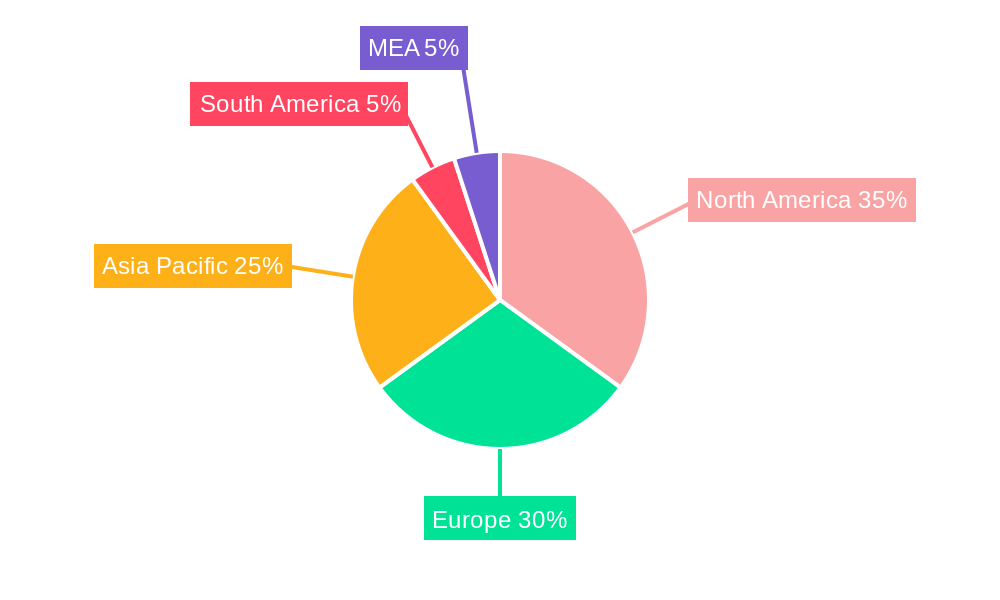
Market segmentation reveals that semiconductor and electrochemical sensors dominate the technology segment due to their established reliability and relatively lower costs. The medical, industrial, and automotive sectors represent the largest application segments, reflecting the high sensitivity of these industries to CO exposure. Geographically, North America and Europe currently hold significant market shares due to advanced infrastructure and stringent regulatory environments. However, the Asia-Pacific region is projected to experience the fastest growth rate, driven by rapid industrial development and increasing environmental awareness in countries like China and India. Competition is intense, with established players like ABB Ltd., Honeywell, and Siemens AG alongside specialized sensor manufacturers vying for market dominance. Strategic partnerships, product innovations, and acquisitions are expected to shape the competitive landscape over the forecast period. The future of the CO gas sensor market hinges on further technological advancements, regulatory compliance, and the sustained growth of key end-user industries.
CO Gas Sensors Industry Market Report: 2019-2033
This comprehensive report provides a detailed analysis of the CO Gas Sensors industry, offering invaluable insights for stakeholders, investors, and industry professionals. The study period covers 2019-2033, with a base year of 2025 and a forecast period of 2025-2033. The report delves into market dynamics, technological advancements, key players, and emerging opportunities within this rapidly evolving sector. Expected market value in 2025 is predicted at xx Million. The report utilizes data from the historical period (2019-2024) to project future trends and market size.
CO Gas Sensors Industry Market Concentration & Dynamics
The CO Gas Sensors market exhibits a moderately concentrated landscape, with several key players holding significant market share. ABB Ltd, Honeywell, Siemens AG, and Robert Bosch GmbH are among the leading companies, driving innovation and shaping market trends. Market share data for 2025 suggests ABB Ltd holds approximately xx% market share, followed by Honeywell at xx%, Siemens AG at xx%, and Robert Bosch GmbH at xx%. The remaining market share is distributed among other players including Aeroqual Ltd, NGK Insulators Ltd, Trolex Ltd, Alphasense, GfG Europe Ltd, Yokogawa Electric Corporation, and Dynament Ltd.
The industry's innovation ecosystem is vibrant, fueled by continuous advancements in sensor technology, particularly in semiconductor, electrochemical, and infrared sensing. Regulatory frameworks, including those focused on emission standards and workplace safety, significantly influence market growth. Substitute products, such as optical gas imaging systems, pose a level of competition, although CO gas sensors remain the dominant technology in many applications. End-user trends towards improved safety, environmental monitoring, and automation are key drivers. Mergers and acquisitions (M&A) activity has been relatively moderate in recent years, with an estimated xx M&A deals occurring between 2019 and 2024.
CO Gas Sensors Industry Industry Insights & Trends
The global CO Gas Sensors market is experiencing robust growth, driven by increasing industrialization, stringent environmental regulations, and rising demand for enhanced safety measures across various sectors. The market size in 2025 is estimated at xx Million, exhibiting a Compound Annual Growth Rate (CAGR) of xx% during the forecast period (2025-2033). Key growth drivers include the expansion of the automotive industry, particularly the increasing adoption of advanced driver-assistance systems (ADAS) and stricter emission norms. The burgeoning building automation sector, focused on improved indoor air quality and energy efficiency, also significantly contributes to market expansion. Furthermore, advancements in sensor technology, including the development of more compact, reliable, and cost-effective sensors, are pushing the market forward. The rise of the Internet of Things (IoT) and the increasing adoption of smart devices further fuels the demand for CO Gas Sensors in diverse applications, including smart homes, industrial automation, and environmental monitoring. Evolving consumer behaviors, including a heightened awareness of environmental issues and improved safety concerns, are driving market demand.
Key Markets & Segments Leading CO Gas Sensors Industry
The Industrial sector dominates the CO Gas Sensors market, accounting for approximately xx% of the total market share in 2025, followed by the Automotive sector at xx% and Building Automation at xx%. Geographically, North America and Europe are leading markets due to well-established industrial bases and stringent environmental regulations. Asia-Pacific is expected to witness significant growth during the forecast period, driven by rapid industrialization and urbanization.
Leading Segments by Technology:
- Electrochemical Sensors: This technology dominates due to its cost-effectiveness and relatively high sensitivity.
- Semiconductor Sensors: Growing rapidly due to miniaturization capabilities and integration with IoT devices.
- Infrared Sensors: Gaining traction in specific applications requiring high accuracy and selectivity.
Leading Segments by Application:
- Industrial: Driven by safety regulations and process monitoring needs.
- Automotive: Fueled by emission control requirements and ADAS development.
- Building Automation: Driven by improved indoor air quality and energy efficiency goals.
Drivers for Key Markets:
- North America & Europe: Stringent environmental regulations, well-established industrial bases, and high disposable incomes.
- Asia-Pacific: Rapid industrialization, urbanization, and rising government investments in infrastructure.
CO Gas Sensors Industry Product Developments
Recent advancements in CO Gas Sensors focus on enhanced sensitivity, improved selectivity, miniaturization, lower power consumption, and increased durability. The integration of MEMS technology, as showcased by Teledyne Gas and Flame Detection's OLCT 100-XP-MS, represents a significant step forward. This technology enables the combination of different sensing principles within a single device, providing a more comprehensive and reliable solution for gas detection. The development of smart sensors with integrated data processing and wireless communication capabilities is another major trend, allowing for remote monitoring and improved data management. This is crucial for applications such as building automation and environmental monitoring.
Challenges in the CO Gas Sensors Industry Market
The CO Gas Sensors market faces challenges related to supply chain disruptions, particularly concerning the availability of raw materials and components. This issue impacts production costs and delivery times. Furthermore, intense competition among manufacturers necessitates continuous innovation and cost optimization to maintain market share. Regulatory compliance and certification requirements also add complexity and cost. The market experiences fluctuating raw material prices impacting the overall profitability of the industry.
Forces Driving CO Gas Sensors Industry Growth
Technological advancements, including the development of smaller, more energy-efficient, and more accurate sensors, are major growth drivers. Stringent environmental regulations, particularly concerning CO emissions, are compelling industries to adopt advanced monitoring technologies. Government incentives and subsidies supporting the development and adoption of clean technologies further stimulate market growth. Economic growth in developing economies increases industrial activity, driving demand for CO gas sensors.
Long-Term Growth Catalysts in the CO Gas Sensors Industry
Long-term growth will be fueled by strategic partnerships and collaborations among sensor manufacturers, technology providers, and end-users. The continuous development of advanced sensor technologies, incorporating artificial intelligence (AI) and machine learning (ML) for improved data analysis and predictive maintenance, will play a significant role. Expansion into new markets, particularly in developing economies with growing industrial sectors and infrastructure projects, will unlock further growth opportunities.
Emerging Opportunities in CO Gas Sensors Industry
The integration of CO gas sensors into IoT networks provides significant opportunities for remote monitoring, predictive maintenance, and improved data analytics. The growing demand for smart cities and smart buildings creates ample opportunities for integrating CO gas sensors into building management systems. The development of portable and wearable CO gas sensors for personal safety applications is another significant emerging market.
Leading Players in the CO Gas Sensors Industry Sector
- ABB Ltd
- Aeroqual Ltd
- Honeywel
- NGK Insulators Ltd
- Siemens AG
- Trolex Ltd
- Alphasense
- GfG Europe Ltd
- Robert Bosch GmbH
- Yokogawa Electric Corporation
- Dynament Ltd
Key Milestones in CO Gas Sensors Industry Industry
- September 2023: NASA-Built Greenhouse Gas Detector moves closer to launch, advancing atmospheric monitoring capabilities.
- March 2024: Teledyne Gas and Flame Detection launches the OLCT 100-XP-MS, a high-performance flammable gas detector incorporating advanced MEMS sensor technology. This launch represents a significant advancement in multi-sensor technology for gas detection.
Strategic Outlook for CO Gas Sensors Industry Market
The future of the CO Gas Sensors market is bright, driven by continuous technological advancements, increasing environmental awareness, and the growing demand for safety and efficiency across various sectors. Strategic partnerships, focused on developing innovative sensor solutions and expanding into new markets, will be crucial for success. The focus on miniaturization, improved accuracy, and lower power consumption will continue to shape the industry. The market is poised for robust growth, driven by long-term trends toward increased safety regulations, environmental monitoring, and the expansion of industrial activity globally.
CO Gas Sensors Industry Segmentation
-
1. Technology
- 1.1. Semiconductor Sensor
- 1.2. Electrochemical Sensor
- 1.3. Solid State/MOS Sensor
- 1.4. PID
- 1.5. Catalytic
- 1.6. Infrared
-
2. Application
- 2.1. Medical
- 2.2. Petrochemical
- 2.3. Building Automation
- 2.4. Industrial
- 2.5. Environmental
- 2.6. Automotive
- 2.7. Other Applications
CO Gas Sensors Industry Segmentation By Geography
- 1. North America
- 2. Europe
- 3. Asia
- 4. Australia and New Zealand
- 5. Latin America
- 6. Middle East and Africa
CO Gas Sensors Industry REPORT HIGHLIGHTS
| Aspects | Details |
|---|---|
| Study Period | 2019-2033 |
| Base Year | 2024 |
| Estimated Year | 2025 |
| Forecast Period | 2025-2033 |
| Historical Period | 2019-2024 |
| Growth Rate | CAGR of 6.20% from 2019-2033 |
| Segmentation |
|
Table of Contents
- 1. Introduction
- 1.1. Research Scope
- 1.2. Market Segmentation
- 1.3. Research Methodology
- 1.4. Definitions and Assumptions
- 2. Executive Summary
- 2.1. Introduction
- 3. Market Dynamics
- 3.1. Introduction
- 3.2. Market Drivers
- 3.2.1. Government Regulations to Ensure Safety in Work Places; Increasing Need for Emission Control Standards
- 3.3. Market Restrains
- 3.3.1. Lack of Awareness of Safety Gains in SME; Cost of Maintenance and Low Product Differentiation
- 3.4. Market Trends
- 3.4.1. The Petrochemical Segment to Witness Growth
- 4. Market Factor Analysis
- 4.1. Porters Five Forces
- 4.2. Supply/Value Chain
- 4.3. PESTEL analysis
- 4.4. Market Entropy
- 4.5. Patent/Trademark Analysis
- 5. Global CO Gas Sensors Industry Analysis, Insights and Forecast, 2019-2031
- 5.1. Market Analysis, Insights and Forecast - by Technology
- 5.1.1. Semiconductor Sensor
- 5.1.2. Electrochemical Sensor
- 5.1.3. Solid State/MOS Sensor
- 5.1.4. PID
- 5.1.5. Catalytic
- 5.1.6. Infrared
- 5.2. Market Analysis, Insights and Forecast - by Application
- 5.2.1. Medical
- 5.2.2. Petrochemical
- 5.2.3. Building Automation
- 5.2.4. Industrial
- 5.2.5. Environmental
- 5.2.6. Automotive
- 5.2.7. Other Applications
- 5.3. Market Analysis, Insights and Forecast - by Region
- 5.3.1. North America
- 5.3.2. Europe
- 5.3.3. Asia
- 5.3.4. Australia and New Zealand
- 5.3.5. Latin America
- 5.3.6. Middle East and Africa
- 5.1. Market Analysis, Insights and Forecast - by Technology
- 6. North America CO Gas Sensors Industry Analysis, Insights and Forecast, 2019-2031
- 6.1. Market Analysis, Insights and Forecast - by Technology
- 6.1.1. Semiconductor Sensor
- 6.1.2. Electrochemical Sensor
- 6.1.3. Solid State/MOS Sensor
- 6.1.4. PID
- 6.1.5. Catalytic
- 6.1.6. Infrared
- 6.2. Market Analysis, Insights and Forecast - by Application
- 6.2.1. Medical
- 6.2.2. Petrochemical
- 6.2.3. Building Automation
- 6.2.4. Industrial
- 6.2.5. Environmental
- 6.2.6. Automotive
- 6.2.7. Other Applications
- 6.1. Market Analysis, Insights and Forecast - by Technology
- 7. Europe CO Gas Sensors Industry Analysis, Insights and Forecast, 2019-2031
- 7.1. Market Analysis, Insights and Forecast - by Technology
- 7.1.1. Semiconductor Sensor
- 7.1.2. Electrochemical Sensor
- 7.1.3. Solid State/MOS Sensor
- 7.1.4. PID
- 7.1.5. Catalytic
- 7.1.6. Infrared
- 7.2. Market Analysis, Insights and Forecast - by Application
- 7.2.1. Medical
- 7.2.2. Petrochemical
- 7.2.3. Building Automation
- 7.2.4. Industrial
- 7.2.5. Environmental
- 7.2.6. Automotive
- 7.2.7. Other Applications
- 7.1. Market Analysis, Insights and Forecast - by Technology
- 8. Asia CO Gas Sensors Industry Analysis, Insights and Forecast, 2019-2031
- 8.1. Market Analysis, Insights and Forecast - by Technology
- 8.1.1. Semiconductor Sensor
- 8.1.2. Electrochemical Sensor
- 8.1.3. Solid State/MOS Sensor
- 8.1.4. PID
- 8.1.5. Catalytic
- 8.1.6. Infrared
- 8.2. Market Analysis, Insights and Forecast - by Application
- 8.2.1. Medical
- 8.2.2. Petrochemical
- 8.2.3. Building Automation
- 8.2.4. Industrial
- 8.2.5. Environmental
- 8.2.6. Automotive
- 8.2.7. Other Applications
- 8.1. Market Analysis, Insights and Forecast - by Technology
- 9. Australia and New Zealand CO Gas Sensors Industry Analysis, Insights and Forecast, 2019-2031
- 9.1. Market Analysis, Insights and Forecast - by Technology
- 9.1.1. Semiconductor Sensor
- 9.1.2. Electrochemical Sensor
- 9.1.3. Solid State/MOS Sensor
- 9.1.4. PID
- 9.1.5. Catalytic
- 9.1.6. Infrared
- 9.2. Market Analysis, Insights and Forecast - by Application
- 9.2.1. Medical
- 9.2.2. Petrochemical
- 9.2.3. Building Automation
- 9.2.4. Industrial
- 9.2.5. Environmental
- 9.2.6. Automotive
- 9.2.7. Other Applications
- 9.1. Market Analysis, Insights and Forecast - by Technology
- 10. Latin America CO Gas Sensors Industry Analysis, Insights and Forecast, 2019-2031
- 10.1. Market Analysis, Insights and Forecast - by Technology
- 10.1.1. Semiconductor Sensor
- 10.1.2. Electrochemical Sensor
- 10.1.3. Solid State/MOS Sensor
- 10.1.4. PID
- 10.1.5. Catalytic
- 10.1.6. Infrared
- 10.2. Market Analysis, Insights and Forecast - by Application
- 10.2.1. Medical
- 10.2.2. Petrochemical
- 10.2.3. Building Automation
- 10.2.4. Industrial
- 10.2.5. Environmental
- 10.2.6. Automotive
- 10.2.7. Other Applications
- 10.1. Market Analysis, Insights and Forecast - by Technology
- 11. Middle East and Africa CO Gas Sensors Industry Analysis, Insights and Forecast, 2019-2031
- 11.1. Market Analysis, Insights and Forecast - by Technology
- 11.1.1. Semiconductor Sensor
- 11.1.2. Electrochemical Sensor
- 11.1.3. Solid State/MOS Sensor
- 11.1.4. PID
- 11.1.5. Catalytic
- 11.1.6. Infrared
- 11.2. Market Analysis, Insights and Forecast - by Application
- 11.2.1. Medical
- 11.2.2. Petrochemical
- 11.2.3. Building Automation
- 11.2.4. Industrial
- 11.2.5. Environmental
- 11.2.6. Automotive
- 11.2.7. Other Applications
- 11.1. Market Analysis, Insights and Forecast - by Technology
- 12. North America CO Gas Sensors Industry Analysis, Insights and Forecast, 2019-2031
- 12.1. Market Analysis, Insights and Forecast - By Country/Sub-region
- 12.1.1 United States
- 12.1.2 Canada
- 12.1.3 Mexico
- 13. Europe CO Gas Sensors Industry Analysis, Insights and Forecast, 2019-2031
- 13.1. Market Analysis, Insights and Forecast - By Country/Sub-region
- 13.1.1 Germany
- 13.1.2 United Kingdom
- 13.1.3 France
- 13.1.4 Spain
- 13.1.5 Italy
- 13.1.6 Spain
- 13.1.7 Belgium
- 13.1.8 Netherland
- 13.1.9 Nordics
- 13.1.10 Rest of Europe
- 14. Asia Pacific CO Gas Sensors Industry Analysis, Insights and Forecast, 2019-2031
- 14.1. Market Analysis, Insights and Forecast - By Country/Sub-region
- 14.1.1 China
- 14.1.2 Japan
- 14.1.3 India
- 14.1.4 South Korea
- 14.1.5 Southeast Asia
- 14.1.6 Australia
- 14.1.7 Indonesia
- 14.1.8 Phillipes
- 14.1.9 Singapore
- 14.1.10 Thailandc
- 14.1.11 Rest of Asia Pacific
- 15. South America CO Gas Sensors Industry Analysis, Insights and Forecast, 2019-2031
- 15.1. Market Analysis, Insights and Forecast - By Country/Sub-region
- 15.1.1 Brazil
- 15.1.2 Argentina
- 15.1.3 Peru
- 15.1.4 Chile
- 15.1.5 Colombia
- 15.1.6 Ecuador
- 15.1.7 Venezuela
- 15.1.8 Rest of South America
- 16. North America CO Gas Sensors Industry Analysis, Insights and Forecast, 2019-2031
- 16.1. Market Analysis, Insights and Forecast - By Country/Sub-region
- 16.1.1 United States
- 16.1.2 Canada
- 16.1.3 Mexico
- 17. MEA CO Gas Sensors Industry Analysis, Insights and Forecast, 2019-2031
- 17.1. Market Analysis, Insights and Forecast - By Country/Sub-region
- 17.1.1 United Arab Emirates
- 17.1.2 Saudi Arabia
- 17.1.3 South Africa
- 17.1.4 Rest of Middle East and Africa
- 18. Competitive Analysis
- 18.1. Global Market Share Analysis 2024
- 18.2. Company Profiles
- 18.2.1 ABB Ltd
- 18.2.1.1. Overview
- 18.2.1.2. Products
- 18.2.1.3. SWOT Analysis
- 18.2.1.4. Recent Developments
- 18.2.1.5. Financials (Based on Availability)
- 18.2.2 Aeroqual Ltd
- 18.2.2.1. Overview
- 18.2.2.2. Products
- 18.2.2.3. SWOT Analysis
- 18.2.2.4. Recent Developments
- 18.2.2.5. Financials (Based on Availability)
- 18.2.3 Honeywel
- 18.2.3.1. Overview
- 18.2.3.2. Products
- 18.2.3.3. SWOT Analysis
- 18.2.3.4. Recent Developments
- 18.2.3.5. Financials (Based on Availability)
- 18.2.4 NGK Insulators Ltd
- 18.2.4.1. Overview
- 18.2.4.2. Products
- 18.2.4.3. SWOT Analysis
- 18.2.4.4. Recent Developments
- 18.2.4.5. Financials (Based on Availability)
- 18.2.5 Siemens AG
- 18.2.5.1. Overview
- 18.2.5.2. Products
- 18.2.5.3. SWOT Analysis
- 18.2.5.4. Recent Developments
- 18.2.5.5. Financials (Based on Availability)
- 18.2.6 Trolex Ltd
- 18.2.6.1. Overview
- 18.2.6.2. Products
- 18.2.6.3. SWOT Analysis
- 18.2.6.4. Recent Developments
- 18.2.6.5. Financials (Based on Availability)
- 18.2.7 Alphasense
- 18.2.7.1. Overview
- 18.2.7.2. Products
- 18.2.7.3. SWOT Analysis
- 18.2.7.4. Recent Developments
- 18.2.7.5. Financials (Based on Availability)
- 18.2.8 GfG Europe Ltd
- 18.2.8.1. Overview
- 18.2.8.2. Products
- 18.2.8.3. SWOT Analysis
- 18.2.8.4. Recent Developments
- 18.2.8.5. Financials (Based on Availability)
- 18.2.9 Robert Bosch GmbH
- 18.2.9.1. Overview
- 18.2.9.2. Products
- 18.2.9.3. SWOT Analysis
- 18.2.9.4. Recent Developments
- 18.2.9.5. Financials (Based on Availability)
- 18.2.10 Yokogawa Electric Corporation
- 18.2.10.1. Overview
- 18.2.10.2. Products
- 18.2.10.3. SWOT Analysis
- 18.2.10.4. Recent Developments
- 18.2.10.5. Financials (Based on Availability)
- 18.2.11 Dynament Ltd
- 18.2.11.1. Overview
- 18.2.11.2. Products
- 18.2.11.3. SWOT Analysis
- 18.2.11.4. Recent Developments
- 18.2.11.5. Financials (Based on Availability)
- 18.2.1 ABB Ltd
List of Figures
- Figure 1: Global CO Gas Sensors Industry Revenue Breakdown (Million, %) by Region 2024 & 2032
- Figure 2: Global CO Gas Sensors Industry Volume Breakdown (K Unit, %) by Region 2024 & 2032
- Figure 3: North America CO Gas Sensors Industry Revenue (Million), by Country 2024 & 2032
- Figure 4: North America CO Gas Sensors Industry Volume (K Unit), by Country 2024 & 2032
- Figure 5: North America CO Gas Sensors Industry Revenue Share (%), by Country 2024 & 2032
- Figure 6: North America CO Gas Sensors Industry Volume Share (%), by Country 2024 & 2032
- Figure 7: Europe CO Gas Sensors Industry Revenue (Million), by Country 2024 & 2032
- Figure 8: Europe CO Gas Sensors Industry Volume (K Unit), by Country 2024 & 2032
- Figure 9: Europe CO Gas Sensors Industry Revenue Share (%), by Country 2024 & 2032
- Figure 10: Europe CO Gas Sensors Industry Volume Share (%), by Country 2024 & 2032
- Figure 11: Asia Pacific CO Gas Sensors Industry Revenue (Million), by Country 2024 & 2032
- Figure 12: Asia Pacific CO Gas Sensors Industry Volume (K Unit), by Country 2024 & 2032
- Figure 13: Asia Pacific CO Gas Sensors Industry Revenue Share (%), by Country 2024 & 2032
- Figure 14: Asia Pacific CO Gas Sensors Industry Volume Share (%), by Country 2024 & 2032
- Figure 15: South America CO Gas Sensors Industry Revenue (Million), by Country 2024 & 2032
- Figure 16: South America CO Gas Sensors Industry Volume (K Unit), by Country 2024 & 2032
- Figure 17: South America CO Gas Sensors Industry Revenue Share (%), by Country 2024 & 2032
- Figure 18: South America CO Gas Sensors Industry Volume Share (%), by Country 2024 & 2032
- Figure 19: North America CO Gas Sensors Industry Revenue (Million), by Country 2024 & 2032
- Figure 20: North America CO Gas Sensors Industry Volume (K Unit), by Country 2024 & 2032
- Figure 21: North America CO Gas Sensors Industry Revenue Share (%), by Country 2024 & 2032
- Figure 22: North America CO Gas Sensors Industry Volume Share (%), by Country 2024 & 2032
- Figure 23: MEA CO Gas Sensors Industry Revenue (Million), by Country 2024 & 2032
- Figure 24: MEA CO Gas Sensors Industry Volume (K Unit), by Country 2024 & 2032
- Figure 25: MEA CO Gas Sensors Industry Revenue Share (%), by Country 2024 & 2032
- Figure 26: MEA CO Gas Sensors Industry Volume Share (%), by Country 2024 & 2032
- Figure 27: North America CO Gas Sensors Industry Revenue (Million), by Technology 2024 & 2032
- Figure 28: North America CO Gas Sensors Industry Volume (K Unit), by Technology 2024 & 2032
- Figure 29: North America CO Gas Sensors Industry Revenue Share (%), by Technology 2024 & 2032
- Figure 30: North America CO Gas Sensors Industry Volume Share (%), by Technology 2024 & 2032
- Figure 31: North America CO Gas Sensors Industry Revenue (Million), by Application 2024 & 2032
- Figure 32: North America CO Gas Sensors Industry Volume (K Unit), by Application 2024 & 2032
- Figure 33: North America CO Gas Sensors Industry Revenue Share (%), by Application 2024 & 2032
- Figure 34: North America CO Gas Sensors Industry Volume Share (%), by Application 2024 & 2032
- Figure 35: North America CO Gas Sensors Industry Revenue (Million), by Country 2024 & 2032
- Figure 36: North America CO Gas Sensors Industry Volume (K Unit), by Country 2024 & 2032
- Figure 37: North America CO Gas Sensors Industry Revenue Share (%), by Country 2024 & 2032
- Figure 38: North America CO Gas Sensors Industry Volume Share (%), by Country 2024 & 2032
- Figure 39: Europe CO Gas Sensors Industry Revenue (Million), by Technology 2024 & 2032
- Figure 40: Europe CO Gas Sensors Industry Volume (K Unit), by Technology 2024 & 2032
- Figure 41: Europe CO Gas Sensors Industry Revenue Share (%), by Technology 2024 & 2032
- Figure 42: Europe CO Gas Sensors Industry Volume Share (%), by Technology 2024 & 2032
- Figure 43: Europe CO Gas Sensors Industry Revenue (Million), by Application 2024 & 2032
- Figure 44: Europe CO Gas Sensors Industry Volume (K Unit), by Application 2024 & 2032
- Figure 45: Europe CO Gas Sensors Industry Revenue Share (%), by Application 2024 & 2032
- Figure 46: Europe CO Gas Sensors Industry Volume Share (%), by Application 2024 & 2032
- Figure 47: Europe CO Gas Sensors Industry Revenue (Million), by Country 2024 & 2032
- Figure 48: Europe CO Gas Sensors Industry Volume (K Unit), by Country 2024 & 2032
- Figure 49: Europe CO Gas Sensors Industry Revenue Share (%), by Country 2024 & 2032
- Figure 50: Europe CO Gas Sensors Industry Volume Share (%), by Country 2024 & 2032
- Figure 51: Asia CO Gas Sensors Industry Revenue (Million), by Technology 2024 & 2032
- Figure 52: Asia CO Gas Sensors Industry Volume (K Unit), by Technology 2024 & 2032
- Figure 53: Asia CO Gas Sensors Industry Revenue Share (%), by Technology 2024 & 2032
- Figure 54: Asia CO Gas Sensors Industry Volume Share (%), by Technology 2024 & 2032
- Figure 55: Asia CO Gas Sensors Industry Revenue (Million), by Application 2024 & 2032
- Figure 56: Asia CO Gas Sensors Industry Volume (K Unit), by Application 2024 & 2032
- Figure 57: Asia CO Gas Sensors Industry Revenue Share (%), by Application 2024 & 2032
- Figure 58: Asia CO Gas Sensors Industry Volume Share (%), by Application 2024 & 2032
- Figure 59: Asia CO Gas Sensors Industry Revenue (Million), by Country 2024 & 2032
- Figure 60: Asia CO Gas Sensors Industry Volume (K Unit), by Country 2024 & 2032
- Figure 61: Asia CO Gas Sensors Industry Revenue Share (%), by Country 2024 & 2032
- Figure 62: Asia CO Gas Sensors Industry Volume Share (%), by Country 2024 & 2032
- Figure 63: Australia and New Zealand CO Gas Sensors Industry Revenue (Million), by Technology 2024 & 2032
- Figure 64: Australia and New Zealand CO Gas Sensors Industry Volume (K Unit), by Technology 2024 & 2032
- Figure 65: Australia and New Zealand CO Gas Sensors Industry Revenue Share (%), by Technology 2024 & 2032
- Figure 66: Australia and New Zealand CO Gas Sensors Industry Volume Share (%), by Technology 2024 & 2032
- Figure 67: Australia and New Zealand CO Gas Sensors Industry Revenue (Million), by Application 2024 & 2032
- Figure 68: Australia and New Zealand CO Gas Sensors Industry Volume (K Unit), by Application 2024 & 2032
- Figure 69: Australia and New Zealand CO Gas Sensors Industry Revenue Share (%), by Application 2024 & 2032
- Figure 70: Australia and New Zealand CO Gas Sensors Industry Volume Share (%), by Application 2024 & 2032
- Figure 71: Australia and New Zealand CO Gas Sensors Industry Revenue (Million), by Country 2024 & 2032
- Figure 72: Australia and New Zealand CO Gas Sensors Industry Volume (K Unit), by Country 2024 & 2032
- Figure 73: Australia and New Zealand CO Gas Sensors Industry Revenue Share (%), by Country 2024 & 2032
- Figure 74: Australia and New Zealand CO Gas Sensors Industry Volume Share (%), by Country 2024 & 2032
- Figure 75: Latin America CO Gas Sensors Industry Revenue (Million), by Technology 2024 & 2032
- Figure 76: Latin America CO Gas Sensors Industry Volume (K Unit), by Technology 2024 & 2032
- Figure 77: Latin America CO Gas Sensors Industry Revenue Share (%), by Technology 2024 & 2032
- Figure 78: Latin America CO Gas Sensors Industry Volume Share (%), by Technology 2024 & 2032
- Figure 79: Latin America CO Gas Sensors Industry Revenue (Million), by Application 2024 & 2032
- Figure 80: Latin America CO Gas Sensors Industry Volume (K Unit), by Application 2024 & 2032
- Figure 81: Latin America CO Gas Sensors Industry Revenue Share (%), by Application 2024 & 2032
- Figure 82: Latin America CO Gas Sensors Industry Volume Share (%), by Application 2024 & 2032
- Figure 83: Latin America CO Gas Sensors Industry Revenue (Million), by Country 2024 & 2032
- Figure 84: Latin America CO Gas Sensors Industry Volume (K Unit), by Country 2024 & 2032
- Figure 85: Latin America CO Gas Sensors Industry Revenue Share (%), by Country 2024 & 2032
- Figure 86: Latin America CO Gas Sensors Industry Volume Share (%), by Country 2024 & 2032
- Figure 87: Middle East and Africa CO Gas Sensors Industry Revenue (Million), by Technology 2024 & 2032
- Figure 88: Middle East and Africa CO Gas Sensors Industry Volume (K Unit), by Technology 2024 & 2032
- Figure 89: Middle East and Africa CO Gas Sensors Industry Revenue Share (%), by Technology 2024 & 2032
- Figure 90: Middle East and Africa CO Gas Sensors Industry Volume Share (%), by Technology 2024 & 2032
- Figure 91: Middle East and Africa CO Gas Sensors Industry Revenue (Million), by Application 2024 & 2032
- Figure 92: Middle East and Africa CO Gas Sensors Industry Volume (K Unit), by Application 2024 & 2032
- Figure 93: Middle East and Africa CO Gas Sensors Industry Revenue Share (%), by Application 2024 & 2032
- Figure 94: Middle East and Africa CO Gas Sensors Industry Volume Share (%), by Application 2024 & 2032
- Figure 95: Middle East and Africa CO Gas Sensors Industry Revenue (Million), by Country 2024 & 2032
- Figure 96: Middle East and Africa CO Gas Sensors Industry Volume (K Unit), by Country 2024 & 2032
- Figure 97: Middle East and Africa CO Gas Sensors Industry Revenue Share (%), by Country 2024 & 2032
- Figure 98: Middle East and Africa CO Gas Sensors Industry Volume Share (%), by Country 2024 & 2032
List of Tables
- Table 1: Global CO Gas Sensors Industry Revenue Million Forecast, by Region 2019 & 2032
- Table 2: Global CO Gas Sensors Industry Volume K Unit Forecast, by Region 2019 & 2032
- Table 3: Global CO Gas Sensors Industry Revenue Million Forecast, by Technology 2019 & 2032
- Table 4: Global CO Gas Sensors Industry Volume K Unit Forecast, by Technology 2019 & 2032
- Table 5: Global CO Gas Sensors Industry Revenue Million Forecast, by Application 2019 & 2032
- Table 6: Global CO Gas Sensors Industry Volume K Unit Forecast, by Application 2019 & 2032
- Table 7: Global CO Gas Sensors Industry Revenue Million Forecast, by Region 2019 & 2032
- Table 8: Global CO Gas Sensors Industry Volume K Unit Forecast, by Region 2019 & 2032
- Table 9: Global CO Gas Sensors Industry Revenue Million Forecast, by Country 2019 & 2032
- Table 10: Global CO Gas Sensors Industry Volume K Unit Forecast, by Country 2019 & 2032
- Table 11: United States CO Gas Sensors Industry Revenue (Million) Forecast, by Application 2019 & 2032
- Table 12: United States CO Gas Sensors Industry Volume (K Unit) Forecast, by Application 2019 & 2032
- Table 13: Canada CO Gas Sensors Industry Revenue (Million) Forecast, by Application 2019 & 2032
- Table 14: Canada CO Gas Sensors Industry Volume (K Unit) Forecast, by Application 2019 & 2032
- Table 15: Mexico CO Gas Sensors Industry Revenue (Million) Forecast, by Application 2019 & 2032
- Table 16: Mexico CO Gas Sensors Industry Volume (K Unit) Forecast, by Application 2019 & 2032
- Table 17: Global CO Gas Sensors Industry Revenue Million Forecast, by Country 2019 & 2032
- Table 18: Global CO Gas Sensors Industry Volume K Unit Forecast, by Country 2019 & 2032
- Table 19: Germany CO Gas Sensors Industry Revenue (Million) Forecast, by Application 2019 & 2032
- Table 20: Germany CO Gas Sensors Industry Volume (K Unit) Forecast, by Application 2019 & 2032
- Table 21: United Kingdom CO Gas Sensors Industry Revenue (Million) Forecast, by Application 2019 & 2032
- Table 22: United Kingdom CO Gas Sensors Industry Volume (K Unit) Forecast, by Application 2019 & 2032
- Table 23: France CO Gas Sensors Industry Revenue (Million) Forecast, by Application 2019 & 2032
- Table 24: France CO Gas Sensors Industry Volume (K Unit) Forecast, by Application 2019 & 2032
- Table 25: Spain CO Gas Sensors Industry Revenue (Million) Forecast, by Application 2019 & 2032
- Table 26: Spain CO Gas Sensors Industry Volume (K Unit) Forecast, by Application 2019 & 2032
- Table 27: Italy CO Gas Sensors Industry Revenue (Million) Forecast, by Application 2019 & 2032
- Table 28: Italy CO Gas Sensors Industry Volume (K Unit) Forecast, by Application 2019 & 2032
- Table 29: Spain CO Gas Sensors Industry Revenue (Million) Forecast, by Application 2019 & 2032
- Table 30: Spain CO Gas Sensors Industry Volume (K Unit) Forecast, by Application 2019 & 2032
- Table 31: Belgium CO Gas Sensors Industry Revenue (Million) Forecast, by Application 2019 & 2032
- Table 32: Belgium CO Gas Sensors Industry Volume (K Unit) Forecast, by Application 2019 & 2032
- Table 33: Netherland CO Gas Sensors Industry Revenue (Million) Forecast, by Application 2019 & 2032
- Table 34: Netherland CO Gas Sensors Industry Volume (K Unit) Forecast, by Application 2019 & 2032
- Table 35: Nordics CO Gas Sensors Industry Revenue (Million) Forecast, by Application 2019 & 2032
- Table 36: Nordics CO Gas Sensors Industry Volume (K Unit) Forecast, by Application 2019 & 2032
- Table 37: Rest of Europe CO Gas Sensors Industry Revenue (Million) Forecast, by Application 2019 & 2032
- Table 38: Rest of Europe CO Gas Sensors Industry Volume (K Unit) Forecast, by Application 2019 & 2032
- Table 39: Global CO Gas Sensors Industry Revenue Million Forecast, by Country 2019 & 2032
- Table 40: Global CO Gas Sensors Industry Volume K Unit Forecast, by Country 2019 & 2032
- Table 41: China CO Gas Sensors Industry Revenue (Million) Forecast, by Application 2019 & 2032
- Table 42: China CO Gas Sensors Industry Volume (K Unit) Forecast, by Application 2019 & 2032
- Table 43: Japan CO Gas Sensors Industry Revenue (Million) Forecast, by Application 2019 & 2032
- Table 44: Japan CO Gas Sensors Industry Volume (K Unit) Forecast, by Application 2019 & 2032
- Table 45: India CO Gas Sensors Industry Revenue (Million) Forecast, by Application 2019 & 2032
- Table 46: India CO Gas Sensors Industry Volume (K Unit) Forecast, by Application 2019 & 2032
- Table 47: South Korea CO Gas Sensors Industry Revenue (Million) Forecast, by Application 2019 & 2032
- Table 48: South Korea CO Gas Sensors Industry Volume (K Unit) Forecast, by Application 2019 & 2032
- Table 49: Southeast Asia CO Gas Sensors Industry Revenue (Million) Forecast, by Application 2019 & 2032
- Table 50: Southeast Asia CO Gas Sensors Industry Volume (K Unit) Forecast, by Application 2019 & 2032
- Table 51: Australia CO Gas Sensors Industry Revenue (Million) Forecast, by Application 2019 & 2032
- Table 52: Australia CO Gas Sensors Industry Volume (K Unit) Forecast, by Application 2019 & 2032
- Table 53: Indonesia CO Gas Sensors Industry Revenue (Million) Forecast, by Application 2019 & 2032
- Table 54: Indonesia CO Gas Sensors Industry Volume (K Unit) Forecast, by Application 2019 & 2032
- Table 55: Phillipes CO Gas Sensors Industry Revenue (Million) Forecast, by Application 2019 & 2032
- Table 56: Phillipes CO Gas Sensors Industry Volume (K Unit) Forecast, by Application 2019 & 2032
- Table 57: Singapore CO Gas Sensors Industry Revenue (Million) Forecast, by Application 2019 & 2032
- Table 58: Singapore CO Gas Sensors Industry Volume (K Unit) Forecast, by Application 2019 & 2032
- Table 59: Thailandc CO Gas Sensors Industry Revenue (Million) Forecast, by Application 2019 & 2032
- Table 60: Thailandc CO Gas Sensors Industry Volume (K Unit) Forecast, by Application 2019 & 2032
- Table 61: Rest of Asia Pacific CO Gas Sensors Industry Revenue (Million) Forecast, by Application 2019 & 2032
- Table 62: Rest of Asia Pacific CO Gas Sensors Industry Volume (K Unit) Forecast, by Application 2019 & 2032
- Table 63: Global CO Gas Sensors Industry Revenue Million Forecast, by Country 2019 & 2032
- Table 64: Global CO Gas Sensors Industry Volume K Unit Forecast, by Country 2019 & 2032
- Table 65: Brazil CO Gas Sensors Industry Revenue (Million) Forecast, by Application 2019 & 2032
- Table 66: Brazil CO Gas Sensors Industry Volume (K Unit) Forecast, by Application 2019 & 2032
- Table 67: Argentina CO Gas Sensors Industry Revenue (Million) Forecast, by Application 2019 & 2032
- Table 68: Argentina CO Gas Sensors Industry Volume (K Unit) Forecast, by Application 2019 & 2032
- Table 69: Peru CO Gas Sensors Industry Revenue (Million) Forecast, by Application 2019 & 2032
- Table 70: Peru CO Gas Sensors Industry Volume (K Unit) Forecast, by Application 2019 & 2032
- Table 71: Chile CO Gas Sensors Industry Revenue (Million) Forecast, by Application 2019 & 2032
- Table 72: Chile CO Gas Sensors Industry Volume (K Unit) Forecast, by Application 2019 & 2032
- Table 73: Colombia CO Gas Sensors Industry Revenue (Million) Forecast, by Application 2019 & 2032
- Table 74: Colombia CO Gas Sensors Industry Volume (K Unit) Forecast, by Application 2019 & 2032
- Table 75: Ecuador CO Gas Sensors Industry Revenue (Million) Forecast, by Application 2019 & 2032
- Table 76: Ecuador CO Gas Sensors Industry Volume (K Unit) Forecast, by Application 2019 & 2032
- Table 77: Venezuela CO Gas Sensors Industry Revenue (Million) Forecast, by Application 2019 & 2032
- Table 78: Venezuela CO Gas Sensors Industry Volume (K Unit) Forecast, by Application 2019 & 2032
- Table 79: Rest of South America CO Gas Sensors Industry Revenue (Million) Forecast, by Application 2019 & 2032
- Table 80: Rest of South America CO Gas Sensors Industry Volume (K Unit) Forecast, by Application 2019 & 2032
- Table 81: Global CO Gas Sensors Industry Revenue Million Forecast, by Country 2019 & 2032
- Table 82: Global CO Gas Sensors Industry Volume K Unit Forecast, by Country 2019 & 2032
- Table 83: United States CO Gas Sensors Industry Revenue (Million) Forecast, by Application 2019 & 2032
- Table 84: United States CO Gas Sensors Industry Volume (K Unit) Forecast, by Application 2019 & 2032
- Table 85: Canada CO Gas Sensors Industry Revenue (Million) Forecast, by Application 2019 & 2032
- Table 86: Canada CO Gas Sensors Industry Volume (K Unit) Forecast, by Application 2019 & 2032
- Table 87: Mexico CO Gas Sensors Industry Revenue (Million) Forecast, by Application 2019 & 2032
- Table 88: Mexico CO Gas Sensors Industry Volume (K Unit) Forecast, by Application 2019 & 2032
- Table 89: Global CO Gas Sensors Industry Revenue Million Forecast, by Country 2019 & 2032
- Table 90: Global CO Gas Sensors Industry Volume K Unit Forecast, by Country 2019 & 2032
- Table 91: United Arab Emirates CO Gas Sensors Industry Revenue (Million) Forecast, by Application 2019 & 2032
- Table 92: United Arab Emirates CO Gas Sensors Industry Volume (K Unit) Forecast, by Application 2019 & 2032
- Table 93: Saudi Arabia CO Gas Sensors Industry Revenue (Million) Forecast, by Application 2019 & 2032
- Table 94: Saudi Arabia CO Gas Sensors Industry Volume (K Unit) Forecast, by Application 2019 & 2032
- Table 95: South Africa CO Gas Sensors Industry Revenue (Million) Forecast, by Application 2019 & 2032
- Table 96: South Africa CO Gas Sensors Industry Volume (K Unit) Forecast, by Application 2019 & 2032
- Table 97: Rest of Middle East and Africa CO Gas Sensors Industry Revenue (Million) Forecast, by Application 2019 & 2032
- Table 98: Rest of Middle East and Africa CO Gas Sensors Industry Volume (K Unit) Forecast, by Application 2019 & 2032
- Table 99: Global CO Gas Sensors Industry Revenue Million Forecast, by Technology 2019 & 2032
- Table 100: Global CO Gas Sensors Industry Volume K Unit Forecast, by Technology 2019 & 2032
- Table 101: Global CO Gas Sensors Industry Revenue Million Forecast, by Application 2019 & 2032
- Table 102: Global CO Gas Sensors Industry Volume K Unit Forecast, by Application 2019 & 2032
- Table 103: Global CO Gas Sensors Industry Revenue Million Forecast, by Country 2019 & 2032
- Table 104: Global CO Gas Sensors Industry Volume K Unit Forecast, by Country 2019 & 2032
- Table 105: Global CO Gas Sensors Industry Revenue Million Forecast, by Technology 2019 & 2032
- Table 106: Global CO Gas Sensors Industry Volume K Unit Forecast, by Technology 2019 & 2032
- Table 107: Global CO Gas Sensors Industry Revenue Million Forecast, by Application 2019 & 2032
- Table 108: Global CO Gas Sensors Industry Volume K Unit Forecast, by Application 2019 & 2032
- Table 109: Global CO Gas Sensors Industry Revenue Million Forecast, by Country 2019 & 2032
- Table 110: Global CO Gas Sensors Industry Volume K Unit Forecast, by Country 2019 & 2032
- Table 111: Global CO Gas Sensors Industry Revenue Million Forecast, by Technology 2019 & 2032
- Table 112: Global CO Gas Sensors Industry Volume K Unit Forecast, by Technology 2019 & 2032
- Table 113: Global CO Gas Sensors Industry Revenue Million Forecast, by Application 2019 & 2032
- Table 114: Global CO Gas Sensors Industry Volume K Unit Forecast, by Application 2019 & 2032
- Table 115: Global CO Gas Sensors Industry Revenue Million Forecast, by Country 2019 & 2032
- Table 116: Global CO Gas Sensors Industry Volume K Unit Forecast, by Country 2019 & 2032
- Table 117: Global CO Gas Sensors Industry Revenue Million Forecast, by Technology 2019 & 2032
- Table 118: Global CO Gas Sensors Industry Volume K Unit Forecast, by Technology 2019 & 2032
- Table 119: Global CO Gas Sensors Industry Revenue Million Forecast, by Application 2019 & 2032
- Table 120: Global CO Gas Sensors Industry Volume K Unit Forecast, by Application 2019 & 2032
- Table 121: Global CO Gas Sensors Industry Revenue Million Forecast, by Country 2019 & 2032
- Table 122: Global CO Gas Sensors Industry Volume K Unit Forecast, by Country 2019 & 2032
- Table 123: Global CO Gas Sensors Industry Revenue Million Forecast, by Technology 2019 & 2032
- Table 124: Global CO Gas Sensors Industry Volume K Unit Forecast, by Technology 2019 & 2032
- Table 125: Global CO Gas Sensors Industry Revenue Million Forecast, by Application 2019 & 2032
- Table 126: Global CO Gas Sensors Industry Volume K Unit Forecast, by Application 2019 & 2032
- Table 127: Global CO Gas Sensors Industry Revenue Million Forecast, by Country 2019 & 2032
- Table 128: Global CO Gas Sensors Industry Volume K Unit Forecast, by Country 2019 & 2032
- Table 129: Global CO Gas Sensors Industry Revenue Million Forecast, by Technology 2019 & 2032
- Table 130: Global CO Gas Sensors Industry Volume K Unit Forecast, by Technology 2019 & 2032
- Table 131: Global CO Gas Sensors Industry Revenue Million Forecast, by Application 2019 & 2032
- Table 132: Global CO Gas Sensors Industry Volume K Unit Forecast, by Application 2019 & 2032
- Table 133: Global CO Gas Sensors Industry Revenue Million Forecast, by Country 2019 & 2032
- Table 134: Global CO Gas Sensors Industry Volume K Unit Forecast, by Country 2019 & 2032
Frequently Asked Questions
1. What is the projected Compound Annual Growth Rate (CAGR) of the CO Gas Sensors Industry?
The projected CAGR is approximately 6.20%.
2. Which companies are prominent players in the CO Gas Sensors Industry?
Key companies in the market include ABB Ltd, Aeroqual Ltd, Honeywel, NGK Insulators Ltd, Siemens AG, Trolex Ltd, Alphasense, GfG Europe Ltd, Robert Bosch GmbH, Yokogawa Electric Corporation, Dynament Ltd.
3. What are the main segments of the CO Gas Sensors Industry?
The market segments include Technology, Application.
4. Can you provide details about the market size?
The market size is estimated to be USD 1.30 Million as of 2022.
5. What are some drivers contributing to market growth?
Government Regulations to Ensure Safety in Work Places; Increasing Need for Emission Control Standards.
6. What are the notable trends driving market growth?
The Petrochemical Segment to Witness Growth.
7. Are there any restraints impacting market growth?
Lack of Awareness of Safety Gains in SME; Cost of Maintenance and Low Product Differentiation.
8. Can you provide examples of recent developments in the market?
March 2024: Teledyne Gas and Flame Detection launched the high-performance OLCT 100-XP-MS range of flammable gas detectors, incorporating cutting-edge MEMS (micro-electromechanical systems) sensor technology. By offering catalytic oxidation, IR, and MEMS sensor technologies in a single device, the OLCT100-XP-MS represents a holistic solution that revolutionizes flammable gas detection, regardless of environmental or operational constraints.
9. What pricing options are available for accessing the report?
Pricing options include single-user, multi-user, and enterprise licenses priced at USD 4750, USD 5250, and USD 8750 respectively.
10. Is the market size provided in terms of value or volume?
The market size is provided in terms of value, measured in Million and volume, measured in K Unit.
11. Are there any specific market keywords associated with the report?
Yes, the market keyword associated with the report is "CO Gas Sensors Industry," which aids in identifying and referencing the specific market segment covered.
12. How do I determine which pricing option suits my needs best?
The pricing options vary based on user requirements and access needs. Individual users may opt for single-user licenses, while businesses requiring broader access may choose multi-user or enterprise licenses for cost-effective access to the report.
13. Are there any additional resources or data provided in the CO Gas Sensors Industry report?
While the report offers comprehensive insights, it's advisable to review the specific contents or supplementary materials provided to ascertain if additional resources or data are available.
14. How can I stay updated on further developments or reports in the CO Gas Sensors Industry?
To stay informed about further developments, trends, and reports in the CO Gas Sensors Industry, consider subscribing to industry newsletters, following relevant companies and organizations, or regularly checking reputable industry news sources and publications.
Methodology
Step 1 - Identification of Relevant Samples Size from Population Database


Step 2 - Approaches for Defining Global Market Size (Value, Volume* & Price*)

Note*: In applicable scenarios
Step 3 - Data Sources
Primary Research
- Web Analytics
- Survey Reports
- Research Institute
- Latest Research Reports
- Opinion Leaders
Secondary Research
- Annual Reports
- White Paper
- Latest Press Release
- Industry Association
- Paid Database
- Investor Presentations

Step 4 - Data Triangulation
Involves using different sources of information in order to increase the validity of a study
These sources are likely to be stakeholders in a program - participants, other researchers, program staff, other community members, and so on.
Then we put all data in single framework & apply various statistical tools to find out the dynamic on the market.
During the analysis stage, feedback from the stakeholder groups would be compared to determine areas of agreement as well as areas of divergence
