
Key Insights
The global Data Visualization market is poised for substantial expansion, projected to reach a remarkable USD 9.84 billion by 2025, with an impressive Compound Annual Growth Rate (CAGR) of 10.95% anticipated through 2033. This robust growth is fueled by the escalating need for businesses across all sectors to derive actionable insights from increasingly complex datasets. Organizations are actively seeking to enhance decision-making, improve operational efficiency, and gain a competitive edge through sophisticated visual representations of data. The proliferation of big data, coupled with advancements in AI and machine learning that enable more dynamic and interactive visualizations, are significant market drivers. Furthermore, the growing adoption of cloud-based solutions is democratizing access to powerful data visualization tools, allowing even smaller businesses to leverage these capabilities.
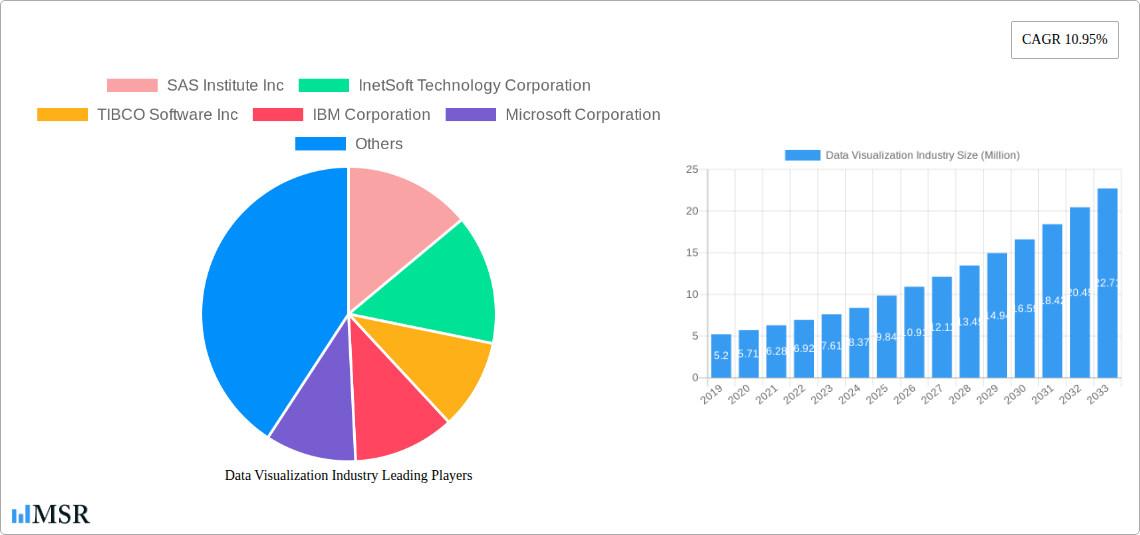
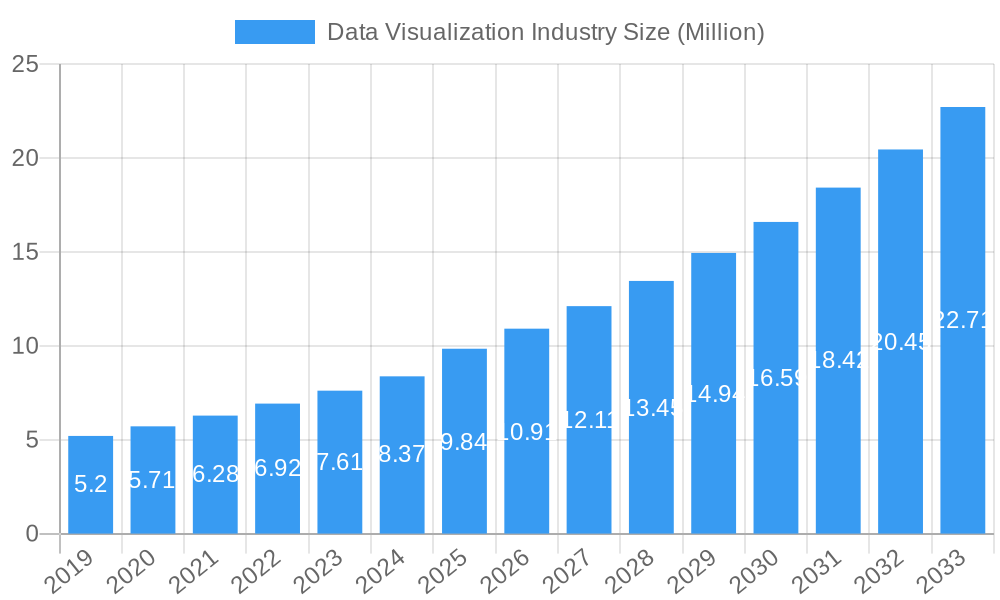
Data Visualization Industry Market Size (In Million)
Key segments contributing to this market surge include deployment modes like cloud/on-demand, which offers scalability and cost-effectiveness, and end-user industries such as BFSI, IT and Telecommunication, and Retail/E-commerce, all grappling with massive data volumes and a critical need for real-time analytics. While the market presents immense opportunities, certain restraints, such as the complexity of integrating new visualization tools with legacy systems and the initial investment costs for comprehensive solutions, need to be navigated. Leading players like SAS Institute Inc., TIBCO Software Inc., IBM Corporation, Microsoft Corporation, and Salesforce.com Inc. (Tableau Software Inc.) are at the forefront, driving innovation and offering comprehensive suites of data visualization and business intelligence solutions to meet diverse organizational needs. The focus is increasingly on user-friendly interfaces, predictive analytics integration, and self-service BI capabilities.
Data Visualization Industry Company Market Share
Unlock the future of data visualization market with this in-depth report, providing market size predictions, CAGR analysis, and strategic insights for stakeholders navigating the dynamic business intelligence and data analytics landscape. This comprehensive study covers a study period of 2019–2033, with a base year of 2025 and a forecast period from 2025–2033. Gain actionable intelligence on leading data visualization companies, emerging data visualization trends, and critical data visualization solutions that are shaping industries from BFSI and IT and Telecommunication to Retail/E-commerce and Manufacturing.
Data Visualization Industry Market Concentration & Dynamics
The data visualization industry exhibits a moderate to high market concentration, with a significant portion of the market share held by established giants. Innovation ecosystems are thriving, driven by advancements in AI, machine learning, and real-time data processing. Regulatory frameworks are evolving, particularly concerning data privacy and security, influencing deployment choices towards more secure cloud data visualization solutions. Substitute products, while present in basic charting tools, struggle to compete with the advanced analytical and interactive capabilities of leading business intelligence platforms. End-user trends clearly indicate a growing demand for intuitive, self-service data visualization tools across all organizational departments, including Executive Management, Marketing, Operations, Finance, and Sales. Mergers and Acquisitions (M&A) activity remains robust, with an estimated xx M&A deals annually, as larger players acquire innovative startups to enhance their data analytics offerings and expand their market reach. Key players like SAS Institute Inc, InetSoft Technology Corporation, TIBCO Software Inc, IBM Corporation, Microsoft Corporation, Pentaho Corporation, Dundas Data Visualization Inc, Information Builders, Oracle Corporation, Salesforce com Inc (Tableau Software Inc), SAP SE, and MicroStrategy Inc are constantly vying for market dominance.
Data Visualization Industry Industry Insights & Trends
The data visualization market is experiencing robust growth, fueled by the ever-increasing volume of data generated across industries and the critical need for actionable insights. The global data visualization market size is projected to reach an estimated US$ 45,000 Million by 2025 and is expected to grow at a Compound Annual Growth Rate (CAGR) of approximately 15% during the forecast period of 2025–2033. Technological disruptions are at the forefront, with the integration of Artificial Intelligence (AI) and Machine Learning (ML) into data visualization software enabling predictive analytics, automated insights, and personalized dashboards. Evolving consumer behaviors, particularly the demand for self-service analytics and democratized data access, are pushing vendors to develop user-friendly interfaces and low-code/no-code solutions. The shift towards cloud-based data visualization is a significant trend, offering scalability, flexibility, and cost-effectiveness for businesses of all sizes. Furthermore, the demand for real-time data visualization is escalating, allowing organizations to make rapid, informed decisions in dynamic environments. The report analyzes historical data from 2019–2024 to provide a solid foundation for these forward-looking projections.
Key Markets & Segments Leading Data Visualization Industry
The data visualization market is witnessing significant traction across several key regions and segments. North America currently leads the market, driven by a mature technological infrastructure and a high adoption rate of advanced analytics solutions by its BFSI, IT and Telecommunication, and Retail/E-commerce sectors. The cloud/on-demand deployment mode is overwhelmingly dominant, accounting for over XX% of the market, offering superior scalability and accessibility compared to on-premise solutions.
Organizational Departments:
- Executive Management: Driven by the need for high-level strategic insights and performance monitoring.
- Marketing: Leveraging data visualization for customer segmentation, campaign analysis, and ROI tracking.
- Sales: Utilizing real-time sales dashboards for performance tracking and lead management.
- Finance: Employing business intelligence tools for financial reporting, forecasting, and risk management.
- Operations: Benefiting from real-time operational dashboards for efficiency improvements and anomaly detection.
Deployment Modes:
- Cloud/On-demand: Dominant due to flexibility, scalability, and reduced IT overhead. Estimated XX% market share.
- On-premise: Still relevant for highly regulated industries with stringent data security requirements. Estimated XX% market share.
End Users:
- BFSI: Leading the charge with extensive use of data analytics for risk assessment, fraud detection, and customer insights.
- IT and Telecommunication: Utilizing data visualization for network performance monitoring, customer churn prediction, and service optimization.
- Retail/E-commerce: Employing business intelligence for inventory management, sales forecasting, and personalized customer experiences.
- Manufacturing: Increasingly adopting industrial intelligence dashboards for supply chain optimization, predictive maintenance, and production efficiency.
- Government: Using data visualization for public service delivery, policy analysis, and resource allocation.
Data Visualization Industry Product Developments
Product development in the data visualization industry is characterized by a relentless pursuit of enhanced interactivity, AI-driven insights, and seamless integration. Innovations are focused on empowering users with self-service capabilities, enabling them to explore complex datasets and generate actionable insights without extensive technical expertise. The integration of AI and ML is leading to predictive analytics features, anomaly detection, and automated report generation. Furthermore, vendors are focusing on creating visually appealing and highly customizable dashboards that can be tailored to specific industry needs, such as advanced industrial intelligence dashboards for manufacturing or sophisticated subsurface visualization for the energy sector. These advancements provide a significant competitive edge, allowing businesses to derive deeper value from their data.
Challenges in the Data Visualization Industry Market
Despite its rapid growth, the data visualization market faces several challenges. Data quality and integrity remain paramount concerns, as poor data can lead to flawed insights. The increasing complexity of data sources and the need for real-time processing can strain existing infrastructure. Furthermore, a lack of skilled personnel to effectively utilize advanced data analytics tools and interpret insights presents a significant barrier for some organizations. Competitive pressures are intense, with numerous vendors vying for market share, leading to pricing challenges. Regulatory compliance, especially concerning data privacy, adds another layer of complexity.
Forces Driving Data Visualization Industry Growth
Several powerful forces are propelling the data visualization industry forward. The exponential growth of data across all sectors necessitates sophisticated tools for analysis and interpretation. The increasing adoption of cloud computing provides a scalable and accessible platform for data visualization solutions. The demand for real-time decision-making is driving the need for live dashboards and immediate insights. Furthermore, the growing awareness of the benefits of data-driven decision-making among businesses of all sizes is a significant catalyst for adoption. The continuous advancements in AI and ML are also opening new avenues for predictive and prescriptive analytics.
Challenges in the Data Visualization Industry Market
Long-term growth catalysts in the data visualization industry are deeply intertwined with innovation and market expansion. The ongoing development of more intuitive and user-friendly interfaces will democratize access to powerful analytical capabilities, broadening the user base. Strategic partnerships between business intelligence providers and other technology firms, particularly in AI and cloud services, will further enhance the capabilities of data visualization platforms. Market expansion into emerging economies, where the adoption of data analytics is still nascent but rapidly growing, represents a substantial opportunity for sustained growth and penetration.
Emerging Opportunities in Data Visualization Industry
Emerging opportunities in the data visualization industry are ripe for exploration. The rise of the Internet of Things (IoT) is generating vast amounts of sensor data, creating a significant demand for specialized IoT data visualization tools. The increasing focus on sustainability and ESG (Environmental, Social, and Governance) reporting is opening up new markets for data visualization solutions focused on tracking and reporting these metrics. Personalized analytics for customer engagement and hyper-segmentation in marketing are also becoming increasingly important. Furthermore, the metaverse and immersive technologies present future opportunities for novel ways of interacting with and visualizing data in 3D environments.
Leading Players in the Data Visualization Industry Sector
- SAS Institute Inc
- InetSoft Technology Corporation
- TIBCO Software Inc
- IBM Corporation
- Microsoft Corporation
- Pentaho Corporation
- Dundas Data Visualization Inc
- Information Builders
- Oracle Corporation
- Salesforce com Inc (Tableau Software Inc)
- SAP SE
- MicroStrategy Inc
Key Milestones in Data Visualization Industry Industry
- September 2022: SymphonyAI Industrial unveiled KPI 360, an AI-driven solution for manufacturing, offering real-time data monitoring and prediction via a comprehensive industrial intelligence dashboard.
- January 2022: INT released the latest version of its IVAAP platform, enhancing subsurface visualization and analytics for energy data with full OSDU Data Platform compatibility and expanded map-based search and 3D seismic visualization capabilities.
Strategic Outlook for Data Visualization Industry Market
The strategic outlook for the data visualization industry market is exceptionally positive. Growth accelerators include the continued integration of AI and ML for advanced analytics, the expansion of cloud-based solutions, and the increasing demand for self-service business intelligence tools. The market is poised for significant innovation, with a focus on real-time data processing, predictive capabilities, and user-centric design. Strategic opportunities lie in catering to specialized industry needs, such as advanced manufacturing analytics and ESG reporting, as well as expanding into underserved geographical markets. Vendors that prioritize agility, continuous innovation, and deep customer understanding will be best positioned for sustained success in this rapidly evolving landscape.
Data Visualization Industry Segmentation
-
1. Organizational Department
- 1.1. Executive Management
- 1.2. Marketing
- 1.3. Operations
- 1.4. Finance
- 1.5. Sales
- 1.6. Other Organizational Departments
-
2. Deployment Mode
- 2.1. On-premise
- 2.2. Cloud/On-demand
-
3. End User
- 3.1. BFSI
- 3.2. IT and Telecommunication
- 3.3. Retail/E-commerce
- 3.4. Education
- 3.5. Manufacturing
- 3.6. Government
- 3.7. Other End Users
Data Visualization Industry Segmentation By Geography
- 1. North America
- 2. Europe
- 3. Asia Pacific
- 4. Latin America
- 5. Middle East and Africa
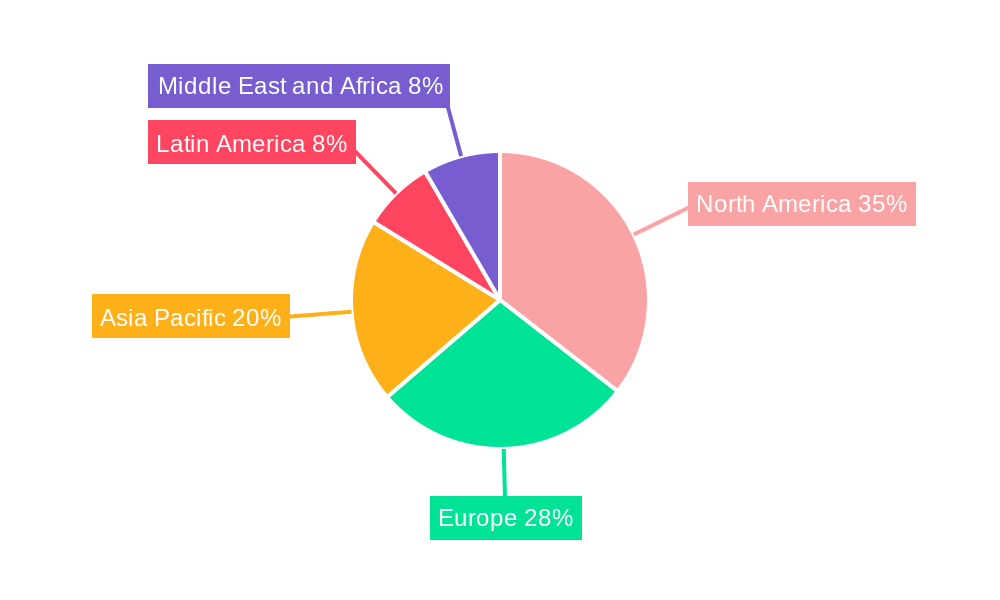
Data Visualization Industry Regional Market Share
Geographic Coverage of Data Visualization Industry
Data Visualization Industry REPORT HIGHLIGHTS
| Aspects | Details |
|---|---|
| Study Period | 2020-2034 |
| Base Year | 2025 |
| Estimated Year | 2026 |
| Forecast Period | 2026-2034 |
| Historical Period | 2020-2025 |
| Growth Rate | CAGR of 10.95% from 2020-2034 |
| Segmentation |
|
Table of Contents
- 1. Introduction
- 1.1. Research Scope
- 1.2. Market Segmentation
- 1.3. Research Methodology
- 1.4. Definitions and Assumptions
- 2. Executive Summary
- 2.1. Introduction
- 3. Market Dynamics
- 3.1. Introduction
- 3.2. Market Drivers
- 3.2.1. Cloud Deployment of Data Visualization Solutions; Increasing Need for Quick Decision Making
- 3.3. Market Restrains
- 3.3.1. Lack of Tech Savvy and Skilled Workforce/Inability
- 3.4. Market Trends
- 3.4.1. Retail Segment to Witness Significant Growth
- 4. Market Factor Analysis
- 4.1. Porters Five Forces
- 4.2. Supply/Value Chain
- 4.3. PESTEL analysis
- 4.4. Market Entropy
- 4.5. Patent/Trademark Analysis
- 5. Global Data Visualization Industry Analysis, Insights and Forecast, 2020-2032
- 5.1. Market Analysis, Insights and Forecast - by Organizational Department
- 5.1.1. Executive Management
- 5.1.2. Marketing
- 5.1.3. Operations
- 5.1.4. Finance
- 5.1.5. Sales
- 5.1.6. Other Organizational Departments
- 5.2. Market Analysis, Insights and Forecast - by Deployment Mode
- 5.2.1. On-premise
- 5.2.2. Cloud/On-demand
- 5.3. Market Analysis, Insights and Forecast - by End User
- 5.3.1. BFSI
- 5.3.2. IT and Telecommunication
- 5.3.3. Retail/E-commerce
- 5.3.4. Education
- 5.3.5. Manufacturing
- 5.3.6. Government
- 5.3.7. Other End Users
- 5.4. Market Analysis, Insights and Forecast - by Region
- 5.4.1. North America
- 5.4.2. Europe
- 5.4.3. Asia Pacific
- 5.4.4. Latin America
- 5.4.5. Middle East and Africa
- 5.1. Market Analysis, Insights and Forecast - by Organizational Department
- 6. North America Data Visualization Industry Analysis, Insights and Forecast, 2020-2032
- 6.1. Market Analysis, Insights and Forecast - by Organizational Department
- 6.1.1. Executive Management
- 6.1.2. Marketing
- 6.1.3. Operations
- 6.1.4. Finance
- 6.1.5. Sales
- 6.1.6. Other Organizational Departments
- 6.2. Market Analysis, Insights and Forecast - by Deployment Mode
- 6.2.1. On-premise
- 6.2.2. Cloud/On-demand
- 6.3. Market Analysis, Insights and Forecast - by End User
- 6.3.1. BFSI
- 6.3.2. IT and Telecommunication
- 6.3.3. Retail/E-commerce
- 6.3.4. Education
- 6.3.5. Manufacturing
- 6.3.6. Government
- 6.3.7. Other End Users
- 6.1. Market Analysis, Insights and Forecast - by Organizational Department
- 7. Europe Data Visualization Industry Analysis, Insights and Forecast, 2020-2032
- 7.1. Market Analysis, Insights and Forecast - by Organizational Department
- 7.1.1. Executive Management
- 7.1.2. Marketing
- 7.1.3. Operations
- 7.1.4. Finance
- 7.1.5. Sales
- 7.1.6. Other Organizational Departments
- 7.2. Market Analysis, Insights and Forecast - by Deployment Mode
- 7.2.1. On-premise
- 7.2.2. Cloud/On-demand
- 7.3. Market Analysis, Insights and Forecast - by End User
- 7.3.1. BFSI
- 7.3.2. IT and Telecommunication
- 7.3.3. Retail/E-commerce
- 7.3.4. Education
- 7.3.5. Manufacturing
- 7.3.6. Government
- 7.3.7. Other End Users
- 7.1. Market Analysis, Insights and Forecast - by Organizational Department
- 8. Asia Pacific Data Visualization Industry Analysis, Insights and Forecast, 2020-2032
- 8.1. Market Analysis, Insights and Forecast - by Organizational Department
- 8.1.1. Executive Management
- 8.1.2. Marketing
- 8.1.3. Operations
- 8.1.4. Finance
- 8.1.5. Sales
- 8.1.6. Other Organizational Departments
- 8.2. Market Analysis, Insights and Forecast - by Deployment Mode
- 8.2.1. On-premise
- 8.2.2. Cloud/On-demand
- 8.3. Market Analysis, Insights and Forecast - by End User
- 8.3.1. BFSI
- 8.3.2. IT and Telecommunication
- 8.3.3. Retail/E-commerce
- 8.3.4. Education
- 8.3.5. Manufacturing
- 8.3.6. Government
- 8.3.7. Other End Users
- 8.1. Market Analysis, Insights and Forecast - by Organizational Department
- 9. Latin America Data Visualization Industry Analysis, Insights and Forecast, 2020-2032
- 9.1. Market Analysis, Insights and Forecast - by Organizational Department
- 9.1.1. Executive Management
- 9.1.2. Marketing
- 9.1.3. Operations
- 9.1.4. Finance
- 9.1.5. Sales
- 9.1.6. Other Organizational Departments
- 9.2. Market Analysis, Insights and Forecast - by Deployment Mode
- 9.2.1. On-premise
- 9.2.2. Cloud/On-demand
- 9.3. Market Analysis, Insights and Forecast - by End User
- 9.3.1. BFSI
- 9.3.2. IT and Telecommunication
- 9.3.3. Retail/E-commerce
- 9.3.4. Education
- 9.3.5. Manufacturing
- 9.3.6. Government
- 9.3.7. Other End Users
- 9.1. Market Analysis, Insights and Forecast - by Organizational Department
- 10. Middle East and Africa Data Visualization Industry Analysis, Insights and Forecast, 2020-2032
- 10.1. Market Analysis, Insights and Forecast - by Organizational Department
- 10.1.1. Executive Management
- 10.1.2. Marketing
- 10.1.3. Operations
- 10.1.4. Finance
- 10.1.5. Sales
- 10.1.6. Other Organizational Departments
- 10.2. Market Analysis, Insights and Forecast - by Deployment Mode
- 10.2.1. On-premise
- 10.2.2. Cloud/On-demand
- 10.3. Market Analysis, Insights and Forecast - by End User
- 10.3.1. BFSI
- 10.3.2. IT and Telecommunication
- 10.3.3. Retail/E-commerce
- 10.3.4. Education
- 10.3.5. Manufacturing
- 10.3.6. Government
- 10.3.7. Other End Users
- 10.1. Market Analysis, Insights and Forecast - by Organizational Department
- 11. North America Data Visualization Industry Analysis, Insights and Forecast, 2020-2032
- 11.1. Market Analysis, Insights and Forecast - By Country/Sub-region
- 11.1.1.
- 12. Europe Data Visualization Industry Analysis, Insights and Forecast, 2020-2032
- 12.1. Market Analysis, Insights and Forecast - By Country/Sub-region
- 12.1.1.
- 13. Asia Pacific Data Visualization Industry Analysis, Insights and Forecast, 2020-2032
- 13.1. Market Analysis, Insights and Forecast - By Country/Sub-region
- 13.1.1.
- 14. Latin America Data Visualization Industry Analysis, Insights and Forecast, 2020-2032
- 14.1. Market Analysis, Insights and Forecast - By Country/Sub-region
- 14.1.1.
- 15. Middle East and Africa Data Visualization Industry Analysis, Insights and Forecast, 2020-2032
- 15.1. Market Analysis, Insights and Forecast - By Country/Sub-region
- 15.1.1.
- 16. Competitive Analysis
- 16.1. Global Market Share Analysis 2025
- 16.2. Company Profiles
- 16.2.1 SAS Institute Inc
- 16.2.1.1. Overview
- 16.2.1.2. Products
- 16.2.1.3. SWOT Analysis
- 16.2.1.4. Recent Developments
- 16.2.1.5. Financials (Based on Availability)
- 16.2.2 InetSoft Technology Corporation
- 16.2.2.1. Overview
- 16.2.2.2. Products
- 16.2.2.3. SWOT Analysis
- 16.2.2.4. Recent Developments
- 16.2.2.5. Financials (Based on Availability)
- 16.2.3 TIBCO Software Inc
- 16.2.3.1. Overview
- 16.2.3.2. Products
- 16.2.3.3. SWOT Analysis
- 16.2.3.4. Recent Developments
- 16.2.3.5. Financials (Based on Availability)
- 16.2.4 IBM Corporation
- 16.2.4.1. Overview
- 16.2.4.2. Products
- 16.2.4.3. SWOT Analysis
- 16.2.4.4. Recent Developments
- 16.2.4.5. Financials (Based on Availability)
- 16.2.5 Microsoft Corporation
- 16.2.5.1. Overview
- 16.2.5.2. Products
- 16.2.5.3. SWOT Analysis
- 16.2.5.4. Recent Developments
- 16.2.5.5. Financials (Based on Availability)
- 16.2.6 Pentaho Corporation
- 16.2.6.1. Overview
- 16.2.6.2. Products
- 16.2.6.3. SWOT Analysis
- 16.2.6.4. Recent Developments
- 16.2.6.5. Financials (Based on Availability)
- 16.2.7 Dundas Data Visualization Inc
- 16.2.7.1. Overview
- 16.2.7.2. Products
- 16.2.7.3. SWOT Analysis
- 16.2.7.4. Recent Developments
- 16.2.7.5. Financials (Based on Availability)
- 16.2.8 Information Builders
- 16.2.8.1. Overview
- 16.2.8.2. Products
- 16.2.8.3. SWOT Analysis
- 16.2.8.4. Recent Developments
- 16.2.8.5. Financials (Based on Availability)
- 16.2.9 Oracle Corporation
- 16.2.9.1. Overview
- 16.2.9.2. Products
- 16.2.9.3. SWOT Analysis
- 16.2.9.4. Recent Developments
- 16.2.9.5. Financials (Based on Availability)
- 16.2.10 Salesforce com Inc (Tableau Software Inc )
- 16.2.10.1. Overview
- 16.2.10.2. Products
- 16.2.10.3. SWOT Analysis
- 16.2.10.4. Recent Developments
- 16.2.10.5. Financials (Based on Availability)
- 16.2.11 SAP SE
- 16.2.11.1. Overview
- 16.2.11.2. Products
- 16.2.11.3. SWOT Analysis
- 16.2.11.4. Recent Developments
- 16.2.11.5. Financials (Based on Availability)
- 16.2.12 MicroStrategy Inc *List Not Exhaustive
- 16.2.12.1. Overview
- 16.2.12.2. Products
- 16.2.12.3. SWOT Analysis
- 16.2.12.4. Recent Developments
- 16.2.12.5. Financials (Based on Availability)
- 16.2.1 SAS Institute Inc
List of Figures
- Figure 1: Global Data Visualization Industry Revenue Breakdown (Million, %) by Region 2025 & 2033
- Figure 2: North America Data Visualization Industry Revenue (Million), by Country 2025 & 2033
- Figure 3: North America Data Visualization Industry Revenue Share (%), by Country 2025 & 2033
- Figure 4: Europe Data Visualization Industry Revenue (Million), by Country 2025 & 2033
- Figure 5: Europe Data Visualization Industry Revenue Share (%), by Country 2025 & 2033
- Figure 6: Asia Pacific Data Visualization Industry Revenue (Million), by Country 2025 & 2033
- Figure 7: Asia Pacific Data Visualization Industry Revenue Share (%), by Country 2025 & 2033
- Figure 8: Latin America Data Visualization Industry Revenue (Million), by Country 2025 & 2033
- Figure 9: Latin America Data Visualization Industry Revenue Share (%), by Country 2025 & 2033
- Figure 10: Middle East and Africa Data Visualization Industry Revenue (Million), by Country 2025 & 2033
- Figure 11: Middle East and Africa Data Visualization Industry Revenue Share (%), by Country 2025 & 2033
- Figure 12: North America Data Visualization Industry Revenue (Million), by Organizational Department 2025 & 2033
- Figure 13: North America Data Visualization Industry Revenue Share (%), by Organizational Department 2025 & 2033
- Figure 14: North America Data Visualization Industry Revenue (Million), by Deployment Mode 2025 & 2033
- Figure 15: North America Data Visualization Industry Revenue Share (%), by Deployment Mode 2025 & 2033
- Figure 16: North America Data Visualization Industry Revenue (Million), by End User 2025 & 2033
- Figure 17: North America Data Visualization Industry Revenue Share (%), by End User 2025 & 2033
- Figure 18: North America Data Visualization Industry Revenue (Million), by Country 2025 & 2033
- Figure 19: North America Data Visualization Industry Revenue Share (%), by Country 2025 & 2033
- Figure 20: Europe Data Visualization Industry Revenue (Million), by Organizational Department 2025 & 2033
- Figure 21: Europe Data Visualization Industry Revenue Share (%), by Organizational Department 2025 & 2033
- Figure 22: Europe Data Visualization Industry Revenue (Million), by Deployment Mode 2025 & 2033
- Figure 23: Europe Data Visualization Industry Revenue Share (%), by Deployment Mode 2025 & 2033
- Figure 24: Europe Data Visualization Industry Revenue (Million), by End User 2025 & 2033
- Figure 25: Europe Data Visualization Industry Revenue Share (%), by End User 2025 & 2033
- Figure 26: Europe Data Visualization Industry Revenue (Million), by Country 2025 & 2033
- Figure 27: Europe Data Visualization Industry Revenue Share (%), by Country 2025 & 2033
- Figure 28: Asia Pacific Data Visualization Industry Revenue (Million), by Organizational Department 2025 & 2033
- Figure 29: Asia Pacific Data Visualization Industry Revenue Share (%), by Organizational Department 2025 & 2033
- Figure 30: Asia Pacific Data Visualization Industry Revenue (Million), by Deployment Mode 2025 & 2033
- Figure 31: Asia Pacific Data Visualization Industry Revenue Share (%), by Deployment Mode 2025 & 2033
- Figure 32: Asia Pacific Data Visualization Industry Revenue (Million), by End User 2025 & 2033
- Figure 33: Asia Pacific Data Visualization Industry Revenue Share (%), by End User 2025 & 2033
- Figure 34: Asia Pacific Data Visualization Industry Revenue (Million), by Country 2025 & 2033
- Figure 35: Asia Pacific Data Visualization Industry Revenue Share (%), by Country 2025 & 2033
- Figure 36: Latin America Data Visualization Industry Revenue (Million), by Organizational Department 2025 & 2033
- Figure 37: Latin America Data Visualization Industry Revenue Share (%), by Organizational Department 2025 & 2033
- Figure 38: Latin America Data Visualization Industry Revenue (Million), by Deployment Mode 2025 & 2033
- Figure 39: Latin America Data Visualization Industry Revenue Share (%), by Deployment Mode 2025 & 2033
- Figure 40: Latin America Data Visualization Industry Revenue (Million), by End User 2025 & 2033
- Figure 41: Latin America Data Visualization Industry Revenue Share (%), by End User 2025 & 2033
- Figure 42: Latin America Data Visualization Industry Revenue (Million), by Country 2025 & 2033
- Figure 43: Latin America Data Visualization Industry Revenue Share (%), by Country 2025 & 2033
- Figure 44: Middle East and Africa Data Visualization Industry Revenue (Million), by Organizational Department 2025 & 2033
- Figure 45: Middle East and Africa Data Visualization Industry Revenue Share (%), by Organizational Department 2025 & 2033
- Figure 46: Middle East and Africa Data Visualization Industry Revenue (Million), by Deployment Mode 2025 & 2033
- Figure 47: Middle East and Africa Data Visualization Industry Revenue Share (%), by Deployment Mode 2025 & 2033
- Figure 48: Middle East and Africa Data Visualization Industry Revenue (Million), by End User 2025 & 2033
- Figure 49: Middle East and Africa Data Visualization Industry Revenue Share (%), by End User 2025 & 2033
- Figure 50: Middle East and Africa Data Visualization Industry Revenue (Million), by Country 2025 & 2033
- Figure 51: Middle East and Africa Data Visualization Industry Revenue Share (%), by Country 2025 & 2033
List of Tables
- Table 1: Global Data Visualization Industry Revenue Million Forecast, by Region 2020 & 2033
- Table 2: Global Data Visualization Industry Revenue Million Forecast, by Organizational Department 2020 & 2033
- Table 3: Global Data Visualization Industry Revenue Million Forecast, by Deployment Mode 2020 & 2033
- Table 4: Global Data Visualization Industry Revenue Million Forecast, by End User 2020 & 2033
- Table 5: Global Data Visualization Industry Revenue Million Forecast, by Region 2020 & 2033
- Table 6: Global Data Visualization Industry Revenue Million Forecast, by Country 2020 & 2033
- Table 7: Data Visualization Industry Revenue (Million) Forecast, by Application 2020 & 2033
- Table 8: Global Data Visualization Industry Revenue Million Forecast, by Country 2020 & 2033
- Table 9: Data Visualization Industry Revenue (Million) Forecast, by Application 2020 & 2033
- Table 10: Global Data Visualization Industry Revenue Million Forecast, by Country 2020 & 2033
- Table 11: Data Visualization Industry Revenue (Million) Forecast, by Application 2020 & 2033
- Table 12: Global Data Visualization Industry Revenue Million Forecast, by Country 2020 & 2033
- Table 13: Data Visualization Industry Revenue (Million) Forecast, by Application 2020 & 2033
- Table 14: Global Data Visualization Industry Revenue Million Forecast, by Country 2020 & 2033
- Table 15: Data Visualization Industry Revenue (Million) Forecast, by Application 2020 & 2033
- Table 16: Global Data Visualization Industry Revenue Million Forecast, by Organizational Department 2020 & 2033
- Table 17: Global Data Visualization Industry Revenue Million Forecast, by Deployment Mode 2020 & 2033
- Table 18: Global Data Visualization Industry Revenue Million Forecast, by End User 2020 & 2033
- Table 19: Global Data Visualization Industry Revenue Million Forecast, by Country 2020 & 2033
- Table 20: Global Data Visualization Industry Revenue Million Forecast, by Organizational Department 2020 & 2033
- Table 21: Global Data Visualization Industry Revenue Million Forecast, by Deployment Mode 2020 & 2033
- Table 22: Global Data Visualization Industry Revenue Million Forecast, by End User 2020 & 2033
- Table 23: Global Data Visualization Industry Revenue Million Forecast, by Country 2020 & 2033
- Table 24: Global Data Visualization Industry Revenue Million Forecast, by Organizational Department 2020 & 2033
- Table 25: Global Data Visualization Industry Revenue Million Forecast, by Deployment Mode 2020 & 2033
- Table 26: Global Data Visualization Industry Revenue Million Forecast, by End User 2020 & 2033
- Table 27: Global Data Visualization Industry Revenue Million Forecast, by Country 2020 & 2033
- Table 28: Global Data Visualization Industry Revenue Million Forecast, by Organizational Department 2020 & 2033
- Table 29: Global Data Visualization Industry Revenue Million Forecast, by Deployment Mode 2020 & 2033
- Table 30: Global Data Visualization Industry Revenue Million Forecast, by End User 2020 & 2033
- Table 31: Global Data Visualization Industry Revenue Million Forecast, by Country 2020 & 2033
- Table 32: Global Data Visualization Industry Revenue Million Forecast, by Organizational Department 2020 & 2033
- Table 33: Global Data Visualization Industry Revenue Million Forecast, by Deployment Mode 2020 & 2033
- Table 34: Global Data Visualization Industry Revenue Million Forecast, by End User 2020 & 2033
- Table 35: Global Data Visualization Industry Revenue Million Forecast, by Country 2020 & 2033
Frequently Asked Questions
1. What is the projected Compound Annual Growth Rate (CAGR) of the Data Visualization Industry?
The projected CAGR is approximately 10.95%.
2. Which companies are prominent players in the Data Visualization Industry?
Key companies in the market include SAS Institute Inc, InetSoft Technology Corporation, TIBCO Software Inc, IBM Corporation, Microsoft Corporation, Pentaho Corporation, Dundas Data Visualization Inc, Information Builders, Oracle Corporation, Salesforce com Inc (Tableau Software Inc ), SAP SE, MicroStrategy Inc *List Not Exhaustive.
3. What are the main segments of the Data Visualization Industry?
The market segments include Organizational Department, Deployment Mode, End User.
4. Can you provide details about the market size?
The market size is estimated to be USD 9.84 Million as of 2022.
5. What are some drivers contributing to market growth?
Cloud Deployment of Data Visualization Solutions; Increasing Need for Quick Decision Making.
6. What are the notable trends driving market growth?
Retail Segment to Witness Significant Growth.
7. Are there any restraints impacting market growth?
Lack of Tech Savvy and Skilled Workforce/Inability.
8. Can you provide examples of recent developments in the market?
September 2022: KPI 360, an AI-driven solution that uses real-time data monitoring and prediction to assist manufacturing organizations in seeing various operational data sources through a single, comprehensive industrial intelligence dashboard that sets up in hours, was recently unveiled by SymphonyAI Industrial.
9. What pricing options are available for accessing the report?
Pricing options include single-user, multi-user, and enterprise licenses priced at USD 4750, USD 5250, and USD 8750 respectively.
10. Is the market size provided in terms of value or volume?
The market size is provided in terms of value, measured in Million.
11. Are there any specific market keywords associated with the report?
Yes, the market keyword associated with the report is "Data Visualization Industry," which aids in identifying and referencing the specific market segment covered.
12. How do I determine which pricing option suits my needs best?
The pricing options vary based on user requirements and access needs. Individual users may opt for single-user licenses, while businesses requiring broader access may choose multi-user or enterprise licenses for cost-effective access to the report.
13. Are there any additional resources or data provided in the Data Visualization Industry report?
While the report offers comprehensive insights, it's advisable to review the specific contents or supplementary materials provided to ascertain if additional resources or data are available.
14. How can I stay updated on further developments or reports in the Data Visualization Industry?
To stay informed about further developments, trends, and reports in the Data Visualization Industry, consider subscribing to industry newsletters, following relevant companies and organizations, or regularly checking reputable industry news sources and publications.
Methodology
Step 1 - Identification of Relevant Samples Size from Population Database


Step 2 - Approaches for Defining Global Market Size (Value, Volume* & Price*)

Note*: In applicable scenarios
Step 3 - Data Sources
Primary Research
- Web Analytics
- Survey Reports
- Research Institute
- Latest Research Reports
- Opinion Leaders
Secondary Research
- Annual Reports
- White Paper
- Latest Press Release
- Industry Association
- Paid Database
- Investor Presentations

Step 4 - Data Triangulation
Involves using different sources of information in order to increase the validity of a study
These sources are likely to be stakeholders in a program - participants, other researchers, program staff, other community members, and so on.
Then we put all data in single framework & apply various statistical tools to find out the dynamic on the market.
During the analysis stage, feedback from the stakeholder groups would be compared to determine areas of agreement as well as areas of divergence
