

Key Insights
The global trade finance industry, valued at $65.69 billion in 2025, is projected to experience robust growth, exhibiting a compound annual growth rate (CAGR) of 4.24% from 2025 to 2033. This expansion is fueled by several key drivers. The increasing globalization of businesses and the consequent rise in international trade transactions necessitate robust and secure financial solutions. Furthermore, technological advancements, such as blockchain technology and AI-powered solutions, are streamlining processes, enhancing efficiency, and reducing risks associated with trade finance. The expanding e-commerce sector also significantly contributes to the market's growth, demanding efficient and secure payment mechanisms for cross-border transactions. However, geopolitical instability, fluctuating exchange rates, and stringent regulatory compliance requirements pose challenges to the industry's growth. Competition among established players like Citigroup Inc., Santander Bank, and others, alongside the emergence of fintech companies offering innovative solutions, further shapes the market landscape. Segment-wise growth will likely be driven by Letters of Credit, which traditionally constitute a significant portion of trade finance activities, alongside a surge in demand for supply chain finance solutions given the increasing complexity of global supply chains.
The forecast period (2025-2033) anticipates continued growth, albeit at a potentially moderating pace in later years as the market matures. The historical period (2019-2024) likely witnessed fluctuations influenced by global economic events such as the COVID-19 pandemic, which initially disrupted trade flows but ultimately underscored the importance of resilient trade finance mechanisms. Regional variations in growth are expected, with developing economies potentially exhibiting higher growth rates due to their expanding trade activities. Key players are adapting to evolving market needs by investing in digital transformation, expanding into new markets, and offering tailored solutions to specific industries. Strategic partnerships and mergers and acquisitions will likely continue to shape the competitive landscape in the coming years, leading to further consolidation within the industry.

Trade Finance Industry Report: 2019-2033 Forecast
This comprehensive report provides an in-depth analysis of the global trade finance industry, offering invaluable insights for stakeholders seeking to navigate this dynamic market. With a study period spanning 2019-2033, a base year of 2025, and a forecast period of 2025-2033, this report leverages historical data (2019-2024) to project future trends and opportunities. The market size is estimated at $XX Million in 2025, with a projected Compound Annual Growth Rate (CAGR) of XX% during the forecast period. Key players such as Citigroup Inc, Santander Bank, Scotiabank, Commerzbank, Nordea Group, Unicredit, Standard Chartered Bank, Arab Bank, Societe Generale, Rand Merchant Bank, Rabobank, China Construction Bank, and BNP Paribas are analyzed, among others.
Trade Finance Industry Market Concentration & Dynamics
The global trade finance market exhibits a moderately concentrated landscape, with a few major players holding significant market share. However, the increasing adoption of fintech solutions and the emergence of specialized niche players are gradually reshaping the competitive dynamics. Market share data for 2024 indicates that the top five players collectively account for approximately XX% of the global market. The number of M&A deals in the sector witnessed a notable increase in 2022, with a total of XX deals recorded, driven by strategic expansion goals and the desire to acquire advanced technologies.
- Market Concentration: High in specific segments, moderate overall.
- Innovation Ecosystems: Rapidly evolving, driven by fintech and blockchain adoption.
- Regulatory Frameworks: Vary across jurisdictions, posing compliance challenges.
- Substitute Products: Limited direct substitutes, but alternative financing options exist.
- End-User Trends: Shift towards digitalization and sustainable trade practices.
- M&A Activities: Increased activity in recent years, indicating consolidation and expansion.
Trade Finance Industry Industry Insights & Trends
The trade finance industry is experiencing robust growth, driven by several factors. The global expansion of e-commerce and cross-border trade significantly fuels demand for trade finance solutions. Furthermore, technological disruptions, such as the implementation of blockchain technology and AI-powered solutions, are streamlining processes and increasing efficiency, leading to accelerated market expansion. Evolving consumer behavior, such as a growing preference for digital services, further catalyzes the market's growth. The global market size is projected to reach $XX Million by 2033.

Key Markets & Segments Leading Trade Finance Industry
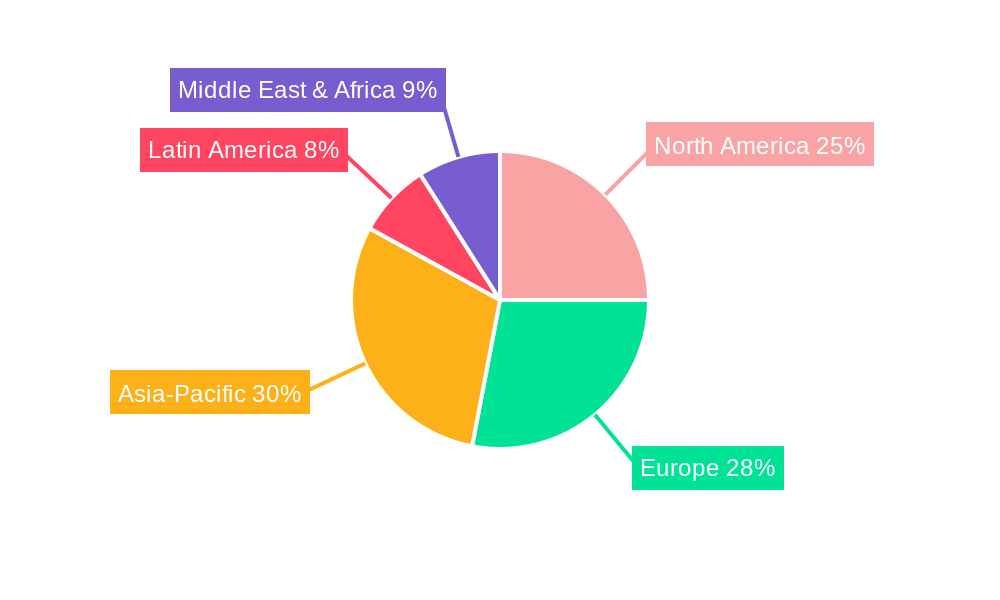
The Asia-Pacific region currently dominates the global trade finance market, driven by robust economic growth, burgeoning e-commerce activities, and significant investments in infrastructure development. Europe and North America also represent substantial markets.
- Drivers in Asia-Pacific:
- Rapid economic growth in emerging economies.
- Expanding cross-border trade activities.
- Increasing adoption of digital trade finance solutions.
- Government initiatives to promote trade and investment.
- Dominance Analysis: Asia-Pacific's dominance is primarily attributed to the region's high economic growth, expansive manufacturing base, and significant participation in global trade. However, other regions are expected to show increasing market share over the forecast period due to factors like government policy and evolving trade practices.
Trade Finance Industry Product Developments
Significant product innovations are transforming the trade finance industry. The integration of blockchain technology enhances transparency and security, reducing risks and streamlining processes. AI-powered solutions optimize risk assessment and improve decision-making. These advancements offer competitive advantages, such as reduced costs, improved efficiency, and enhanced customer experiences. Green trade finance initiatives are also gaining traction as financial institutions align with environmental, social, and governance (ESG) goals.
Challenges in the Trade Finance Industry Market
The trade finance market faces several challenges. Stringent regulatory compliance requirements can add significant operational costs and complexity. Global supply chain disruptions, often amplified by geopolitical events, continue to introduce uncertainty and impact businesses. Finally, intense competition from established players and new fintech entrants necessitates constant innovation and adaptation. These combined factors may result in an estimated XX% reduction in profitability for some segments by 2028.
Forces Driving Trade Finance Industry Growth
Several factors propel the growth of the trade finance industry. Technological advancements, particularly the utilization of blockchain and AI, enhance efficiency, transparency, and security. Global economic expansion and the increase in cross-border trade fuel demand for trade finance services. Furthermore, supportive regulatory frameworks and initiatives to promote digitalization are creating a favorable environment for growth. The projected growth is further accelerated by the increasing adoption of sustainable trade practices.
Challenges in the Trade Finance Industry Market
Long-term growth hinges on continuous innovation, strategic partnerships, and market expansion. Developing robust digital platforms, integrating new technologies such as AI and machine learning, and forming collaborations with technology providers and other financial institutions will be crucial. Expanding into new markets and offering specialized services cater to the evolving needs of businesses, ensuring sustained growth.
Emerging Opportunities in Trade Finance Industry
Emerging opportunities lie in leveraging new technologies such as blockchain and AI to offer innovative solutions. The growth of sustainable finance and green trade initiatives presents significant potential for growth. Expanding into underserved markets and offering tailored services to specific industry sectors can unlock further opportunities. The increasing demand for supply chain finance solutions, particularly for small and medium-sized enterprises (SMEs), also offers significant market potential.
Leading Players in the Trade Finance Industry Sector
- Citigroup Inc
- Santander Bank
- Scotiabank
- Commerzbank
- Nordea Group
- Unicredit
- Standard Chartered Bank
- Arab Bank
- Societe Generale
- Rand Merchant Bank
- Rabobank
- China Construction Bank
- BNP Paribas
- List Not Exhaustive
Key Milestones in Trade Finance Industry Industry
- September 2023: Standard Chartered Bank launched a sustainable trade loan offering for financial institutions, boosting sustainable development initiatives.
- April 2022: The Asian Development Bank partnered with Axis Bank Limited to expand supply chain financing for SMEs, enhancing access to capital for smaller businesses.
Strategic Outlook for Trade Finance Industry Market
The trade finance industry is poised for sustained growth driven by technological innovation, expanding global trade, and the increasing adoption of sustainable practices. Strategic opportunities exist in developing niche solutions, forging strategic partnerships, and leveraging data analytics to optimize risk management. Focusing on sustainability and digitalization will be critical for future success in this evolving landscape.
Trade Finance Industry Segmentation
-
1. Service Provider
- 1.1. Banks
- 1.2. Trade Finance Companies
- 1.3. Insurance Companies
Trade Finance Industry Segmentation By Geography
-
1. North America
- 1.1. US
- 1.2. Canada
- 1.3. Mexico
- 1.4. Rest of North America
-
2. Europe
- 2.1. Germany
- 2.2. UK
- 2.3. France
- 2.4. Russia
- 2.5. Spain
- 2.6. Rest of Europe
-
3. Asia Pacific
- 3.1. India
- 3.2. China
- 3.3. Japan
- 3.4. Rest of Asia Pacific
-
4. South America
- 4.1. Brazil
- 4.2. Argentina
-
5. Middle East And Africa
- 5.1. UAE
- 5.2. Saudi Arabia
- 5.3. Rest of Middle East And Africa
Trade Finance Industry REPORT HIGHLIGHTS
| Aspects | Details |
|---|---|
| Study Period | 2019-2033 |
| Base Year | 2024 |
| Estimated Year | 2025 |
| Forecast Period | 2025-2033 |
| Historical Period | 2019-2024 |
| Growth Rate | CAGR of 4.24% from 2019-2033 |
| Segmentation |
|
Table of Contents
- 1. Introduction
- 1.1. Research Scope
- 1.2. Market Segmentation
- 1.3. Research Methodology
- 1.4. Definitions and Assumptions
- 2. Executive Summary
- 2.1. Introduction
- 3. Market Dynamics
- 3.1. Introduction
- 3.2. Market Drivers
- 3.2.1. Rise In Global Trade Drives The Market; Increasing Investments And Innovations In Fintech Drives The Market
- 3.3. Market Restrains
- 3.3.1. Rise In Global Trade Drives The Market; Increasing Investments And Innovations In Fintech Drives The Market
- 3.4. Market Trends
- 3.4.1. Globalization And Increased International Trade Drives the Market
- 4. Market Factor Analysis
- 4.1. Porters Five Forces
- 4.2. Supply/Value Chain
- 4.3. PESTEL analysis
- 4.4. Market Entropy
- 4.5. Patent/Trademark Analysis
- 5. Global Trade Finance Industry Analysis, Insights and Forecast, 2019-2031
- 5.1. Market Analysis, Insights and Forecast - by Service Provider
- 5.1.1. Banks
- 5.1.2. Trade Finance Companies
- 5.1.3. Insurance Companies
- 5.2. Market Analysis, Insights and Forecast - by Region
- 5.2.1. North America
- 5.2.2. Europe
- 5.2.3. Asia Pacific
- 5.2.4. South America
- 5.2.5. Middle East And Africa
- 5.1. Market Analysis, Insights and Forecast - by Service Provider
- 6. North America Trade Finance Industry Analysis, Insights and Forecast, 2019-2031
- 6.1. Market Analysis, Insights and Forecast - by Service Provider
- 6.1.1. Banks
- 6.1.2. Trade Finance Companies
- 6.1.3. Insurance Companies
- 6.1. Market Analysis, Insights and Forecast - by Service Provider
- 7. Europe Trade Finance Industry Analysis, Insights and Forecast, 2019-2031
- 7.1. Market Analysis, Insights and Forecast - by Service Provider
- 7.1.1. Banks
- 7.1.2. Trade Finance Companies
- 7.1.3. Insurance Companies
- 7.1. Market Analysis, Insights and Forecast - by Service Provider
- 8. Asia Pacific Trade Finance Industry Analysis, Insights and Forecast, 2019-2031
- 8.1. Market Analysis, Insights and Forecast - by Service Provider
- 8.1.1. Banks
- 8.1.2. Trade Finance Companies
- 8.1.3. Insurance Companies
- 8.1. Market Analysis, Insights and Forecast - by Service Provider
- 9. South America Trade Finance Industry Analysis, Insights and Forecast, 2019-2031
- 9.1. Market Analysis, Insights and Forecast - by Service Provider
- 9.1.1. Banks
- 9.1.2. Trade Finance Companies
- 9.1.3. Insurance Companies
- 9.1. Market Analysis, Insights and Forecast - by Service Provider
- 10. Middle East And Africa Trade Finance Industry Analysis, Insights and Forecast, 2019-2031
- 10.1. Market Analysis, Insights and Forecast - by Service Provider
- 10.1.1. Banks
- 10.1.2. Trade Finance Companies
- 10.1.3. Insurance Companies
- 10.1. Market Analysis, Insights and Forecast - by Service Provider
- 11. Competitive Analysis
- 11.1. Global Market Share Analysis 2024
- 11.2. Company Profiles
- 11.2.1 Citi group Inc
- 11.2.1.1. Overview
- 11.2.1.2. Products
- 11.2.1.3. SWOT Analysis
- 11.2.1.4. Recent Developments
- 11.2.1.5. Financials (Based on Availability)
- 11.2.2 Santander Bank
- 11.2.2.1. Overview
- 11.2.2.2. Products
- 11.2.2.3. SWOT Analysis
- 11.2.2.4. Recent Developments
- 11.2.2.5. Financials (Based on Availability)
- 11.2.3 Scotiabank
- 11.2.3.1. Overview
- 11.2.3.2. Products
- 11.2.3.3. SWOT Analysis
- 11.2.3.4. Recent Developments
- 11.2.3.5. Financials (Based on Availability)
- 11.2.4 Commerzbank
- 11.2.4.1. Overview
- 11.2.4.2. Products
- 11.2.4.3. SWOT Analysis
- 11.2.4.4. Recent Developments
- 11.2.4.5. Financials (Based on Availability)
- 11.2.5 Nordea Group
- 11.2.5.1. Overview
- 11.2.5.2. Products
- 11.2.5.3. SWOT Analysis
- 11.2.5.4. Recent Developments
- 11.2.5.5. Financials (Based on Availability)
- 11.2.6 Unicredit
- 11.2.6.1. Overview
- 11.2.6.2. Products
- 11.2.6.3. SWOT Analysis
- 11.2.6.4. Recent Developments
- 11.2.6.5. Financials (Based on Availability)
- 11.2.7 Standard Chartered Bank
- 11.2.7.1. Overview
- 11.2.7.2. Products
- 11.2.7.3. SWOT Analysis
- 11.2.7.4. Recent Developments
- 11.2.7.5. Financials (Based on Availability)
- 11.2.8 Arab Bank
- 11.2.8.1. Overview
- 11.2.8.2. Products
- 11.2.8.3. SWOT Analysis
- 11.2.8.4. Recent Developments
- 11.2.8.5. Financials (Based on Availability)
- 11.2.9 Societe Generale
- 11.2.9.1. Overview
- 11.2.9.2. Products
- 11.2.9.3. SWOT Analysis
- 11.2.9.4. Recent Developments
- 11.2.9.5. Financials (Based on Availability)
- 11.2.10 Rand Merchant Bank
- 11.2.10.1. Overview
- 11.2.10.2. Products
- 11.2.10.3. SWOT Analysis
- 11.2.10.4. Recent Developments
- 11.2.10.5. Financials (Based on Availability)
- 11.2.11 Rabobank
- 11.2.11.1. Overview
- 11.2.11.2. Products
- 11.2.11.3. SWOT Analysis
- 11.2.11.4. Recent Developments
- 11.2.11.5. Financials (Based on Availability)
- 11.2.12 China Construction Bank
- 11.2.12.1. Overview
- 11.2.12.2. Products
- 11.2.12.3. SWOT Analysis
- 11.2.12.4. Recent Developments
- 11.2.12.5. Financials (Based on Availability)
- 11.2.13 BNP Paribas**List Not Exhaustive
- 11.2.13.1. Overview
- 11.2.13.2. Products
- 11.2.13.3. SWOT Analysis
- 11.2.13.4. Recent Developments
- 11.2.13.5. Financials (Based on Availability)
- 11.2.1 Citi group Inc
List of Figures
- Figure 1: Global Trade Finance Industry Revenue Breakdown (Million, %) by Region 2024 & 2032
- Figure 2: Global Trade Finance Industry Volume Breakdown (Billion, %) by Region 2024 & 2032
- Figure 3: North America Trade Finance Industry Revenue (Million), by Service Provider 2024 & 2032
- Figure 4: North America Trade Finance Industry Volume (Billion), by Service Provider 2024 & 2032
- Figure 5: North America Trade Finance Industry Revenue Share (%), by Service Provider 2024 & 2032
- Figure 6: North America Trade Finance Industry Volume Share (%), by Service Provider 2024 & 2032
- Figure 7: North America Trade Finance Industry Revenue (Million), by Country 2024 & 2032
- Figure 8: North America Trade Finance Industry Volume (Billion), by Country 2024 & 2032
- Figure 9: North America Trade Finance Industry Revenue Share (%), by Country 2024 & 2032
- Figure 10: North America Trade Finance Industry Volume Share (%), by Country 2024 & 2032
- Figure 11: Europe Trade Finance Industry Revenue (Million), by Service Provider 2024 & 2032
- Figure 12: Europe Trade Finance Industry Volume (Billion), by Service Provider 2024 & 2032
- Figure 13: Europe Trade Finance Industry Revenue Share (%), by Service Provider 2024 & 2032
- Figure 14: Europe Trade Finance Industry Volume Share (%), by Service Provider 2024 & 2032
- Figure 15: Europe Trade Finance Industry Revenue (Million), by Country 2024 & 2032
- Figure 16: Europe Trade Finance Industry Volume (Billion), by Country 2024 & 2032
- Figure 17: Europe Trade Finance Industry Revenue Share (%), by Country 2024 & 2032
- Figure 18: Europe Trade Finance Industry Volume Share (%), by Country 2024 & 2032
- Figure 19: Asia Pacific Trade Finance Industry Revenue (Million), by Service Provider 2024 & 2032
- Figure 20: Asia Pacific Trade Finance Industry Volume (Billion), by Service Provider 2024 & 2032
- Figure 21: Asia Pacific Trade Finance Industry Revenue Share (%), by Service Provider 2024 & 2032
- Figure 22: Asia Pacific Trade Finance Industry Volume Share (%), by Service Provider 2024 & 2032
- Figure 23: Asia Pacific Trade Finance Industry Revenue (Million), by Country 2024 & 2032
- Figure 24: Asia Pacific Trade Finance Industry Volume (Billion), by Country 2024 & 2032
- Figure 25: Asia Pacific Trade Finance Industry Revenue Share (%), by Country 2024 & 2032
- Figure 26: Asia Pacific Trade Finance Industry Volume Share (%), by Country 2024 & 2032
- Figure 27: South America Trade Finance Industry Revenue (Million), by Service Provider 2024 & 2032
- Figure 28: South America Trade Finance Industry Volume (Billion), by Service Provider 2024 & 2032
- Figure 29: South America Trade Finance Industry Revenue Share (%), by Service Provider 2024 & 2032
- Figure 30: South America Trade Finance Industry Volume Share (%), by Service Provider 2024 & 2032
- Figure 31: South America Trade Finance Industry Revenue (Million), by Country 2024 & 2032
- Figure 32: South America Trade Finance Industry Volume (Billion), by Country 2024 & 2032
- Figure 33: South America Trade Finance Industry Revenue Share (%), by Country 2024 & 2032
- Figure 34: South America Trade Finance Industry Volume Share (%), by Country 2024 & 2032
- Figure 35: Middle East And Africa Trade Finance Industry Revenue (Million), by Service Provider 2024 & 2032
- Figure 36: Middle East And Africa Trade Finance Industry Volume (Billion), by Service Provider 2024 & 2032
- Figure 37: Middle East And Africa Trade Finance Industry Revenue Share (%), by Service Provider 2024 & 2032
- Figure 38: Middle East And Africa Trade Finance Industry Volume Share (%), by Service Provider 2024 & 2032
- Figure 39: Middle East And Africa Trade Finance Industry Revenue (Million), by Country 2024 & 2032
- Figure 40: Middle East And Africa Trade Finance Industry Volume (Billion), by Country 2024 & 2032
- Figure 41: Middle East And Africa Trade Finance Industry Revenue Share (%), by Country 2024 & 2032
- Figure 42: Middle East And Africa Trade Finance Industry Volume Share (%), by Country 2024 & 2032
List of Tables
- Table 1: Global Trade Finance Industry Revenue Million Forecast, by Region 2019 & 2032
- Table 2: Global Trade Finance Industry Volume Billion Forecast, by Region 2019 & 2032
- Table 3: Global Trade Finance Industry Revenue Million Forecast, by Service Provider 2019 & 2032
- Table 4: Global Trade Finance Industry Volume Billion Forecast, by Service Provider 2019 & 2032
- Table 5: Global Trade Finance Industry Revenue Million Forecast, by Region 2019 & 2032
- Table 6: Global Trade Finance Industry Volume Billion Forecast, by Region 2019 & 2032
- Table 7: Global Trade Finance Industry Revenue Million Forecast, by Service Provider 2019 & 2032
- Table 8: Global Trade Finance Industry Volume Billion Forecast, by Service Provider 2019 & 2032
- Table 9: Global Trade Finance Industry Revenue Million Forecast, by Country 2019 & 2032
- Table 10: Global Trade Finance Industry Volume Billion Forecast, by Country 2019 & 2032
- Table 11: US Trade Finance Industry Revenue (Million) Forecast, by Application 2019 & 2032
- Table 12: US Trade Finance Industry Volume (Billion) Forecast, by Application 2019 & 2032
- Table 13: Canada Trade Finance Industry Revenue (Million) Forecast, by Application 2019 & 2032
- Table 14: Canada Trade Finance Industry Volume (Billion) Forecast, by Application 2019 & 2032
- Table 15: Mexico Trade Finance Industry Revenue (Million) Forecast, by Application 2019 & 2032
- Table 16: Mexico Trade Finance Industry Volume (Billion) Forecast, by Application 2019 & 2032
- Table 17: Rest of North America Trade Finance Industry Revenue (Million) Forecast, by Application 2019 & 2032
- Table 18: Rest of North America Trade Finance Industry Volume (Billion) Forecast, by Application 2019 & 2032
- Table 19: Global Trade Finance Industry Revenue Million Forecast, by Service Provider 2019 & 2032
- Table 20: Global Trade Finance Industry Volume Billion Forecast, by Service Provider 2019 & 2032
- Table 21: Global Trade Finance Industry Revenue Million Forecast, by Country 2019 & 2032
- Table 22: Global Trade Finance Industry Volume Billion Forecast, by Country 2019 & 2032
- Table 23: Germany Trade Finance Industry Revenue (Million) Forecast, by Application 2019 & 2032
- Table 24: Germany Trade Finance Industry Volume (Billion) Forecast, by Application 2019 & 2032
- Table 25: UK Trade Finance Industry Revenue (Million) Forecast, by Application 2019 & 2032
- Table 26: UK Trade Finance Industry Volume (Billion) Forecast, by Application 2019 & 2032
- Table 27: France Trade Finance Industry Revenue (Million) Forecast, by Application 2019 & 2032
- Table 28: France Trade Finance Industry Volume (Billion) Forecast, by Application 2019 & 2032
- Table 29: Russia Trade Finance Industry Revenue (Million) Forecast, by Application 2019 & 2032
- Table 30: Russia Trade Finance Industry Volume (Billion) Forecast, by Application 2019 & 2032
- Table 31: Spain Trade Finance Industry Revenue (Million) Forecast, by Application 2019 & 2032
- Table 32: Spain Trade Finance Industry Volume (Billion) Forecast, by Application 2019 & 2032
- Table 33: Rest of Europe Trade Finance Industry Revenue (Million) Forecast, by Application 2019 & 2032
- Table 34: Rest of Europe Trade Finance Industry Volume (Billion) Forecast, by Application 2019 & 2032
- Table 35: Global Trade Finance Industry Revenue Million Forecast, by Service Provider 2019 & 2032
- Table 36: Global Trade Finance Industry Volume Billion Forecast, by Service Provider 2019 & 2032
- Table 37: Global Trade Finance Industry Revenue Million Forecast, by Country 2019 & 2032
- Table 38: Global Trade Finance Industry Volume Billion Forecast, by Country 2019 & 2032
- Table 39: India Trade Finance Industry Revenue (Million) Forecast, by Application 2019 & 2032
- Table 40: India Trade Finance Industry Volume (Billion) Forecast, by Application 2019 & 2032
- Table 41: China Trade Finance Industry Revenue (Million) Forecast, by Application 2019 & 2032
- Table 42: China Trade Finance Industry Volume (Billion) Forecast, by Application 2019 & 2032
- Table 43: Japan Trade Finance Industry Revenue (Million) Forecast, by Application 2019 & 2032
- Table 44: Japan Trade Finance Industry Volume (Billion) Forecast, by Application 2019 & 2032
- Table 45: Rest of Asia Pacific Trade Finance Industry Revenue (Million) Forecast, by Application 2019 & 2032
- Table 46: Rest of Asia Pacific Trade Finance Industry Volume (Billion) Forecast, by Application 2019 & 2032
- Table 47: Global Trade Finance Industry Revenue Million Forecast, by Service Provider 2019 & 2032
- Table 48: Global Trade Finance Industry Volume Billion Forecast, by Service Provider 2019 & 2032
- Table 49: Global Trade Finance Industry Revenue Million Forecast, by Country 2019 & 2032
- Table 50: Global Trade Finance Industry Volume Billion Forecast, by Country 2019 & 2032
- Table 51: Brazil Trade Finance Industry Revenue (Million) Forecast, by Application 2019 & 2032
- Table 52: Brazil Trade Finance Industry Volume (Billion) Forecast, by Application 2019 & 2032
- Table 53: Argentina Trade Finance Industry Revenue (Million) Forecast, by Application 2019 & 2032
- Table 54: Argentina Trade Finance Industry Volume (Billion) Forecast, by Application 2019 & 2032
- Table 55: Global Trade Finance Industry Revenue Million Forecast, by Service Provider 2019 & 2032
- Table 56: Global Trade Finance Industry Volume Billion Forecast, by Service Provider 2019 & 2032
- Table 57: Global Trade Finance Industry Revenue Million Forecast, by Country 2019 & 2032
- Table 58: Global Trade Finance Industry Volume Billion Forecast, by Country 2019 & 2032
- Table 59: UAE Trade Finance Industry Revenue (Million) Forecast, by Application 2019 & 2032
- Table 60: UAE Trade Finance Industry Volume (Billion) Forecast, by Application 2019 & 2032
- Table 61: Saudi Arabia Trade Finance Industry Revenue (Million) Forecast, by Application 2019 & 2032
- Table 62: Saudi Arabia Trade Finance Industry Volume (Billion) Forecast, by Application 2019 & 2032
- Table 63: Rest of Middle East And Africa Trade Finance Industry Revenue (Million) Forecast, by Application 2019 & 2032
- Table 64: Rest of Middle East And Africa Trade Finance Industry Volume (Billion) Forecast, by Application 2019 & 2032
Frequently Asked Questions
1. What is the projected Compound Annual Growth Rate (CAGR) of the Trade Finance Industry?
The projected CAGR is approximately 4.24%.
2. Which companies are prominent players in the Trade Finance Industry?
Key companies in the market include Citi group Inc, Santander Bank, Scotiabank, Commerzbank, Nordea Group, Unicredit, Standard Chartered Bank, Arab Bank, Societe Generale, Rand Merchant Bank, Rabobank, China Construction Bank, BNP Paribas**List Not Exhaustive.
3. What are the main segments of the Trade Finance Industry?
The market segments include Service Provider.
4. Can you provide details about the market size?
The market size is estimated to be USD 65.69 Million as of 2022.
5. What are some drivers contributing to market growth?
Rise In Global Trade Drives The Market; Increasing Investments And Innovations In Fintech Drives The Market.
6. What are the notable trends driving market growth?
Globalization And Increased International Trade Drives the Market.
7. Are there any restraints impacting market growth?
Rise In Global Trade Drives The Market; Increasing Investments And Innovations In Fintech Drives The Market.
8. Can you provide examples of recent developments in the market?
September 2023 - Standard Chartered Bank, a multinational bank, launched a sustainable trade loan offering for financial institutions. It will assist financial institutions in providing liquidity associated with sustainable development in the most needed areas.
9. What pricing options are available for accessing the report?
Pricing options include single-user, multi-user, and enterprise licenses priced at USD 4750, USD 5250, and USD 8750 respectively.
10. Is the market size provided in terms of value or volume?
The market size is provided in terms of value, measured in Million and volume, measured in Billion.
11. Are there any specific market keywords associated with the report?
Yes, the market keyword associated with the report is "Trade Finance Industry," which aids in identifying and referencing the specific market segment covered.
12. How do I determine which pricing option suits my needs best?
The pricing options vary based on user requirements and access needs. Individual users may opt for single-user licenses, while businesses requiring broader access may choose multi-user or enterprise licenses for cost-effective access to the report.
13. Are there any additional resources or data provided in the Trade Finance Industry report?
While the report offers comprehensive insights, it's advisable to review the specific contents or supplementary materials provided to ascertain if additional resources or data are available.
14. How can I stay updated on further developments or reports in the Trade Finance Industry?
To stay informed about further developments, trends, and reports in the Trade Finance Industry, consider subscribing to industry newsletters, following relevant companies and organizations, or regularly checking reputable industry news sources and publications.
Methodology
Step 1 - Identification of Relevant Samples Size from Population Database


Step 2 - Approaches for Defining Global Market Size (Value, Volume* & Price*)

Note*: In applicable scenarios
Step 3 - Data Sources
Primary Research
- Web Analytics
- Survey Reports
- Research Institute
- Latest Research Reports
- Opinion Leaders
Secondary Research
- Annual Reports
- White Paper
- Latest Press Release
- Industry Association
- Paid Database
- Investor Presentations

Step 4 - Data Triangulation
Involves using different sources of information in order to increase the validity of a study
These sources are likely to be stakeholders in a program - participants, other researchers, program staff, other community members, and so on.
Then we put all data in single framework & apply various statistical tools to find out the dynamic on the market.
During the analysis stage, feedback from the stakeholder groups would be compared to determine areas of agreement as well as areas of divergence
