

Key Insights
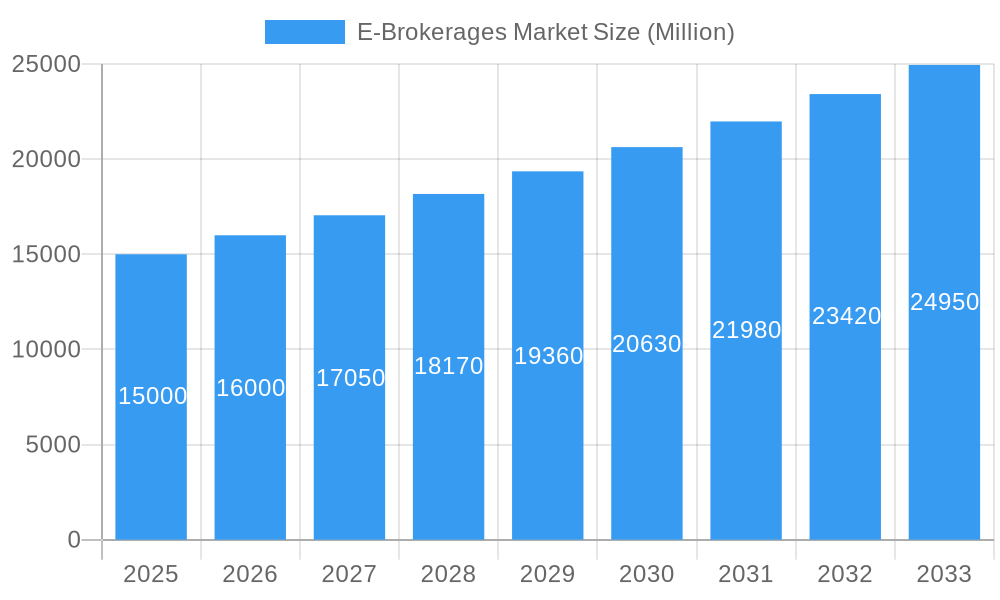
The global e-brokerage market is experiencing robust growth, driven by the increasing adoption of online trading platforms and the rising popularity of mobile trading applications. The market's Compound Annual Growth Rate (CAGR) exceeding 6.50% from 2019 to 2024 indicates a significant upward trajectory, projected to continue through 2033. This growth is fueled by several key factors, including the accessibility and convenience of online trading, reduced commission fees offered by many e-brokerages, and the increasing availability of sophisticated trading tools and educational resources for both novice and experienced investors. The expanding retail investor base, particularly among younger demographics comfortable with digital technology, further contributes to market expansion. While regulatory changes and cybersecurity threats pose potential restraints, the overall market outlook remains positive, with continued innovation in trading technologies and a broadening range of investment products shaping future growth.
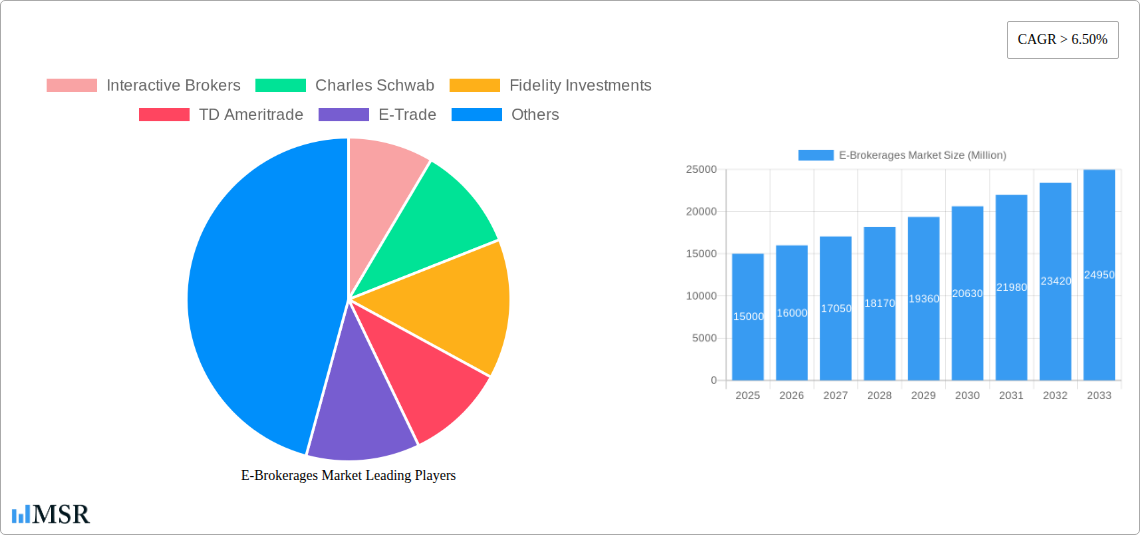
E-Brokerages Market Market Size (In Billion)
The competitive landscape is highly dynamic, with established players like Interactive Brokers, Charles Schwab, Fidelity Investments, and TD Ameritrade competing alongside newer entrants like TastyWorks and eToro. These companies are vying for market share through strategic partnerships, technological advancements, and aggressive marketing campaigns. Geographical distribution shows a strong presence in North America and Europe, with emerging markets in Asia-Pacific and Latin America also exhibiting promising growth potential. Differentiation strategies, such as specialized investment offerings (e.g., fractional shares, options trading), superior user interfaces, and robust customer support, will be critical for success in this increasingly competitive market. Future growth will likely be shaped by technological advancements like artificial intelligence-driven trading algorithms and the further integration of blockchain technology into financial transactions.
E-Brokerages Market Company Market Share
Unlock the Potential of the E-Brokerages Market: A Comprehensive Report (2019-2033)
This in-depth report provides a comprehensive analysis of the E-Brokerages Market, covering the period 2019-2033, with a focus on the estimated year 2025. It delves into market dynamics, key players like Interactive Brokers, Charles Schwab, Fidelity Investments, TD Ameritrade, E-Trade, TastyWorks, eToro, X-Trade Brokers, IC Markets, Eoption, and First Prudential Markets (list not exhaustive), and emerging trends shaping this rapidly evolving sector. Discover actionable insights to navigate the complexities of this lucrative market and capitalize on future opportunities. The report utilizes data from the historical period (2019-2024) and forecasts market trends through 2033.
E-Brokerages Market Market Concentration & Dynamics
The E-Brokerages market is characterized by a dynamic and moderately concentrated landscape. While a few prominent players hold substantial market influence, the ecosystem is continuously shaped by a confluence of technological innovation, evolving regulatory environments, and shifting end-user preferences. While precise market share figures for the top entities are proprietary, projections for 2025 indicate that the leading five e-brokerages collectively command a significant portion of the market, estimated to be around XX%. The relentless pace of technological advancement is a primary catalyst, with substantial investment flowing into the development of sophisticated AI-powered trading algorithms, predictive analytics, and intuitive, mobile-first trading platforms. These innovations are not only enhancing trading efficiency but also democratizing access to sophisticated financial tools. Concurrently, the global regulatory framework, which varies considerably across different jurisdictions, plays a crucial role in defining operational parameters, influencing compliance costs, and shaping market practices. Competitive pressures also stem from substitute offerings, including established traditional brokerages and the growing segment of robo-advisors, compelling e-brokerages to continually refine their value propositions. End-users are increasingly demanding user-friendly interfaces, comprehensive analytical tools, and cost-effective trading models, with a strong preference for commission-free or low-commission trading structures.
- Market Share Dynamics: Projections for 2025 suggest the top five e-brokerages will hold approximately XX% of the market.
- Mergers & Acquisitions: The market is witnessing a sustained surge in M&A activity. This trend is particularly pronounced among smaller firms aiming to bolster their market presence and acquire cutting-edge technological capabilities. In 2024, approximately XX deals were recorded, with projections for 2025 indicating a continued upward trend.
- Regulatory Scrutiny: Increasingly stringent regulations, particularly concerning data privacy, cybersecurity, and robust customer protection measures, are becoming a dominant influence on market operations and strategic planning.
- Key Innovations: The e-brokerage sector is being propelled forward by groundbreaking innovations in AI-driven trading strategies, advanced mobile trading applications, and the development of personalized financial advisory tools designed to cater to individual investor needs.
E-Brokerages Market Industry Insights & Trends
The global E-Brokerages market is experiencing robust growth, with a projected Compound Annual Growth Rate (CAGR) of xx% during the forecast period (2025-2033). The market size is estimated at USD xx Million in 2025, driven by several factors. Increased internet and smartphone penetration, particularly in emerging economies, expands the potential customer base. The increasing adoption of mobile trading platforms and the growing popularity of commission-free trading options are significant contributors. Technological disruptions, including the rise of AI and blockchain, are reshaping the trading landscape and presenting new opportunities. Changing consumer behaviors, including increased interest in algorithmic trading and fractional share investing, further fuel market growth. The shift towards self-directed investing continues to impact the industry, although full-service brokerage remains a relevant segment.
Key Markets & Segments Leading E-Brokerages Market
North America currently dominates the E-Brokerages market, driven by high levels of financial literacy, strong regulatory frameworks, and a large investor base. Asia-Pacific shows promising growth potential due to its expanding middle class and increasing adoption of online trading platforms.
- North America: High market maturity, advanced technological infrastructure, and substantial investor base contribute to its dominance.
- Asia-Pacific: Rapid economic growth, increasing internet and smartphone penetration, and a growing young population with disposable income drive strong growth potential.
- Europe: A mature market with a well-developed regulatory environment. Growth is moderate, driven by technological advancements and diversification of financial products.
E-Brokerages Market Product Developments
Recent product developments in the E-Brokerages market focus on enhancing user experience, incorporating advanced analytics, and offering diversified investment options. Innovations include AI-powered trading assistants, enhanced charting tools, and fractional share trading capabilities. These advancements improve accessibility, cater to evolving investor preferences, and create a competitive edge for brokerages.
Challenges in the E-Brokerages Market Market
The e-brokerages market is navigating a complex terrain marked by several significant challenges. The highly competitive environment, fueled by both established giants and agile newcomers, exerts considerable pressure on pricing strategies and overall profitability. Adhering to a multifaceted and often evolving global regulatory landscape presents substantial compliance costs and operational complexities, especially for firms operating across multiple jurisdictions. Furthermore, the ever-present threat of cyberattacks necessitates continuous investment in robust security infrastructure to safeguard sensitive customer data and financial transactions. Maintaining consistently high levels of customer satisfaction, coupled with effective management of operational risks, remains paramount for ensuring sustainable growth and long-term success in this rapidly evolving sector.
Forces Driving E-Brokerages Market Growth
The e-brokerages market is experiencing robust growth propelled by a synergistic interplay of several powerful forces. At the forefront are significant technological advancements, including the pervasive integration of Artificial Intelligence (AI), machine learning algorithms, and the emerging potential of blockchain technology. These innovations are not only enhancing the efficiency and sophistication of trading capabilities but also paving the way for entirely new financial products and services. The proliferation of user-friendly mobile trading applications has dramatically increased accessibility, attracting a broader demographic of retail investors who value convenience and on-the-go trading. Favorable macroeconomic conditions in key regions worldwide are fostering increased investor confidence, leading to greater participation in financial markets. Moreover, supportive regulatory initiatives aimed at promoting financial inclusion, enhancing investor protection, and fostering a transparent trading environment are acting as significant tailwinds for market expansion.
Long-Term Growth Catalysts in E-Brokerages Market
Long-term growth hinges on continued technological innovation, strategic partnerships, and expansion into new markets. Brokerages leveraging AI-driven personalized investment advice and robo-advisory services will likely gain a competitive edge. Strategic collaborations among brokerages and financial technology companies will accelerate product development and market reach. Expansion into underserved markets and the development of innovative financial products will unlock new growth opportunities.
Emerging Opportunities in E-Brokerages Market
Emerging opportunities include the integration of blockchain technology for enhanced security and transparency in transactions. The growing adoption of cryptocurrencies and digital assets opens avenues for diversification and growth. The development of personalized financial planning tools and AI-powered investment strategies will cater to the evolving needs of investors. Furthermore, expansion into niche markets and the integration of ESG (Environmental, Social, and Governance) factors in investment strategies present significant opportunities.
Leading Players in the E-Brokerages Market Sector
- Interactive Brokers
- Charles Schwab
- Fidelity Investments
- TD Ameritrade
- E-Trade
- TastyWorks
- eToro
- X-Trade Brokers
- IC Markets
- Eoption
- First Prudential Markets
Key Milestones in E-Brokerages Market Industry
- May 2022: Interactive Brokers partnered with TradingView, enhancing client trading experience.
- May 2022: Fidelity International partnered with Conquest, expanding its financial planning software reach.
- August 2022: eToro acquired Gatsby for USD 50 Million, strengthening its market position.
Strategic Outlook for E-Brokerages Market Market
The e-brokerages market is poised for substantial and sustained growth, driven by a confluence of rapidly advancing technologies, an ever-expanding global investor base, and a continuous evolution in consumer expectations. Key strategic opportunities lie in the intelligent leveraging of AI and machine learning to offer predictive insights and personalized trading experiences, alongside a relentless focus on enhancing the overall user experience through intuitive design and seamless functionality. Expansion into untapped geographical markets and the development of diverse asset class offerings are also critical avenues for future growth. E-brokerages that prioritize the delivery of highly personalized services, the introduction of innovative and differentiated product offerings, and the implementation of robust, multi-layered security measures will be exceptionally well-positioned to achieve long-term success and leadership in this dynamic and competitive sector.
E-Brokerages Market Segmentation
-
1. Client
- 1.1. Retailers
- 1.2. Institutional
-
2. Services Provided
- 2.1. Full Time Brokers
- 2.2. Discounted Brokers
-
3. Ownership
- 3.1. Privately Held
- 3.2. Publicly Held
E-Brokerages Market Segmentation By Geography
- 1. North America
- 2. Europe
- 3. Asia Pacific
- 4. South America
- 5. Middle East and Africa
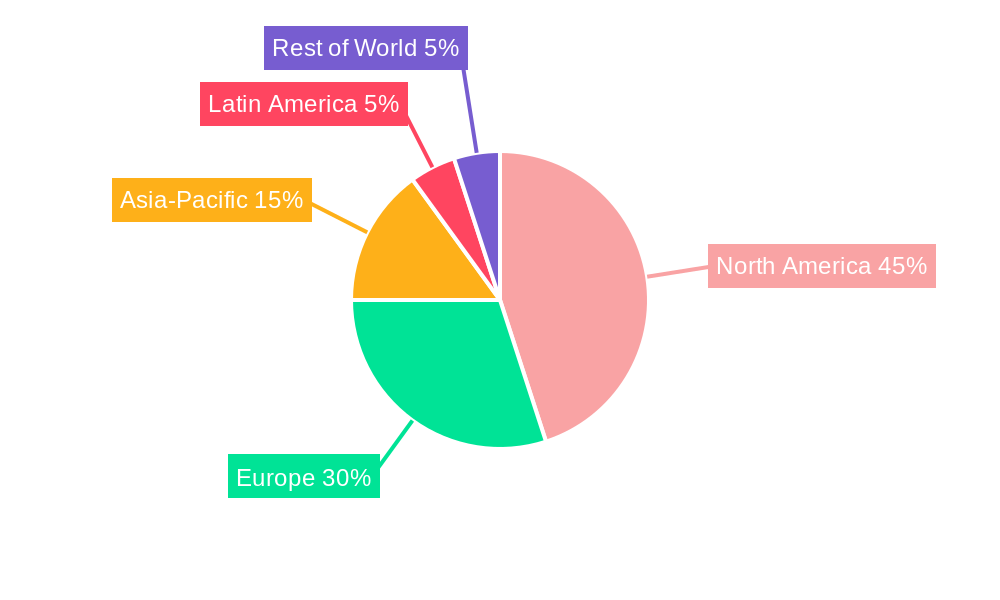
E-Brokerages Market Regional Market Share
Geographic Coverage of E-Brokerages Market
E-Brokerages Market REPORT HIGHLIGHTS
| Aspects | Details |
|---|---|
| Study Period | 2020-2034 |
| Base Year | 2025 |
| Estimated Year | 2026 |
| Forecast Period | 2026-2034 |
| Historical Period | 2020-2025 |
| Growth Rate | CAGR of > 6.50% from 2020-2034 |
| Segmentation |
|
Table of Contents
- 1. Introduction
- 1.1. Research Scope
- 1.2. Market Segmentation
- 1.3. Research Objective
- 1.4. Definitions and Assumptions
- 2. Executive Summary
- 2.1. Market Snapshot
- 3. Market Dynamics
- 3.1. Market Drivers
- 3.2. Market Restrains
- 3.3. Market Trends
- 3.4. Market Opportunities
- 4. Market Factor Analysis
- 4.1. Porters Five Forces
- 4.1.1. Bargaining Power of Suppliers
- 4.1.2. Bargaining Power of Buyers
- 4.1.3. Threat of New Entrants
- 4.1.4. Threat of Substitutes
- 4.1.5. Competitive Rivalry
- 4.2. PESTEL analysis
- 4.3. BCG Analysis
- 4.3.1. Stars (High Growth, High Market Share)
- 4.3.2. Cash Cows (Low Growth, High Market Share)
- 4.3.3. Question Mark (High Growth, Low Market Share)
- 4.3.4. Dogs (Low Growth, Low Market Share)
- 4.4. Ansoff Matrix Analysis
- 4.5. Supply Chain Analysis
- 4.6. Regulatory Landscape
- 4.7. Current Market Potential and Opportunity Assessment (TAM–SAM–SOM Framework)
- 4.8. MSR Analyst Note
- 4.1. Porters Five Forces
- 5. Market Analysis, Insights and Forecast 2021-2033
- 5.1. Market Analysis, Insights and Forecast - by Client
- 5.1.1. Retailers
- 5.1.2. Institutional
- 5.2. Market Analysis, Insights and Forecast - by Services Provided
- 5.2.1. Full Time Brokers
- 5.2.2. Discounted Brokers
- 5.3. Market Analysis, Insights and Forecast - by Ownership
- 5.3.1. Privately Held
- 5.3.2. Publicly Held
- 5.4. Market Analysis, Insights and Forecast - by Region
- 5.4.1. North America
- 5.4.2. Europe
- 5.4.3. Asia Pacific
- 5.4.4. South America
- 5.4.5. Middle East and Africa
- 5.1. Market Analysis, Insights and Forecast - by Client
- 6. Global E-Brokerages Market Analysis, Insights and Forecast, 2021-2033
- 6.1. Market Analysis, Insights and Forecast - by Client
- 6.1.1. Retailers
- 6.1.2. Institutional
- 6.2. Market Analysis, Insights and Forecast - by Services Provided
- 6.2.1. Full Time Brokers
- 6.2.2. Discounted Brokers
- 6.3. Market Analysis, Insights and Forecast - by Ownership
- 6.3.1. Privately Held
- 6.3.2. Publicly Held
- 6.1. Market Analysis, Insights and Forecast - by Client
- 7. North America E-Brokerages Market Analysis, Insights and Forecast, 2020-2032
- 7.1. Market Analysis, Insights and Forecast - by Client
- 7.1.1. Retailers
- 7.1.2. Institutional
- 7.2. Market Analysis, Insights and Forecast - by Services Provided
- 7.2.1. Full Time Brokers
- 7.2.2. Discounted Brokers
- 7.3. Market Analysis, Insights and Forecast - by Ownership
- 7.3.1. Privately Held
- 7.3.2. Publicly Held
- 7.1. Market Analysis, Insights and Forecast - by Client
- 8. Europe E-Brokerages Market Analysis, Insights and Forecast, 2020-2032
- 8.1. Market Analysis, Insights and Forecast - by Client
- 8.1.1. Retailers
- 8.1.2. Institutional
- 8.2. Market Analysis, Insights and Forecast - by Services Provided
- 8.2.1. Full Time Brokers
- 8.2.2. Discounted Brokers
- 8.3. Market Analysis, Insights and Forecast - by Ownership
- 8.3.1. Privately Held
- 8.3.2. Publicly Held
- 8.1. Market Analysis, Insights and Forecast - by Client
- 9. Asia Pacific E-Brokerages Market Analysis, Insights and Forecast, 2020-2032
- 9.1. Market Analysis, Insights and Forecast - by Client
- 9.1.1. Retailers
- 9.1.2. Institutional
- 9.2. Market Analysis, Insights and Forecast - by Services Provided
- 9.2.1. Full Time Brokers
- 9.2.2. Discounted Brokers
- 9.3. Market Analysis, Insights and Forecast - by Ownership
- 9.3.1. Privately Held
- 9.3.2. Publicly Held
- 9.1. Market Analysis, Insights and Forecast - by Client
- 10. South America E-Brokerages Market Analysis, Insights and Forecast, 2020-2032
- 10.1. Market Analysis, Insights and Forecast - by Client
- 10.1.1. Retailers
- 10.1.2. Institutional
- 10.2. Market Analysis, Insights and Forecast - by Services Provided
- 10.2.1. Full Time Brokers
- 10.2.2. Discounted Brokers
- 10.3. Market Analysis, Insights and Forecast - by Ownership
- 10.3.1. Privately Held
- 10.3.2. Publicly Held
- 10.1. Market Analysis, Insights and Forecast - by Client
- 11. Middle East and Africa E-Brokerages Market Analysis, Insights and Forecast, 2020-2032
- 11.1. Market Analysis, Insights and Forecast - by Client
- 11.1.1. Retailers
- 11.1.2. Institutional
- 11.2. Market Analysis, Insights and Forecast - by Services Provided
- 11.2.1. Full Time Brokers
- 11.2.2. Discounted Brokers
- 11.3. Market Analysis, Insights and Forecast - by Ownership
- 11.3.1. Privately Held
- 11.3.2. Publicly Held
- 11.1. Market Analysis, Insights and Forecast - by Client
- 12. Competitive Analysis
- 12.1. Company Profiles
- 12.1.1 Interactive Brokers
- 12.1.1.1. Company Overview
- 12.1.1.2. Products
- 12.1.1.3. Company Financials
- 12.1.1.4. SWOT Analysis
- 12.1.2 Charles Schwab
- 12.1.2.1. Company Overview
- 12.1.2.2. Products
- 12.1.2.3. Company Financials
- 12.1.2.4. SWOT Analysis
- 12.1.3 Fidelity Investments
- 12.1.3.1. Company Overview
- 12.1.3.2. Products
- 12.1.3.3. Company Financials
- 12.1.3.4. SWOT Analysis
- 12.1.4 TD Ameritrade
- 12.1.4.1. Company Overview
- 12.1.4.2. Products
- 12.1.4.3. Company Financials
- 12.1.4.4. SWOT Analysis
- 12.1.5 E-Trade
- 12.1.5.1. Company Overview
- 12.1.5.2. Products
- 12.1.5.3. Company Financials
- 12.1.5.4. SWOT Analysis
- 12.1.6 TastyWorks
- 12.1.6.1. Company Overview
- 12.1.6.2. Products
- 12.1.6.3. Company Financials
- 12.1.6.4. SWOT Analysis
- 12.1.7 Etoro
- 12.1.7.1. Company Overview
- 12.1.7.2. Products
- 12.1.7.3. Company Financials
- 12.1.7.4. SWOT Analysis
- 12.1.8 X-Trade Brokers
- 12.1.8.1. Company Overview
- 12.1.8.2. Products
- 12.1.8.3. Company Financials
- 12.1.8.4. SWOT Analysis
- 12.1.9 IC Markets
- 12.1.9.1. Company Overview
- 12.1.9.2. Products
- 12.1.9.3. Company Financials
- 12.1.9.4. SWOT Analysis
- 12.1.10 Eoption
- 12.1.10.1. Company Overview
- 12.1.10.2. Products
- 12.1.10.3. Company Financials
- 12.1.10.4. SWOT Analysis
- 12.1.11 First Prudential Markets**List Not Exhaustive
- 12.1.11.1. Company Overview
- 12.1.11.2. Products
- 12.1.11.3. Company Financials
- 12.1.11.4. SWOT Analysis
- 12.1.1 Interactive Brokers
- 12.2. Market Entropy
- 12.2.1 Company's Key Areas Served
- 12.2.2 Recent Developments
- 12.3. Company Market Share Analysis 2025
- 12.3.1 Top 5 Companies Market Share Analysis
- 12.3.2 Top 3 Companies Market Share Analysis
- 12.4. List of Potential Customers
- 13. Research Methodology
List of Figures
- Figure 1: Global E-Brokerages Market Revenue Breakdown (Million, %) by Region 2025 & 2033
- Figure 2: North America E-Brokerages Market Revenue (Million), by Client 2025 & 2033
- Figure 3: North America E-Brokerages Market Revenue Share (%), by Client 2025 & 2033
- Figure 4: North America E-Brokerages Market Revenue (Million), by Services Provided 2025 & 2033
- Figure 5: North America E-Brokerages Market Revenue Share (%), by Services Provided 2025 & 2033
- Figure 6: North America E-Brokerages Market Revenue (Million), by Ownership 2025 & 2033
- Figure 7: North America E-Brokerages Market Revenue Share (%), by Ownership 2025 & 2033
- Figure 8: North America E-Brokerages Market Revenue (Million), by Country 2025 & 2033
- Figure 9: North America E-Brokerages Market Revenue Share (%), by Country 2025 & 2033
- Figure 10: Europe E-Brokerages Market Revenue (Million), by Client 2025 & 2033
- Figure 11: Europe E-Brokerages Market Revenue Share (%), by Client 2025 & 2033
- Figure 12: Europe E-Brokerages Market Revenue (Million), by Services Provided 2025 & 2033
- Figure 13: Europe E-Brokerages Market Revenue Share (%), by Services Provided 2025 & 2033
- Figure 14: Europe E-Brokerages Market Revenue (Million), by Ownership 2025 & 2033
- Figure 15: Europe E-Brokerages Market Revenue Share (%), by Ownership 2025 & 2033
- Figure 16: Europe E-Brokerages Market Revenue (Million), by Country 2025 & 2033
- Figure 17: Europe E-Brokerages Market Revenue Share (%), by Country 2025 & 2033
- Figure 18: Asia Pacific E-Brokerages Market Revenue (Million), by Client 2025 & 2033
- Figure 19: Asia Pacific E-Brokerages Market Revenue Share (%), by Client 2025 & 2033
- Figure 20: Asia Pacific E-Brokerages Market Revenue (Million), by Services Provided 2025 & 2033
- Figure 21: Asia Pacific E-Brokerages Market Revenue Share (%), by Services Provided 2025 & 2033
- Figure 22: Asia Pacific E-Brokerages Market Revenue (Million), by Ownership 2025 & 2033
- Figure 23: Asia Pacific E-Brokerages Market Revenue Share (%), by Ownership 2025 & 2033
- Figure 24: Asia Pacific E-Brokerages Market Revenue (Million), by Country 2025 & 2033
- Figure 25: Asia Pacific E-Brokerages Market Revenue Share (%), by Country 2025 & 2033
- Figure 26: South America E-Brokerages Market Revenue (Million), by Client 2025 & 2033
- Figure 27: South America E-Brokerages Market Revenue Share (%), by Client 2025 & 2033
- Figure 28: South America E-Brokerages Market Revenue (Million), by Services Provided 2025 & 2033
- Figure 29: South America E-Brokerages Market Revenue Share (%), by Services Provided 2025 & 2033
- Figure 30: South America E-Brokerages Market Revenue (Million), by Ownership 2025 & 2033
- Figure 31: South America E-Brokerages Market Revenue Share (%), by Ownership 2025 & 2033
- Figure 32: South America E-Brokerages Market Revenue (Million), by Country 2025 & 2033
- Figure 33: South America E-Brokerages Market Revenue Share (%), by Country 2025 & 2033
- Figure 34: Middle East and Africa E-Brokerages Market Revenue (Million), by Client 2025 & 2033
- Figure 35: Middle East and Africa E-Brokerages Market Revenue Share (%), by Client 2025 & 2033
- Figure 36: Middle East and Africa E-Brokerages Market Revenue (Million), by Services Provided 2025 & 2033
- Figure 37: Middle East and Africa E-Brokerages Market Revenue Share (%), by Services Provided 2025 & 2033
- Figure 38: Middle East and Africa E-Brokerages Market Revenue (Million), by Ownership 2025 & 2033
- Figure 39: Middle East and Africa E-Brokerages Market Revenue Share (%), by Ownership 2025 & 2033
- Figure 40: Middle East and Africa E-Brokerages Market Revenue (Million), by Country 2025 & 2033
- Figure 41: Middle East and Africa E-Brokerages Market Revenue Share (%), by Country 2025 & 2033
List of Tables
- Table 1: Global E-Brokerages Market Revenue Million Forecast, by Client 2020 & 2033
- Table 2: Global E-Brokerages Market Revenue Million Forecast, by Services Provided 2020 & 2033
- Table 3: Global E-Brokerages Market Revenue Million Forecast, by Ownership 2020 & 2033
- Table 4: Global E-Brokerages Market Revenue Million Forecast, by Region 2020 & 2033
- Table 5: Global E-Brokerages Market Revenue Million Forecast, by Client 2020 & 2033
- Table 6: Global E-Brokerages Market Revenue Million Forecast, by Services Provided 2020 & 2033
- Table 7: Global E-Brokerages Market Revenue Million Forecast, by Ownership 2020 & 2033
- Table 8: Global E-Brokerages Market Revenue Million Forecast, by Country 2020 & 2033
- Table 9: Global E-Brokerages Market Revenue Million Forecast, by Client 2020 & 2033
- Table 10: Global E-Brokerages Market Revenue Million Forecast, by Services Provided 2020 & 2033
- Table 11: Global E-Brokerages Market Revenue Million Forecast, by Ownership 2020 & 2033
- Table 12: Global E-Brokerages Market Revenue Million Forecast, by Country 2020 & 2033
- Table 13: Global E-Brokerages Market Revenue Million Forecast, by Client 2020 & 2033
- Table 14: Global E-Brokerages Market Revenue Million Forecast, by Services Provided 2020 & 2033
- Table 15: Global E-Brokerages Market Revenue Million Forecast, by Ownership 2020 & 2033
- Table 16: Global E-Brokerages Market Revenue Million Forecast, by Country 2020 & 2033
- Table 17: Global E-Brokerages Market Revenue Million Forecast, by Client 2020 & 2033
- Table 18: Global E-Brokerages Market Revenue Million Forecast, by Services Provided 2020 & 2033
- Table 19: Global E-Brokerages Market Revenue Million Forecast, by Ownership 2020 & 2033
- Table 20: Global E-Brokerages Market Revenue Million Forecast, by Country 2020 & 2033
- Table 21: Global E-Brokerages Market Revenue Million Forecast, by Client 2020 & 2033
- Table 22: Global E-Brokerages Market Revenue Million Forecast, by Services Provided 2020 & 2033
- Table 23: Global E-Brokerages Market Revenue Million Forecast, by Ownership 2020 & 2033
- Table 24: Global E-Brokerages Market Revenue Million Forecast, by Country 2020 & 2033
Frequently Asked Questions
1. What is the projected Compound Annual Growth Rate (CAGR) of the E-Brokerages Market?
The projected CAGR is approximately > 6.50%.
2. Which companies are prominent players in the E-Brokerages Market?
Key companies in the market include Interactive Brokers, Charles Schwab, Fidelity Investments, TD Ameritrade, E-Trade, TastyWorks, Etoro, X-Trade Brokers, IC Markets, Eoption, First Prudential Markets**List Not Exhaustive.
3. What are the main segments of the E-Brokerages Market?
The market segments include Client, Services Provided, Ownership.
4. Can you provide details about the market size?
The market size is estimated to be USD XX Million as of 2022.
5. What are some drivers contributing to market growth?
N/A
6. What are the notable trends driving market growth?
Zero commission in United States equity markets change market dynamics.
7. Are there any restraints impacting market growth?
N/A
8. Can you provide examples of recent developments in the market?
May 2022: Interactive Brokers partnered with TradingView. The new partnership was like a win-win for all parties, particularly for Interactive broker clients as they were now trading directly from their TradingView workspaces and charts.
9. What pricing options are available for accessing the report?
Pricing options include single-user, multi-user, and enterprise licenses priced at USD 4750, USD 5250, and USD 8750 respectively.
10. Is the market size provided in terms of value or volume?
The market size is provided in terms of value, measured in Million.
11. Are there any specific market keywords associated with the report?
Yes, the market keyword associated with the report is "E-Brokerages Market," which aids in identifying and referencing the specific market segment covered.
12. How do I determine which pricing option suits my needs best?
The pricing options vary based on user requirements and access needs. Individual users may opt for single-user licenses, while businesses requiring broader access may choose multi-user or enterprise licenses for cost-effective access to the report.
13. Are there any additional resources or data provided in the E-Brokerages Market report?
While the report offers comprehensive insights, it's advisable to review the specific contents or supplementary materials provided to ascertain if additional resources or data are available.
14. How can I stay updated on further developments or reports in the E-Brokerages Market?
To stay informed about further developments, trends, and reports in the E-Brokerages Market, consider subscribing to industry newsletters, following relevant companies and organizations, or regularly checking reputable industry news sources and publications.
Methodology
Step 1 - Identification of Relevant Samples Size from Population Database


Step 2 - Approaches for Defining Global Market Size (Value, Volume* & Price*)

Note*: In applicable scenarios
Step 3 - Data Sources
Primary Research
- Web Analytics
- Survey Reports
- Research Institute
- Latest Research Reports
- Opinion Leaders
Secondary Research
- Annual Reports
- White Paper
- Latest Press Release
- Industry Association
- Paid Database
- Investor Presentations

Step 4 - Data Triangulation
Involves using different sources of information in order to increase the validity of a study
These sources are likely to be stakeholders in a program - participants, other researchers, program staff, other community members, and so on.
Then we put all data in single framework & apply various statistical tools to find out the dynamic on the market.
During the analysis stage, feedback from the stakeholder groups would be compared to determine areas of agreement as well as areas of divergence