

Key Insights
The U.S. Property and Casualty (P&C) insurance market, a cornerstone of the American financial system, is a robust and dynamic sector. Analyzing the period from 2019 to 2033, we observe consistent growth fueled by several factors. Increased urbanization leads to a higher concentration of insurable assets, driving demand for property insurance. Simultaneously, rising awareness of potential risks, coupled with stricter regulatory environments, incentivizes individuals and businesses to secure comprehensive coverage. Technological advancements, such as improved risk modeling and telematics, contribute to more efficient underwriting and personalized insurance products, further stimulating market expansion. Furthermore, the increasing frequency and severity of catastrophic events, like hurricanes and wildfires, necessitate higher insurance coverage levels, directly impacting market size and revenue generation. We project a steady Compound Annual Growth Rate (CAGR) throughout the forecast period, reflecting the sustained demand and the sector's adaptability to evolving risk landscapes.
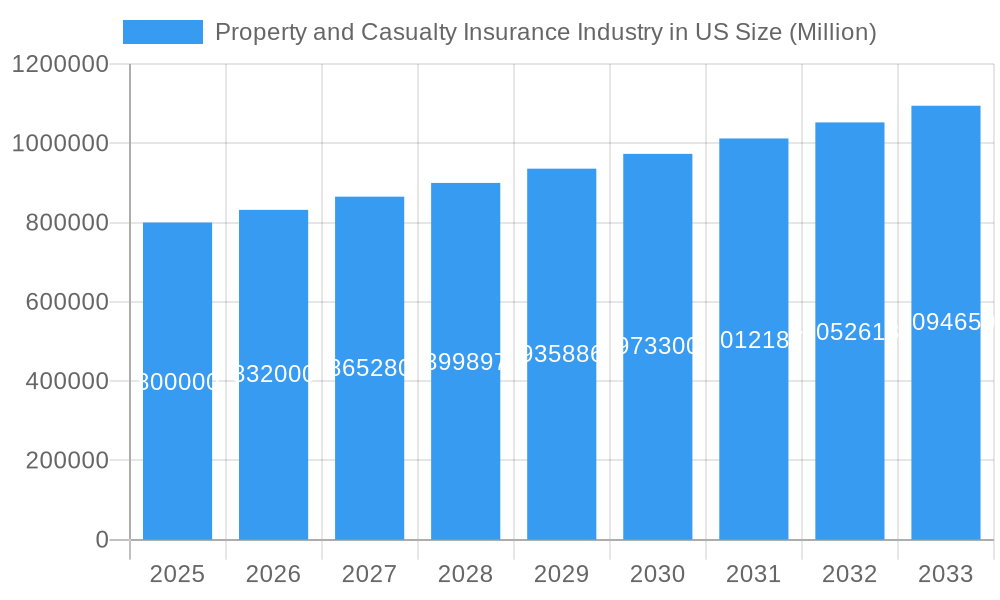
Property and Casualty Insurance Industry in US Market Size (In Billion)
The market's growth trajectory reflects a complex interplay of economic, social, and technological factors. The historical period (2019-2024) likely showcased moderate growth, influenced by economic fluctuations and the evolving insurance landscape. The base year of 2025 serves as a critical benchmark, representing a consolidated market position before the projected acceleration during the forecast period (2025-2033). Future growth will depend on several factors, including macroeconomic stability, inflation rates impacting premiums, the effectiveness of risk mitigation strategies, and evolving consumer preferences for digital insurance solutions. The industry's ability to leverage data analytics and AI for improved risk assessment will play a pivotal role in shaping future growth, while simultaneously managing the increasing costs of catastrophic claims.
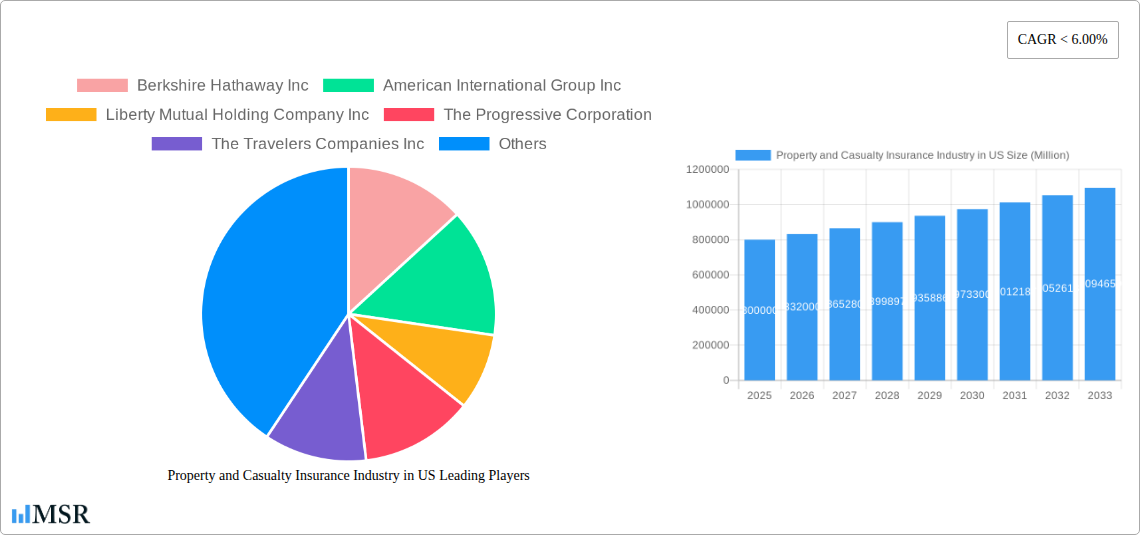
Property and Casualty Insurance Industry in US Company Market Share
Property & Casualty Insurance in the US: A Comprehensive Market Report (2019-2033)
This in-depth report provides a comprehensive analysis of the US Property and Casualty (P&C) insurance market, covering market dynamics, key players, emerging trends, and future growth prospects from 2019 to 2033. The study uses 2025 as its base and estimated year, with a forecast period extending to 2033 and historical data spanning 2019-2024. This report is essential for insurers, investors, and other stakeholders seeking a detailed understanding of this crucial sector.
Property and Casualty Insurance Industry in US Market Concentration & Dynamics
The US P&C insurance market is characterized by a moderately concentrated landscape, with a few dominant players holding significant market share. Berkshire Hathaway Inc., American International Group Inc. (AIG), Liberty Mutual Holding Company Inc., The Progressive Corporation, and The Travelers Companies Inc. are among the leading companies, collectively commanding a significant portion (xx%) of the market. However, a multitude of smaller regional and niche players also contribute to the overall market size. Market concentration is influenced by factors such as regulatory frameworks, M&A activity, and the presence of substitute products.
Market Dynamics:
- Market Share: Berkshire Hathaway holds an estimated xx% market share in 2025, followed by AIG at xx%, and other major players holding xx% collectively. Smaller insurers account for the remaining xx%.
- M&A Activity: The historical period (2019-2024) witnessed xx M&A deals, driven by the pursuit of scale, diversification, and access to new technologies. The forecast period is expected to see an increase in M&A activity, particularly within the Insurtech space.
- Innovation Ecosystems: The rise of Insurtech is significantly impacting the innovation ecosystem, fostering the development of new products and services leveraging data analytics, AI, and telematics.
- Regulatory Frameworks: State-level regulations play a crucial role in shaping market dynamics, influencing pricing, product offerings, and compliance requirements. Changes in regulations can significantly impact the competitive landscape.
- Substitute Products: Alternative risk-management solutions, such as self-insurance and captive insurers, provide some level of substitution, particularly for larger corporations. However, the need for comprehensive coverage and risk transfer continues to drive demand for traditional P&C insurance.
- End-User Trends: Increasing awareness of risk and demand for personalized insurance solutions are driving market growth and influencing product innovation.
Property and Casualty Insurance Industry in US Industry Insights & Trends
The US P&C insurance market is experiencing steady growth, with the market size estimated at $xx Million in 2025. This growth is driven by several key factors including increasing urbanization, rising disposable incomes, and a growing awareness of various risks like cyber threats and climate change. Technological disruptions, particularly the rise of Insurtech and the increasing adoption of digital technologies, are profoundly transforming the industry, impacting operations, distribution channels, and customer experience. Evolving consumer behaviors, characterized by a preference for digital interactions and personalized services, are influencing the way insurance products are designed and marketed. The Compound Annual Growth Rate (CAGR) for the forecast period (2025-2033) is projected to be xx%. This growth is expected to be fueled by increasing demand for specialized coverage like cyber insurance and the expansion of digital distribution channels.
Key Markets & Segments Leading Property and Casualty Insurance Industry in US
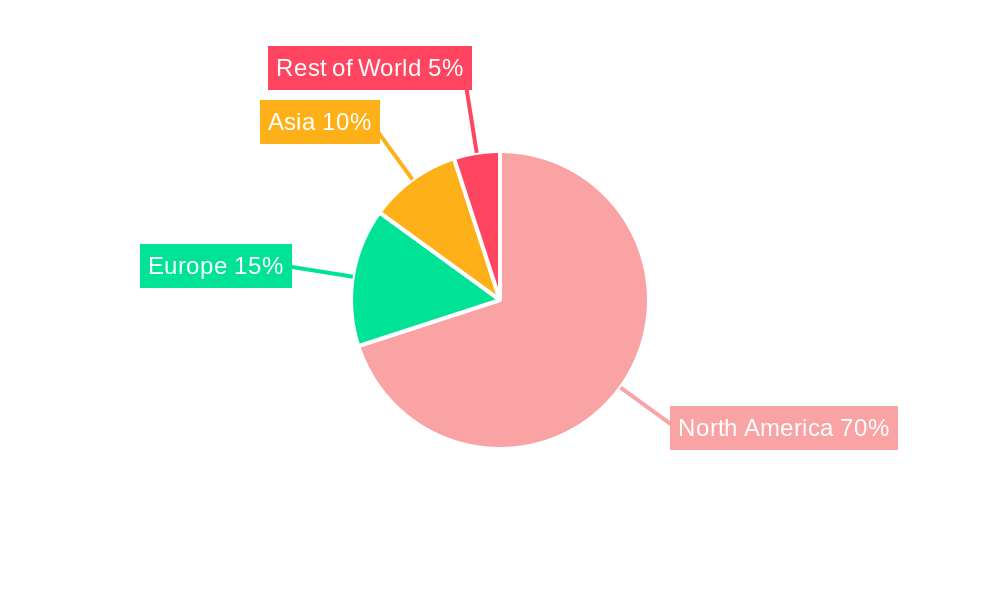
The US P&C insurance market is geographically diverse, with significant activity across all regions. However, certain states demonstrate higher premiums and market activity due to factors like population density, economic conditions, and risk profiles.
Dominant Regions/Segments: California, Texas, Florida, and New York represent major markets due to their large populations and diverse economic activities. The commercial lines segment, encompassing commercial auto, general liability, and workers' compensation, accounts for a significant portion of the overall market revenue due to the varied risk factors associated with commercial activities.
Drivers of Dominance:
- Economic Growth: Strong economic growth in certain regions leads to higher property values, increased vehicle ownership, and greater business activity, directly boosting insurance demand.
- Infrastructure Development: Significant investments in infrastructure projects translate into higher insured values, driving demand for construction and property insurance.
- Population Density: Higher population density in urban areas increases the frequency of accidents and property damage, increasing the demand for insurance.
Property and Casualty Insurance Industry in US Product Developments
Significant advancements in technology are driving the development of innovative P&C insurance products. Telematics, AI-powered risk assessment, and data analytics enable insurers to offer personalized pricing and risk management solutions, enhancing accuracy and efficiency. The use of IoT devices for property monitoring and usage-based insurance (UBI) programs for auto insurance are transforming product offerings. These innovations provide competitive advantages by improving underwriting accuracy, reducing fraud, and enhancing customer experience.
Challenges in the Property and Casualty Insurance Industry in US Market
The US P&C insurance market faces several significant challenges, including increasingly stringent regulatory environments, which can limit profitability and increase compliance costs. Supply chain disruptions, particularly impacting the availability of reinsurance capacity, add to operational complexities. Intense competition, including from Insurtech companies, puts pressure on pricing and profitability. These factors combined could lead to a xx% reduction in profitability for smaller insurers by 2033.
Forces Driving Property and Casualty Insurance Industry in US Growth
Several key factors are driving the growth of the US P&C insurance market. Technological advancements, such as AI and machine learning, are improving efficiency and enabling personalized products. Economic growth, particularly in specific sectors like construction and manufacturing, increases demand for property and liability insurance. Favorable regulatory environments that promote innovation and competition can enhance market growth.
Long-Term Growth Catalysts in Property and Casualty Insurance Industry in US Market
Long-term growth in the US P&C insurance market hinges on continued innovation in risk management and product development. Strategic partnerships between traditional insurers and Insurtech firms can leverage technology to expand market reach and offer better services. Expansion into new markets, such as specialized insurance products for emerging technologies, can create significant growth opportunities.
Emerging Opportunities in Property and Casualty Insurance Industry in US
The increasing adoption of digital technologies opens new opportunities for personalized insurance solutions, targeted marketing, and improved customer experience. Expansion into underserved markets, such as those with limited access to traditional insurance products, presents significant potential. The development of specialized insurance products to address emerging risks, such as cyber threats and climate change, offers attractive growth prospects.
Leading Players in the Property and Casualty Insurance Industry in US Sector
- Berkshire Hathaway Inc.
- American International Group Inc.
- Liberty Mutual Holding Company Inc.
- The Progressive Corporation
- The Travelers Companies Inc.
- United Services Automobile Association
- Farmers Group Inc.
- American Family Mutual Insurance Company S I
- W R Berkley Corporation
- American Financial Group Inc.
- List Not Exhaustive
Key Milestones in Property and Casualty Insurance Industry in US Industry
- 2020: Increased adoption of telematics in auto insurance.
- 2021: Several significant M&A deals shaping the industry landscape.
- 2022: Growing focus on cyber insurance due to heightened cyber threats.
- 2023: Expansion of Insurtech solutions impacting underwriting and claims processes.
- 2024: Regulatory changes impacting data privacy and insurance pricing.
Strategic Outlook for Property and Casualty Insurance Industry in US Market
The future of the US P&C insurance market is bright, driven by a confluence of factors including technological advancements, economic growth, and evolving consumer preferences. Strategic opportunities abound for insurers willing to embrace innovation, adapt to changing market dynamics, and capitalize on emerging trends. The market is expected to witness continued consolidation, further technological integration, and a greater focus on personalized customer experiences.
Property and Casualty Insurance Industry in US Segmentation
-
1. Insurance Type
- 1.1. Home
- 1.2. Motor
- 1.3. Others
-
2. Channel of Distribution
- 2.1. Direct
- 2.2. Agency
- 2.3. Banks
- 2.4. Others
Property and Casualty Insurance Industry in US Segmentation By Geography
-
1. North America
- 1.1. United States
- 1.2. Canada
- 1.3. Mexico
-
2. South America
- 2.1. Brazil
- 2.2. Argentina
- 2.3. Rest of South America
-
3. Europe
- 3.1. United Kingdom
- 3.2. Germany
- 3.3. France
- 3.4. Italy
- 3.5. Spain
- 3.6. Russia
- 3.7. Benelux
- 3.8. Nordics
- 3.9. Rest of Europe
-
4. Middle East & Africa
- 4.1. Turkey
- 4.2. Israel
- 4.3. GCC
- 4.4. North Africa
- 4.5. South Africa
- 4.6. Rest of Middle East & Africa
-
5. Asia Pacific
- 5.1. China
- 5.2. India
- 5.3. Japan
- 5.4. South Korea
- 5.5. ASEAN
- 5.6. Oceania
- 5.7. Rest of Asia Pacific
Property and Casualty Insurance Industry in US Regional Market Share
Geographic Coverage of Property and Casualty Insurance Industry in US
Property and Casualty Insurance Industry in US REPORT HIGHLIGHTS
| Aspects | Details |
|---|---|
| Study Period | 2020-2034 |
| Base Year | 2025 |
| Estimated Year | 2026 |
| Forecast Period | 2026-2034 |
| Historical Period | 2020-2025 |
| Growth Rate | CAGR of < 6.00% from 2020-2034 |
| Segmentation |
|
Table of Contents
- 1. Introduction
- 1.1. Research Scope
- 1.2. Market Segmentation
- 1.3. Research Objective
- 1.4. Definitions and Assumptions
- 2. Executive Summary
- 2.1. Market Snapshot
- 3. Market Dynamics
- 3.1. Market Drivers
- 3.2. Market Restrains
- 3.3. Market Trends
- 3.4. Market Opportunities
- 4. Market Factor Analysis
- 4.1. Porters Five Forces
- 4.1.1. Bargaining Power of Suppliers
- 4.1.2. Bargaining Power of Buyers
- 4.1.3. Threat of New Entrants
- 4.1.4. Threat of Substitutes
- 4.1.5. Competitive Rivalry
- 4.2. PESTEL analysis
- 4.3. BCG Analysis
- 4.3.1. Stars (High Growth, High Market Share)
- 4.3.2. Cash Cows (Low Growth, High Market Share)
- 4.3.3. Question Mark (High Growth, Low Market Share)
- 4.3.4. Dogs (Low Growth, Low Market Share)
- 4.4. Ansoff Matrix Analysis
- 4.5. Supply Chain Analysis
- 4.6. Regulatory Landscape
- 4.7. Current Market Potential and Opportunity Assessment (TAM–SAM–SOM Framework)
- 4.8. MSR Analyst Note
- 4.1. Porters Five Forces
- 5. Market Analysis, Insights and Forecast 2021-2033
- 5.1. Market Analysis, Insights and Forecast - by Insurance Type
- 5.1.1. Home
- 5.1.2. Motor
- 5.1.3. Others
- 5.2. Market Analysis, Insights and Forecast - by Channel of Distribution
- 5.2.1. Direct
- 5.2.2. Agency
- 5.2.3. Banks
- 5.2.4. Others
- 5.3. Market Analysis, Insights and Forecast - by Region
- 5.3.1. North America
- 5.3.2. South America
- 5.3.3. Europe
- 5.3.4. Middle East & Africa
- 5.3.5. Asia Pacific
- 5.1. Market Analysis, Insights and Forecast - by Insurance Type
- 6. Global Property and Casualty Insurance Industry in US Analysis, Insights and Forecast, 2021-2033
- 6.1. Market Analysis, Insights and Forecast - by Insurance Type
- 6.1.1. Home
- 6.1.2. Motor
- 6.1.3. Others
- 6.2. Market Analysis, Insights and Forecast - by Channel of Distribution
- 6.2.1. Direct
- 6.2.2. Agency
- 6.2.3. Banks
- 6.2.4. Others
- 6.1. Market Analysis, Insights and Forecast - by Insurance Type
- 7. North America Property and Casualty Insurance Industry in US Analysis, Insights and Forecast, 2020-2032
- 7.1. Market Analysis, Insights and Forecast - by Insurance Type
- 7.1.1. Home
- 7.1.2. Motor
- 7.1.3. Others
- 7.2. Market Analysis, Insights and Forecast - by Channel of Distribution
- 7.2.1. Direct
- 7.2.2. Agency
- 7.2.3. Banks
- 7.2.4. Others
- 7.1. Market Analysis, Insights and Forecast - by Insurance Type
- 8. South America Property and Casualty Insurance Industry in US Analysis, Insights and Forecast, 2020-2032
- 8.1. Market Analysis, Insights and Forecast - by Insurance Type
- 8.1.1. Home
- 8.1.2. Motor
- 8.1.3. Others
- 8.2. Market Analysis, Insights and Forecast - by Channel of Distribution
- 8.2.1. Direct
- 8.2.2. Agency
- 8.2.3. Banks
- 8.2.4. Others
- 8.1. Market Analysis, Insights and Forecast - by Insurance Type
- 9. Europe Property and Casualty Insurance Industry in US Analysis, Insights and Forecast, 2020-2032
- 9.1. Market Analysis, Insights and Forecast - by Insurance Type
- 9.1.1. Home
- 9.1.2. Motor
- 9.1.3. Others
- 9.2. Market Analysis, Insights and Forecast - by Channel of Distribution
- 9.2.1. Direct
- 9.2.2. Agency
- 9.2.3. Banks
- 9.2.4. Others
- 9.1. Market Analysis, Insights and Forecast - by Insurance Type
- 10. Middle East & Africa Property and Casualty Insurance Industry in US Analysis, Insights and Forecast, 2020-2032
- 10.1. Market Analysis, Insights and Forecast - by Insurance Type
- 10.1.1. Home
- 10.1.2. Motor
- 10.1.3. Others
- 10.2. Market Analysis, Insights and Forecast - by Channel of Distribution
- 10.2.1. Direct
- 10.2.2. Agency
- 10.2.3. Banks
- 10.2.4. Others
- 10.1. Market Analysis, Insights and Forecast - by Insurance Type
- 11. Asia Pacific Property and Casualty Insurance Industry in US Analysis, Insights and Forecast, 2020-2032
- 11.1. Market Analysis, Insights and Forecast - by Insurance Type
- 11.1.1. Home
- 11.1.2. Motor
- 11.1.3. Others
- 11.2. Market Analysis, Insights and Forecast - by Channel of Distribution
- 11.2.1. Direct
- 11.2.2. Agency
- 11.2.3. Banks
- 11.2.4. Others
- 11.1. Market Analysis, Insights and Forecast - by Insurance Type
- 12. Competitive Analysis
- 12.1. Company Profiles
- 12.1.1 Berkshire Hathaway Inc
- 12.1.1.1. Company Overview
- 12.1.1.2. Products
- 12.1.1.3. Company Financials
- 12.1.1.4. SWOT Analysis
- 12.1.2 American International Group Inc
- 12.1.2.1. Company Overview
- 12.1.2.2. Products
- 12.1.2.3. Company Financials
- 12.1.2.4. SWOT Analysis
- 12.1.3 Liberty Mutual Holding Company Inc
- 12.1.3.1. Company Overview
- 12.1.3.2. Products
- 12.1.3.3. Company Financials
- 12.1.3.4. SWOT Analysis
- 12.1.4 The Progressive Corporation
- 12.1.4.1. Company Overview
- 12.1.4.2. Products
- 12.1.4.3. Company Financials
- 12.1.4.4. SWOT Analysis
- 12.1.5 The Travelers Companies Inc
- 12.1.5.1. Company Overview
- 12.1.5.2. Products
- 12.1.5.3. Company Financials
- 12.1.5.4. SWOT Analysis
- 12.1.6 United Services Automobile Association
- 12.1.6.1. Company Overview
- 12.1.6.2. Products
- 12.1.6.3. Company Financials
- 12.1.6.4. SWOT Analysis
- 12.1.7 Farmers Group Inc
- 12.1.7.1. Company Overview
- 12.1.7.2. Products
- 12.1.7.3. Company Financials
- 12.1.7.4. SWOT Analysis
- 12.1.8 American Family Mutual Insurance Company S I
- 12.1.8.1. Company Overview
- 12.1.8.2. Products
- 12.1.8.3. Company Financials
- 12.1.8.4. SWOT Analysis
- 12.1.9 W R Berkley Corporation
- 12.1.9.1. Company Overview
- 12.1.9.2. Products
- 12.1.9.3. Company Financials
- 12.1.9.4. SWOT Analysis
- 12.1.10 American Financial Group Inc *List Not Exhaustive
- 12.1.10.1. Company Overview
- 12.1.10.2. Products
- 12.1.10.3. Company Financials
- 12.1.10.4. SWOT Analysis
- 12.1.1 Berkshire Hathaway Inc
- 12.2. Market Entropy
- 12.2.1 Company's Key Areas Served
- 12.2.2 Recent Developments
- 12.3. Company Market Share Analysis 2025
- 12.3.1 Top 5 Companies Market Share Analysis
- 12.3.2 Top 3 Companies Market Share Analysis
- 12.4. List of Potential Customers
- 13. Research Methodology
List of Figures
- Figure 1: Global Property and Casualty Insurance Industry in US Revenue Breakdown (Million, %) by Region 2025 & 2033
- Figure 2: North America Property and Casualty Insurance Industry in US Revenue (Million), by Insurance Type 2025 & 2033
- Figure 3: North America Property and Casualty Insurance Industry in US Revenue Share (%), by Insurance Type 2025 & 2033
- Figure 4: North America Property and Casualty Insurance Industry in US Revenue (Million), by Channel of Distribution 2025 & 2033
- Figure 5: North America Property and Casualty Insurance Industry in US Revenue Share (%), by Channel of Distribution 2025 & 2033
- Figure 6: North America Property and Casualty Insurance Industry in US Revenue (Million), by Country 2025 & 2033
- Figure 7: North America Property and Casualty Insurance Industry in US Revenue Share (%), by Country 2025 & 2033
- Figure 8: South America Property and Casualty Insurance Industry in US Revenue (Million), by Insurance Type 2025 & 2033
- Figure 9: South America Property and Casualty Insurance Industry in US Revenue Share (%), by Insurance Type 2025 & 2033
- Figure 10: South America Property and Casualty Insurance Industry in US Revenue (Million), by Channel of Distribution 2025 & 2033
- Figure 11: South America Property and Casualty Insurance Industry in US Revenue Share (%), by Channel of Distribution 2025 & 2033
- Figure 12: South America Property and Casualty Insurance Industry in US Revenue (Million), by Country 2025 & 2033
- Figure 13: South America Property and Casualty Insurance Industry in US Revenue Share (%), by Country 2025 & 2033
- Figure 14: Europe Property and Casualty Insurance Industry in US Revenue (Million), by Insurance Type 2025 & 2033
- Figure 15: Europe Property and Casualty Insurance Industry in US Revenue Share (%), by Insurance Type 2025 & 2033
- Figure 16: Europe Property and Casualty Insurance Industry in US Revenue (Million), by Channel of Distribution 2025 & 2033
- Figure 17: Europe Property and Casualty Insurance Industry in US Revenue Share (%), by Channel of Distribution 2025 & 2033
- Figure 18: Europe Property and Casualty Insurance Industry in US Revenue (Million), by Country 2025 & 2033
- Figure 19: Europe Property and Casualty Insurance Industry in US Revenue Share (%), by Country 2025 & 2033
- Figure 20: Middle East & Africa Property and Casualty Insurance Industry in US Revenue (Million), by Insurance Type 2025 & 2033
- Figure 21: Middle East & Africa Property and Casualty Insurance Industry in US Revenue Share (%), by Insurance Type 2025 & 2033
- Figure 22: Middle East & Africa Property and Casualty Insurance Industry in US Revenue (Million), by Channel of Distribution 2025 & 2033
- Figure 23: Middle East & Africa Property and Casualty Insurance Industry in US Revenue Share (%), by Channel of Distribution 2025 & 2033
- Figure 24: Middle East & Africa Property and Casualty Insurance Industry in US Revenue (Million), by Country 2025 & 2033
- Figure 25: Middle East & Africa Property and Casualty Insurance Industry in US Revenue Share (%), by Country 2025 & 2033
- Figure 26: Asia Pacific Property and Casualty Insurance Industry in US Revenue (Million), by Insurance Type 2025 & 2033
- Figure 27: Asia Pacific Property and Casualty Insurance Industry in US Revenue Share (%), by Insurance Type 2025 & 2033
- Figure 28: Asia Pacific Property and Casualty Insurance Industry in US Revenue (Million), by Channel of Distribution 2025 & 2033
- Figure 29: Asia Pacific Property and Casualty Insurance Industry in US Revenue Share (%), by Channel of Distribution 2025 & 2033
- Figure 30: Asia Pacific Property and Casualty Insurance Industry in US Revenue (Million), by Country 2025 & 2033
- Figure 31: Asia Pacific Property and Casualty Insurance Industry in US Revenue Share (%), by Country 2025 & 2033
List of Tables
- Table 1: Global Property and Casualty Insurance Industry in US Revenue Million Forecast, by Insurance Type 2020 & 2033
- Table 2: Global Property and Casualty Insurance Industry in US Revenue Million Forecast, by Channel of Distribution 2020 & 2033
- Table 3: Global Property and Casualty Insurance Industry in US Revenue Million Forecast, by Region 2020 & 2033
- Table 4: Global Property and Casualty Insurance Industry in US Revenue Million Forecast, by Insurance Type 2020 & 2033
- Table 5: Global Property and Casualty Insurance Industry in US Revenue Million Forecast, by Channel of Distribution 2020 & 2033
- Table 6: Global Property and Casualty Insurance Industry in US Revenue Million Forecast, by Country 2020 & 2033
- Table 7: United States Property and Casualty Insurance Industry in US Revenue (Million) Forecast, by Application 2020 & 2033
- Table 8: Canada Property and Casualty Insurance Industry in US Revenue (Million) Forecast, by Application 2020 & 2033
- Table 9: Mexico Property and Casualty Insurance Industry in US Revenue (Million) Forecast, by Application 2020 & 2033
- Table 10: Global Property and Casualty Insurance Industry in US Revenue Million Forecast, by Insurance Type 2020 & 2033
- Table 11: Global Property and Casualty Insurance Industry in US Revenue Million Forecast, by Channel of Distribution 2020 & 2033
- Table 12: Global Property and Casualty Insurance Industry in US Revenue Million Forecast, by Country 2020 & 2033
- Table 13: Brazil Property and Casualty Insurance Industry in US Revenue (Million) Forecast, by Application 2020 & 2033
- Table 14: Argentina Property and Casualty Insurance Industry in US Revenue (Million) Forecast, by Application 2020 & 2033
- Table 15: Rest of South America Property and Casualty Insurance Industry in US Revenue (Million) Forecast, by Application 2020 & 2033
- Table 16: Global Property and Casualty Insurance Industry in US Revenue Million Forecast, by Insurance Type 2020 & 2033
- Table 17: Global Property and Casualty Insurance Industry in US Revenue Million Forecast, by Channel of Distribution 2020 & 2033
- Table 18: Global Property and Casualty Insurance Industry in US Revenue Million Forecast, by Country 2020 & 2033
- Table 19: United Kingdom Property and Casualty Insurance Industry in US Revenue (Million) Forecast, by Application 2020 & 2033
- Table 20: Germany Property and Casualty Insurance Industry in US Revenue (Million) Forecast, by Application 2020 & 2033
- Table 21: France Property and Casualty Insurance Industry in US Revenue (Million) Forecast, by Application 2020 & 2033
- Table 22: Italy Property and Casualty Insurance Industry in US Revenue (Million) Forecast, by Application 2020 & 2033
- Table 23: Spain Property and Casualty Insurance Industry in US Revenue (Million) Forecast, by Application 2020 & 2033
- Table 24: Russia Property and Casualty Insurance Industry in US Revenue (Million) Forecast, by Application 2020 & 2033
- Table 25: Benelux Property and Casualty Insurance Industry in US Revenue (Million) Forecast, by Application 2020 & 2033
- Table 26: Nordics Property and Casualty Insurance Industry in US Revenue (Million) Forecast, by Application 2020 & 2033
- Table 27: Rest of Europe Property and Casualty Insurance Industry in US Revenue (Million) Forecast, by Application 2020 & 2033
- Table 28: Global Property and Casualty Insurance Industry in US Revenue Million Forecast, by Insurance Type 2020 & 2033
- Table 29: Global Property and Casualty Insurance Industry in US Revenue Million Forecast, by Channel of Distribution 2020 & 2033
- Table 30: Global Property and Casualty Insurance Industry in US Revenue Million Forecast, by Country 2020 & 2033
- Table 31: Turkey Property and Casualty Insurance Industry in US Revenue (Million) Forecast, by Application 2020 & 2033
- Table 32: Israel Property and Casualty Insurance Industry in US Revenue (Million) Forecast, by Application 2020 & 2033
- Table 33: GCC Property and Casualty Insurance Industry in US Revenue (Million) Forecast, by Application 2020 & 2033
- Table 34: North Africa Property and Casualty Insurance Industry in US Revenue (Million) Forecast, by Application 2020 & 2033
- Table 35: South Africa Property and Casualty Insurance Industry in US Revenue (Million) Forecast, by Application 2020 & 2033
- Table 36: Rest of Middle East & Africa Property and Casualty Insurance Industry in US Revenue (Million) Forecast, by Application 2020 & 2033
- Table 37: Global Property and Casualty Insurance Industry in US Revenue Million Forecast, by Insurance Type 2020 & 2033
- Table 38: Global Property and Casualty Insurance Industry in US Revenue Million Forecast, by Channel of Distribution 2020 & 2033
- Table 39: Global Property and Casualty Insurance Industry in US Revenue Million Forecast, by Country 2020 & 2033
- Table 40: China Property and Casualty Insurance Industry in US Revenue (Million) Forecast, by Application 2020 & 2033
- Table 41: India Property and Casualty Insurance Industry in US Revenue (Million) Forecast, by Application 2020 & 2033
- Table 42: Japan Property and Casualty Insurance Industry in US Revenue (Million) Forecast, by Application 2020 & 2033
- Table 43: South Korea Property and Casualty Insurance Industry in US Revenue (Million) Forecast, by Application 2020 & 2033
- Table 44: ASEAN Property and Casualty Insurance Industry in US Revenue (Million) Forecast, by Application 2020 & 2033
- Table 45: Oceania Property and Casualty Insurance Industry in US Revenue (Million) Forecast, by Application 2020 & 2033
- Table 46: Rest of Asia Pacific Property and Casualty Insurance Industry in US Revenue (Million) Forecast, by Application 2020 & 2033
Frequently Asked Questions
1. What is the projected Compound Annual Growth Rate (CAGR) of the Property and Casualty Insurance Industry in US?
The projected CAGR is approximately < 6.00%.
2. Which companies are prominent players in the Property and Casualty Insurance Industry in US?
Key companies in the market include Berkshire Hathaway Inc, American International Group Inc, Liberty Mutual Holding Company Inc, The Progressive Corporation, The Travelers Companies Inc, United Services Automobile Association, Farmers Group Inc, American Family Mutual Insurance Company S I, W R Berkley Corporation, American Financial Group Inc *List Not Exhaustive.
3. What are the main segments of the Property and Casualty Insurance Industry in US?
The market segments include Insurance Type, Channel of Distribution.
4. Can you provide details about the market size?
The market size is estimated to be USD XX Million as of 2022.
5. What are some drivers contributing to market growth?
N/A
6. What are the notable trends driving market growth?
RPA is Going to Help in Quick Process:.
7. Are there any restraints impacting market growth?
N/A
8. Can you provide examples of recent developments in the market?
N/A
9. What pricing options are available for accessing the report?
Pricing options include single-user, multi-user, and enterprise licenses priced at USD 3800, USD 4500, and USD 5800 respectively.
10. Is the market size provided in terms of value or volume?
The market size is provided in terms of value, measured in Million.
11. Are there any specific market keywords associated with the report?
Yes, the market keyword associated with the report is "Property and Casualty Insurance Industry in US," which aids in identifying and referencing the specific market segment covered.
12. How do I determine which pricing option suits my needs best?
The pricing options vary based on user requirements and access needs. Individual users may opt for single-user licenses, while businesses requiring broader access may choose multi-user or enterprise licenses for cost-effective access to the report.
13. Are there any additional resources or data provided in the Property and Casualty Insurance Industry in US report?
While the report offers comprehensive insights, it's advisable to review the specific contents or supplementary materials provided to ascertain if additional resources or data are available.
14. How can I stay updated on further developments or reports in the Property and Casualty Insurance Industry in US?
To stay informed about further developments, trends, and reports in the Property and Casualty Insurance Industry in US, consider subscribing to industry newsletters, following relevant companies and organizations, or regularly checking reputable industry news sources and publications.
Methodology
Step 1 - Identification of Relevant Samples Size from Population Database


Step 2 - Approaches for Defining Global Market Size (Value, Volume* & Price*)

Note*: In applicable scenarios
Step 3 - Data Sources
Primary Research
- Web Analytics
- Survey Reports
- Research Institute
- Latest Research Reports
- Opinion Leaders
Secondary Research
- Annual Reports
- White Paper
- Latest Press Release
- Industry Association
- Paid Database
- Investor Presentations

Step 4 - Data Triangulation
Involves using different sources of information in order to increase the validity of a study
These sources are likely to be stakeholders in a program - participants, other researchers, program staff, other community members, and so on.
Then we put all data in single framework & apply various statistical tools to find out the dynamic on the market.
During the analysis stage, feedback from the stakeholder groups would be compared to determine areas of agreement as well as areas of divergence