

Key Insights
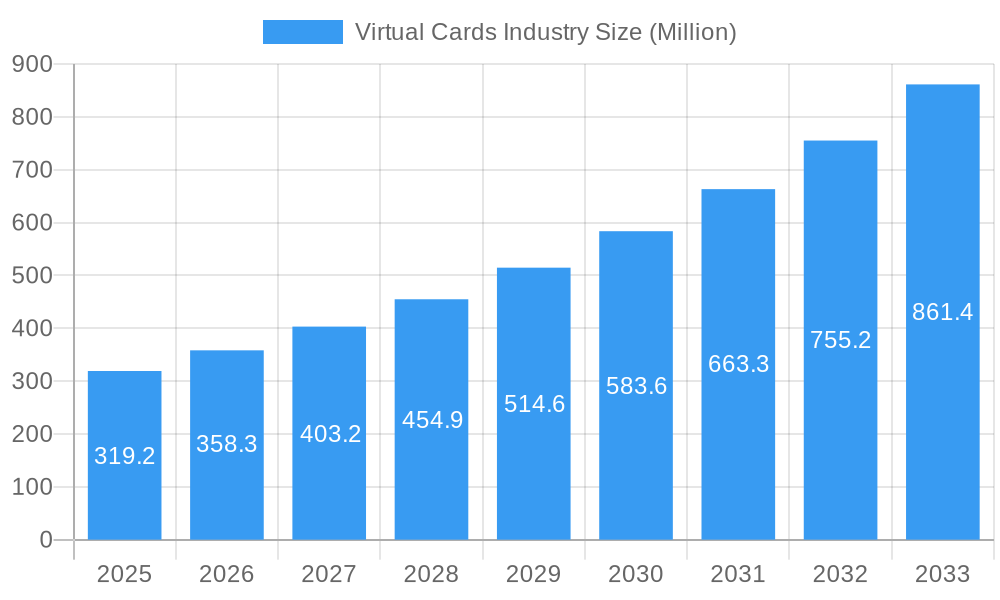
The global virtual cards market is experiencing robust growth, projected to reach $319.20 million in 2025 and maintain a Compound Annual Growth Rate (CAGR) exceeding 12% from 2025 to 2033. This expansion is driven by several key factors. The increasing adoption of digital payment methods across both B2B and B2C segments is a primary driver. Businesses are increasingly leveraging virtual cards for streamlined expense management, enhanced security, and improved reconciliation processes. Simultaneously, consumers are embracing the convenience and security offered by virtual cards for online and in-person purchases, contributing to the market's growth across various product types, including B2B virtual cards, B2C remote payment virtual cards, and B2C POS virtual cards. Furthermore, the growing penetration of e-commerce and the rising demand for secure payment solutions are fueling the market's expansion. The market is segmented by end-user (consumer and business) and geographically spans North America, South America, Europe, Asia Pacific, and the Middle East & Africa, with North America currently holding a significant market share. Competition is intense, with established players like American Express, Mastercard, and JPMorgan Chase alongside specialized fintech companies such as Abine Inc., Fraedom Holdings, and MineralTree actively vying for market share.
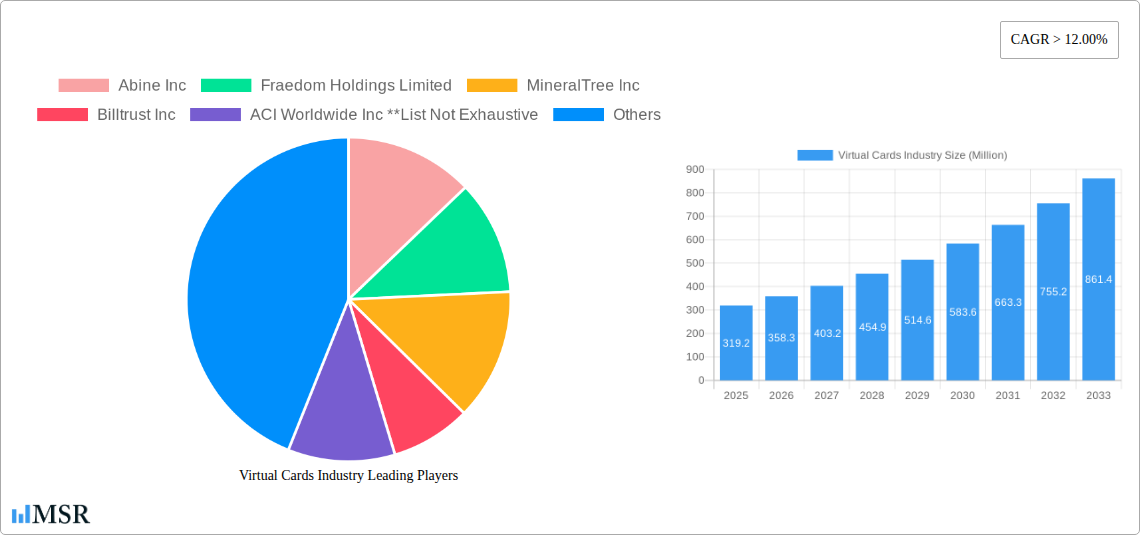
Virtual Cards Industry Market Size (In Million)
The continued growth of the virtual cards market is expected to be fueled by several emerging trends. The increasing integration of virtual cards with mobile wallets and other digital payment platforms enhances convenience and accessibility for users. Moreover, the development of sophisticated fraud prevention technologies further strengthens the security of virtual cards, encouraging wider adoption. However, challenges such as concerns regarding data security and the need for robust infrastructure to support widespread virtual card usage represent potential restraints to market growth. Despite these challenges, the long-term outlook for the virtual cards market remains positive, driven by continuous innovation, increasing consumer demand, and the ongoing digital transformation of the global financial landscape. The diverse range of offerings caters to a broad spectrum of needs, ensuring the market's sustained growth throughout the forecast period.
Virtual Cards Industry Company Market Share
Virtual Cards Industry Market Report: 2019-2033
This comprehensive report provides an in-depth analysis of the global virtual cards industry, encompassing market size, growth drivers, key players, and future trends. With a study period spanning 2019-2033, a base year of 2025, and a forecast period of 2025-2033, this report offers invaluable insights for industry stakeholders, investors, and businesses seeking to navigate this rapidly evolving landscape. The market is projected to reach $XX Million by 2033, exhibiting a CAGR of XX% during the forecast period.
Virtual Cards Industry Market Concentration & Dynamics
The virtual cards industry exhibits a moderately concentrated market structure, with key players like Mastercard Incorporated, American Express Company, and JPMorgan Chase & Co. holding significant market share. However, the emergence of fintech companies and innovative startups is increasing competition. The industry is characterized by a dynamic innovation ecosystem, driven by advancements in mobile payment technologies, blockchain, and AI. Regulatory frameworks, varying across jurisdictions, significantly influence market dynamics. Substitute products, such as traditional credit and debit cards, continue to pose competitive pressure. End-user trends are shifting towards contactless payments and increased digital adoption, fueling the growth of virtual cards. Mergers and acquisitions (M&A) are frequent, reflecting the strategic importance of expanding market reach and technological capabilities. In 2024, approximately XX M&A deals were recorded in the industry, resulting in a market share redistribution of approximately XX%.
- Market Concentration: Moderately concentrated, with significant players holding a substantial share.
- Innovation: Rapid advancements in mobile payments, blockchain, and AI driving innovation.
- Regulatory Framework: Varying regulations across different regions impact market growth.
- Substitute Products: Traditional payment methods pose ongoing competitive pressure.
- End-User Trends: Growing preference for contactless and digital payments.
- M&A Activity: Significant M&A activity driving market consolidation and technological advancements.
Virtual Cards Industry Industry Insights & Trends
The global virtual cards market is experiencing robust growth, driven by increasing digitalization, the expansion of e-commerce, and the rising demand for secure and convenient payment solutions. Technological disruptions, such as the integration of biometric authentication and tokenization, are enhancing security and user experience. Evolving consumer behaviors, with a preference for contactless payments and mobile wallets, are further propelling market expansion. The market size in 2025 is estimated at $XX Million, and the overall market is expected to reach $XX Million by 2033. This growth is attributed to several factors, including the increasing adoption of virtual cards by businesses for expense management and improved security, as well as the expanding use of virtual cards for online purchases and in-store payments. The rise of Buy Now Pay Later (BNPL) services also contributes significantly to market expansion.
Key Markets & Segments Leading Virtual Cards Industry
The North American region currently dominates the virtual cards market, driven by high levels of digital adoption and a robust technological infrastructure. Within product types, B2B virtual cards hold the largest market share due to their extensive use in corporate expense management. However, the B2C segment is experiencing rapid growth, particularly B2C remote payment virtual cards, fueled by the rising popularity of e-commerce.
- Dominant Region: North America
- Dominant Product Type: B2B Virtual Cards
- Dominant End User: Business Use
Drivers for B2B Virtual Cards:
- Increasing demand for enhanced security and fraud prevention in business transactions.
- Growing adoption of virtual cards for expense management and reconciliation.
- Need for better control and visibility over corporate spending.
Drivers for B2C Remote Payment Virtual Cards:
- Rise of e-commerce and online shopping.
- Increasing preference for secure and convenient online payment methods.
- Growing adoption of mobile wallets and digital payment platforms.
Drivers for B2C POS Virtual Cards:
- Expanding use of contactless payment technologies.
- Growing demand for quick and easy in-store payments.
- Increased adoption of mobile payment apps and digital wallets.
Virtual Cards Industry Product Developments
Recent product innovations include the integration of advanced security features such as tokenization and biometric authentication, enhancing the security and ease of use of virtual cards. The development of virtual cards with embedded loyalty programs and rewards systems is also gaining traction, further enhancing their appeal to consumers. These advancements are enhancing the competitiveness of virtual cards and expanding their applications across various industries.
Challenges in the Virtual Cards Industry Market
The virtual cards industry faces challenges such as stringent regulatory requirements, especially concerning data privacy and security. Supply chain disruptions impacting the production and distribution of virtual cards can also negatively affect market growth. Furthermore, the competitive landscape, with numerous players offering similar services, creates significant price pressures. These factors contribute to a considerable level of uncertainty within the market, resulting in an estimated XX% reduction in projected growth in 2024.
Forces Driving Virtual Cards Industry Growth
Key growth drivers include technological advancements such as improved security features and user-friendly interfaces, the increasing adoption of digital payment methods, and favorable regulatory environments in some regions. Expanding e-commerce and the growing preference for contactless payments further accelerate market expansion. Government initiatives to promote digital transactions also contribute positively.
Challenges in the Virtual Cards Industry Market
Long-term growth catalysts include continued innovation in security technologies, strategic partnerships between financial institutions and technology providers, and expansion into new geographic markets. The growing adoption of virtual cards across various sectors will also fuel market growth over the long term.
Emerging Opportunities in Virtual Cards Industry
Emerging opportunities lie in the integration of virtual cards with other financial services, such as BNPL and loyalty programs. The expansion into underserved markets and the development of virtual cards tailored to specific industry needs present significant growth potential. Furthermore, the increasing adoption of virtual cards by SMEs and micro-businesses offers a promising avenue for market expansion.
Leading Players in the Virtual Cards Industry Sector
- Abine Inc
- Fraedom Holdings Limited
- MineralTree Inc
- Billtrust Inc
- ACI Worldwide Inc
- American Express Company
- Mastercard Incorporated
- JPMorgan Chase & Co
- Alipay com Co Ltd
- Skrill USA Inc
Key Milestones in Virtual Cards Industry Industry
- December 2023: Conferma Pay and Mastercard expanded their partnership to enable mobile virtual card payments, enhancing convenience and expanding market reach.
- May 2022: Mastercard and OPay announced a strategic partnership to boost financial inclusion and digital commerce across the Middle East and Africa, significantly expanding market access.
Strategic Outlook for Virtual Cards Industry Market
The future of the virtual cards industry is bright, driven by continuous technological innovation and expanding adoption across various sectors. Strategic partnerships, expansion into new markets, and the development of value-added services will be crucial for success in this competitive landscape. The market is poised for significant growth, presenting lucrative opportunities for businesses with innovative solutions and strong strategic partnerships.
Virtual Cards Industry Segmentation
-
1. Product Type
- 1.1. B2B Virtual Cards
- 1.2. B2C Remote Payment Virtual Cards
- 1.3. B2C POS Virtual Cards
-
2. End User
- 2.1. Consumer Use
- 2.2. Business Use
Virtual Cards Industry Segmentation By Geography
-
1. North America
- 1.1. United States
- 1.2. Canada
- 1.3. Rest of North America
-
2. South America
- 2.1. Brazil
- 2.2. Peru
- 2.3. Rest of South America
-
3. Europe
- 3.1. United Kingdom
- 3.2. Germany
- 3.3. Rest of Europe
-
4. Asia Pacific
- 4.1. India
- 4.2. Japan
- 4.3. Rest of Asia Pacific
- 5. Middle East
-
6. Saudi Arabia
- 6.1. United Arab Emirates
- 6.2. Rest of Middle East
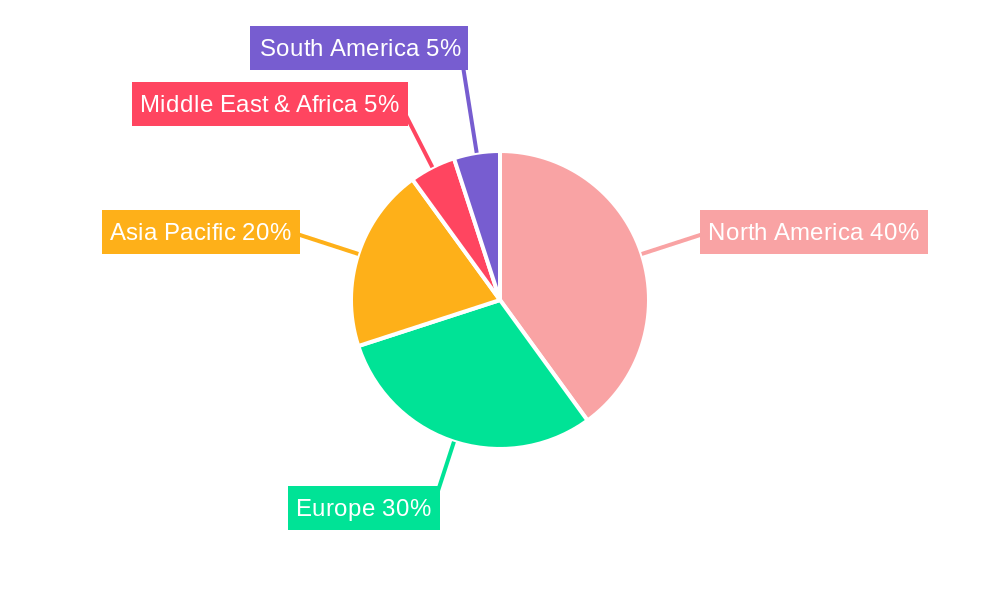
Virtual Cards Industry Regional Market Share
Geographic Coverage of Virtual Cards Industry
Virtual Cards Industry REPORT HIGHLIGHTS
| Aspects | Details |
|---|---|
| Study Period | 2020-2034 |
| Base Year | 2025 |
| Estimated Year | 2026 |
| Forecast Period | 2026-2034 |
| Historical Period | 2020-2025 |
| Growth Rate | CAGR of > 12.00% from 2020-2034 |
| Segmentation |
|
Table of Contents
- 1. Introduction
- 1.1. Research Scope
- 1.2. Market Segmentation
- 1.3. Research Objective
- 1.4. Definitions and Assumptions
- 2. Executive Summary
- 2.1. Market Snapshot
- 3. Market Dynamics
- 3.1. Market Drivers
- 3.2. Market Restrains
- 3.3. Market Trends
- 3.4. Market Opportunities
- 4. Market Factor Analysis
- 4.1. Porters Five Forces
- 4.1.1. Bargaining Power of Suppliers
- 4.1.2. Bargaining Power of Buyers
- 4.1.3. Threat of New Entrants
- 4.1.4. Threat of Substitutes
- 4.1.5. Competitive Rivalry
- 4.2. PESTEL analysis
- 4.3. BCG Analysis
- 4.3.1. Stars (High Growth, High Market Share)
- 4.3.2. Cash Cows (Low Growth, High Market Share)
- 4.3.3. Question Mark (High Growth, Low Market Share)
- 4.3.4. Dogs (Low Growth, Low Market Share)
- 4.4. Ansoff Matrix Analysis
- 4.5. Supply Chain Analysis
- 4.6. Regulatory Landscape
- 4.7. Current Market Potential and Opportunity Assessment (TAM–SAM–SOM Framework)
- 4.8. MSR Analyst Note
- 4.1. Porters Five Forces
- 5. Market Analysis, Insights and Forecast 2021-2033
- 5.1. Market Analysis, Insights and Forecast - by Product Type
- 5.1.1. B2B Virtual Cards
- 5.1.2. B2C Remote Payment Virtual Cards
- 5.1.3. B2C POS Virtual Cards
- 5.2. Market Analysis, Insights and Forecast - by End User
- 5.2.1. Consumer Use
- 5.2.2. Business Use
- 5.3. Market Analysis, Insights and Forecast - by Region
- 5.3.1. North America
- 5.3.2. South America
- 5.3.3. Europe
- 5.3.4. Asia Pacific
- 5.3.5. Middle East
- 5.3.6. Saudi Arabia
- 5.1. Market Analysis, Insights and Forecast - by Product Type
- 6. Virtual Cards Industry Analysis, Insights and Forecast, 2021-2033
- 6.1. Market Analysis, Insights and Forecast - by Product Type
- 6.1.1. B2B Virtual Cards
- 6.1.2. B2C Remote Payment Virtual Cards
- 6.1.3. B2C POS Virtual Cards
- 6.2. Market Analysis, Insights and Forecast - by End User
- 6.2.1. Consumer Use
- 6.2.2. Business Use
- 6.1. Market Analysis, Insights and Forecast - by Product Type
- 7. North America Virtual Cards Industry Analysis, Insights and Forecast, 2020-2032
- 7.1. Market Analysis, Insights and Forecast - by Product Type
- 7.1.1. B2B Virtual Cards
- 7.1.2. B2C Remote Payment Virtual Cards
- 7.1.3. B2C POS Virtual Cards
- 7.2. Market Analysis, Insights and Forecast - by End User
- 7.2.1. Consumer Use
- 7.2.2. Business Use
- 7.1. Market Analysis, Insights and Forecast - by Product Type
- 8. South America Virtual Cards Industry Analysis, Insights and Forecast, 2020-2032
- 8.1. Market Analysis, Insights and Forecast - by Product Type
- 8.1.1. B2B Virtual Cards
- 8.1.2. B2C Remote Payment Virtual Cards
- 8.1.3. B2C POS Virtual Cards
- 8.2. Market Analysis, Insights and Forecast - by End User
- 8.2.1. Consumer Use
- 8.2.2. Business Use
- 8.1. Market Analysis, Insights and Forecast - by Product Type
- 9. Europe Virtual Cards Industry Analysis, Insights and Forecast, 2020-2032
- 9.1. Market Analysis, Insights and Forecast - by Product Type
- 9.1.1. B2B Virtual Cards
- 9.1.2. B2C Remote Payment Virtual Cards
- 9.1.3. B2C POS Virtual Cards
- 9.2. Market Analysis, Insights and Forecast - by End User
- 9.2.1. Consumer Use
- 9.2.2. Business Use
- 9.1. Market Analysis, Insights and Forecast - by Product Type
- 10. Asia Pacific Virtual Cards Industry Analysis, Insights and Forecast, 2020-2032
- 10.1. Market Analysis, Insights and Forecast - by Product Type
- 10.1.1. B2B Virtual Cards
- 10.1.2. B2C Remote Payment Virtual Cards
- 10.1.3. B2C POS Virtual Cards
- 10.2. Market Analysis, Insights and Forecast - by End User
- 10.2.1. Consumer Use
- 10.2.2. Business Use
- 10.1. Market Analysis, Insights and Forecast - by Product Type
- 11. Middle East Virtual Cards Industry Analysis, Insights and Forecast, 2020-2032
- 11.1. Market Analysis, Insights and Forecast - by Product Type
- 11.1.1. B2B Virtual Cards
- 11.1.2. B2C Remote Payment Virtual Cards
- 11.1.3. B2C POS Virtual Cards
- 11.2. Market Analysis, Insights and Forecast - by End User
- 11.2.1. Consumer Use
- 11.2.2. Business Use
- 11.1. Market Analysis, Insights and Forecast - by Product Type
- 12. Saudi Arabia Virtual Cards Industry Analysis, Insights and Forecast, 2020-2032
- 12.1. Market Analysis, Insights and Forecast - by Product Type
- 12.1.1. B2B Virtual Cards
- 12.1.2. B2C Remote Payment Virtual Cards
- 12.1.3. B2C POS Virtual Cards
- 12.2. Market Analysis, Insights and Forecast - by End User
- 12.2.1. Consumer Use
- 12.2.2. Business Use
- 12.1. Market Analysis, Insights and Forecast - by Product Type
- 13. Competitive Analysis
- 13.1. Company Profiles
- 13.1.1 Abine Inc
- 13.1.1.1. Company Overview
- 13.1.1.2. Products
- 13.1.1.3. Company Financials
- 13.1.1.4. SWOT Analysis
- 13.1.2 Fraedom Holdings Limited
- 13.1.2.1. Company Overview
- 13.1.2.2. Products
- 13.1.2.3. Company Financials
- 13.1.2.4. SWOT Analysis
- 13.1.3 MineralTree Inc
- 13.1.3.1. Company Overview
- 13.1.3.2. Products
- 13.1.3.3. Company Financials
- 13.1.3.4. SWOT Analysis
- 13.1.4 Billtrust Inc
- 13.1.4.1. Company Overview
- 13.1.4.2. Products
- 13.1.4.3. Company Financials
- 13.1.4.4. SWOT Analysis
- 13.1.5 ACI Worldwide Inc **List Not Exhaustive
- 13.1.5.1. Company Overview
- 13.1.5.2. Products
- 13.1.5.3. Company Financials
- 13.1.5.4. SWOT Analysis
- 13.1.6 American Express Company
- 13.1.6.1. Company Overview
- 13.1.6.2. Products
- 13.1.6.3. Company Financials
- 13.1.6.4. SWOT Analysis
- 13.1.7 Mastercard Incorporated
- 13.1.7.1. Company Overview
- 13.1.7.2. Products
- 13.1.7.3. Company Financials
- 13.1.7.4. SWOT Analysis
- 13.1.8 JPMorgan Chase & Co
- 13.1.8.1. Company Overview
- 13.1.8.2. Products
- 13.1.8.3. Company Financials
- 13.1.8.4. SWOT Analysis
- 13.1.9 Alipay com Co Ltd
- 13.1.9.1. Company Overview
- 13.1.9.2. Products
- 13.1.9.3. Company Financials
- 13.1.9.4. SWOT Analysis
- 13.1.10 Skrill USA Inc
- 13.1.10.1. Company Overview
- 13.1.10.2. Products
- 13.1.10.3. Company Financials
- 13.1.10.4. SWOT Analysis
- 13.1.1 Abine Inc
- 13.2. Market Entropy
- 13.2.1 Company's Key Areas Served
- 13.2.2 Recent Developments
- 13.3. Company Market Share Analysis 2025
- 13.3.1 Top 5 Companies Market Share Analysis
- 13.3.2 Top 3 Companies Market Share Analysis
- 13.4. List of Potential Customers
- 14. Research Methodology
List of Figures
- Figure 1: Virtual Cards Industry Revenue Breakdown (Million, %) by Product 2025 & 2033
- Figure 2: Virtual Cards Industry Share (%) by Company 2025
List of Tables
- Table 1: Virtual Cards Industry Revenue Million Forecast, by Product Type 2020 & 2033
- Table 2: Virtual Cards Industry Revenue Million Forecast, by End User 2020 & 2033
- Table 3: Virtual Cards Industry Revenue Million Forecast, by Region 2020 & 2033
- Table 4: Virtual Cards Industry Revenue Million Forecast, by Product Type 2020 & 2033
- Table 5: Virtual Cards Industry Revenue Million Forecast, by End User 2020 & 2033
- Table 6: Virtual Cards Industry Revenue Million Forecast, by Country 2020 & 2033
- Table 7: United States Virtual Cards Industry Revenue (Million) Forecast, by Application 2020 & 2033
- Table 8: Canada Virtual Cards Industry Revenue (Million) Forecast, by Application 2020 & 2033
- Table 9: Rest of North America Virtual Cards Industry Revenue (Million) Forecast, by Application 2020 & 2033
- Table 10: Virtual Cards Industry Revenue Million Forecast, by Product Type 2020 & 2033
- Table 11: Virtual Cards Industry Revenue Million Forecast, by End User 2020 & 2033
- Table 12: Virtual Cards Industry Revenue Million Forecast, by Country 2020 & 2033
- Table 13: Brazil Virtual Cards Industry Revenue (Million) Forecast, by Application 2020 & 2033
- Table 14: Peru Virtual Cards Industry Revenue (Million) Forecast, by Application 2020 & 2033
- Table 15: Rest of South America Virtual Cards Industry Revenue (Million) Forecast, by Application 2020 & 2033
- Table 16: Virtual Cards Industry Revenue Million Forecast, by Product Type 2020 & 2033
- Table 17: Virtual Cards Industry Revenue Million Forecast, by End User 2020 & 2033
- Table 18: Virtual Cards Industry Revenue Million Forecast, by Country 2020 & 2033
- Table 19: United Kingdom Virtual Cards Industry Revenue (Million) Forecast, by Application 2020 & 2033
- Table 20: Germany Virtual Cards Industry Revenue (Million) Forecast, by Application 2020 & 2033
- Table 21: Rest of Europe Virtual Cards Industry Revenue (Million) Forecast, by Application 2020 & 2033
- Table 22: Virtual Cards Industry Revenue Million Forecast, by Product Type 2020 & 2033
- Table 23: Virtual Cards Industry Revenue Million Forecast, by End User 2020 & 2033
- Table 24: Virtual Cards Industry Revenue Million Forecast, by Country 2020 & 2033
- Table 25: India Virtual Cards Industry Revenue (Million) Forecast, by Application 2020 & 2033
- Table 26: Japan Virtual Cards Industry Revenue (Million) Forecast, by Application 2020 & 2033
- Table 27: Rest of Asia Pacific Virtual Cards Industry Revenue (Million) Forecast, by Application 2020 & 2033
- Table 28: Virtual Cards Industry Revenue Million Forecast, by Product Type 2020 & 2033
- Table 29: Virtual Cards Industry Revenue Million Forecast, by End User 2020 & 2033
- Table 30: Virtual Cards Industry Revenue Million Forecast, by Country 2020 & 2033
- Table 31: Virtual Cards Industry Revenue Million Forecast, by Product Type 2020 & 2033
- Table 32: Virtual Cards Industry Revenue Million Forecast, by End User 2020 & 2033
- Table 33: Virtual Cards Industry Revenue Million Forecast, by Country 2020 & 2033
- Table 34: United Arab Emirates Virtual Cards Industry Revenue (Million) Forecast, by Application 2020 & 2033
- Table 35: Rest of Middle East Virtual Cards Industry Revenue (Million) Forecast, by Application 2020 & 2033
Frequently Asked Questions
1. What is the projected Compound Annual Growth Rate (CAGR) of the Virtual Cards Industry?
The projected CAGR is approximately > 12.00%.
2. Which companies are prominent players in the Virtual Cards Industry?
Key companies in the market include Abine Inc, Fraedom Holdings Limited, MineralTree Inc, Billtrust Inc, ACI Worldwide Inc **List Not Exhaustive, American Express Company, Mastercard Incorporated, JPMorgan Chase & Co, Alipay com Co Ltd, Skrill USA Inc.
3. What are the main segments of the Virtual Cards Industry?
The market segments include Product Type, End User.
4. Can you provide details about the market size?
The market size is estimated to be USD 319.20 Million as of 2022.
5. What are some drivers contributing to market growth?
Digital Transformation is Driving the Market.
6. What are the notable trends driving market growth?
Increasing Online Transactions is Augmenting the Virtual Cards Market in Asia-Pacific.
7. Are there any restraints impacting market growth?
Connectivity and Technical Issues is Restraining the Market.
8. Can you provide examples of recent developments in the market?
December 2023: Conferma Pay and Mastercard expanded their partnership to enable mobile virtual card payments. Mastercard’s commercial bank clients were expected to be able to offer the convenience of contactless virtual card payments to their corporate customers using Conferma Pay.
9. What pricing options are available for accessing the report?
Pricing options include single-user, multi-user, and enterprise licenses priced at USD 3800, USD 4500, and USD 5800 respectively.
10. Is the market size provided in terms of value or volume?
The market size is provided in terms of value, measured in Million.
11. Are there any specific market keywords associated with the report?
Yes, the market keyword associated with the report is "Virtual Cards Industry," which aids in identifying and referencing the specific market segment covered.
12. How do I determine which pricing option suits my needs best?
The pricing options vary based on user requirements and access needs. Individual users may opt for single-user licenses, while businesses requiring broader access may choose multi-user or enterprise licenses for cost-effective access to the report.
13. Are there any additional resources or data provided in the Virtual Cards Industry report?
While the report offers comprehensive insights, it's advisable to review the specific contents or supplementary materials provided to ascertain if additional resources or data are available.
14. How can I stay updated on further developments or reports in the Virtual Cards Industry?
To stay informed about further developments, trends, and reports in the Virtual Cards Industry, consider subscribing to industry newsletters, following relevant companies and organizations, or regularly checking reputable industry news sources and publications.
Methodology
Step 1 - Identification of Relevant Samples Size from Population Database


Step 2 - Approaches for Defining Global Market Size (Value, Volume* & Price*)

Note*: In applicable scenarios
Step 3 - Data Sources
Primary Research
- Web Analytics
- Survey Reports
- Research Institute
- Latest Research Reports
- Opinion Leaders
Secondary Research
- Annual Reports
- White Paper
- Latest Press Release
- Industry Association
- Paid Database
- Investor Presentations

Step 4 - Data Triangulation
Involves using different sources of information in order to increase the validity of a study
These sources are likely to be stakeholders in a program - participants, other researchers, program staff, other community members, and so on.
Then we put all data in single framework & apply various statistical tools to find out the dynamic on the market.
During the analysis stage, feedback from the stakeholder groups would be compared to determine areas of agreement as well as areas of divergence