

Key Insights
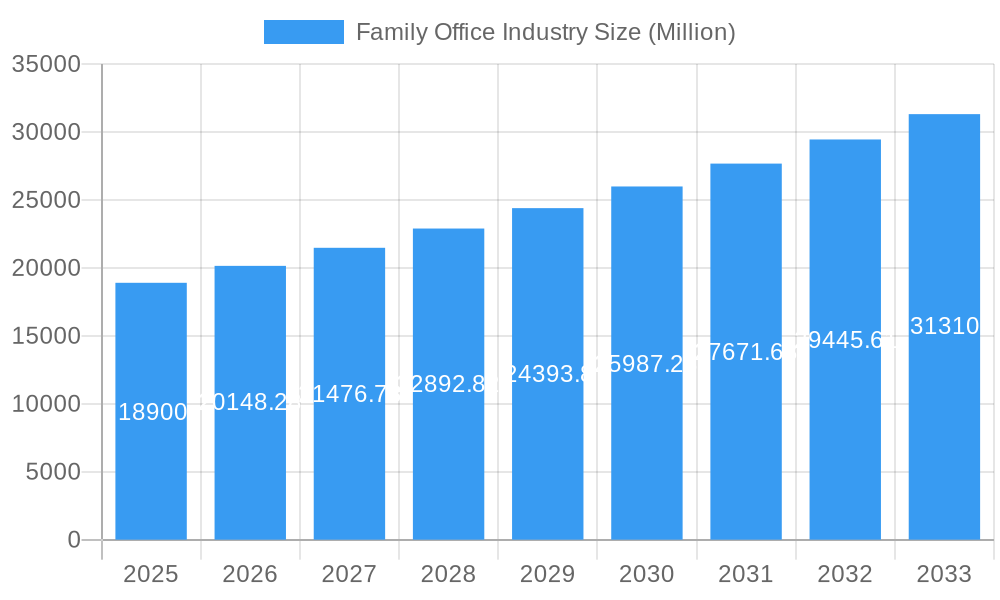
The global family office industry, currently valued at $18.90 billion in 2025, is experiencing robust growth, projected to expand at a Compound Annual Growth Rate (CAGR) of 6.52% from 2025 to 2033. This expansion is driven by several key factors. The increasing concentration of wealth among high-net-worth individuals (HNWIs) and ultra-high-net-worth individuals (UHNWIs) fuels demand for sophisticated wealth management and investment solutions offered by family offices. Furthermore, a growing preference for personalized, bespoke services tailored to specific family needs, beyond the capabilities of traditional wealth management firms, contributes significantly to industry growth. Technological advancements, including the use of AI and advanced analytics in portfolio management and risk assessment, are enhancing efficiency and optimizing investment strategies, further driving market expansion. Finally, the rising complexity of global financial markets and the need for proactive tax and estate planning further solidify the demand for experienced family office services.
Family Office Industry Market Size (In Billion)
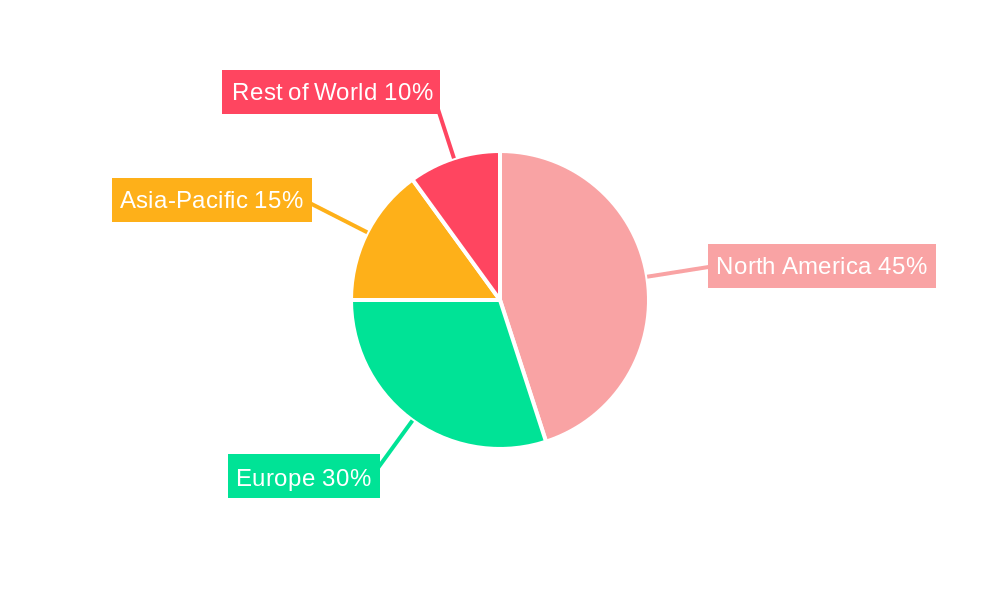
The industry is segmented based on service offerings (investment management, tax and legal services, philanthropic advisory, etc.), client asset size, and geographic location. While specific regional data is unavailable, a reasonable estimation considering global market trends suggests that North America and Europe currently hold the largest market share, driven by high concentrations of wealth. Key players in the industry include established firms like Cascade Investment LLC, Bezos Expeditions, and Goldman Sachs Family Office, alongside numerous boutique firms catering to specific niche markets. Despite the growth, the industry faces challenges such as increasing regulatory scrutiny, heightened competition from other wealth management firms, and the need to attract and retain top talent in a competitive market. The forecast period of 2025-2033 anticipates continued growth, albeit at a potentially moderated pace as the market matures and competition intensifies. Successfully navigating these challenges will be crucial for family offices to maintain their market position and deliver consistent value to their clients.
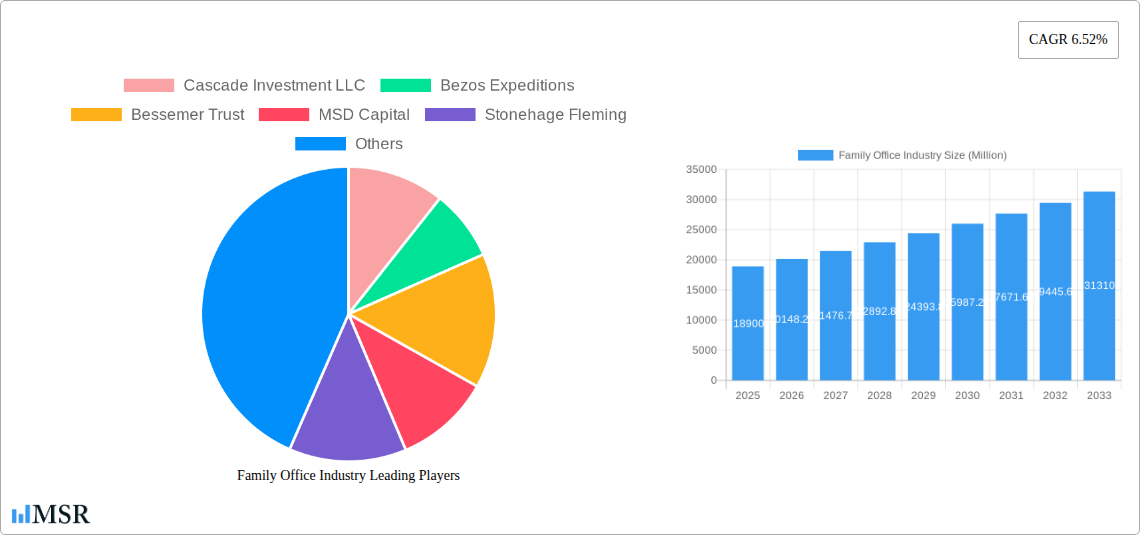
Family Office Industry Company Market Share
Family Office Industry: A Comprehensive Market Report (2019-2033)
This in-depth report provides a comprehensive analysis of the Family Office Industry, offering crucial insights for investors, industry stakeholders, and strategic decision-makers. With a focus on market dynamics, key players, and future trends, this report covers the period 2019-2033, utilizing data from 2019-2024 as a historical baseline, 2025 as the base and estimated year, and forecasting the market from 2025-2033. The global Family Office industry is projected to reach xx Million by 2033, exhibiting a Compound Annual Growth Rate (CAGR) of xx%.
Family Office Industry Market Concentration & Dynamics
The Family Office industry exhibits a high degree of concentration, with a few large players dominating the market. Market share analysis reveals that top firms, including Cascade Investment LLC, Bezos Expeditions, Bessemer Trust, MSD Capital, Stonehage Fleming, Glenmede, Emerson Collective, U S Trust - Bank of America Private Wealth Management, Bespoke Wealth Management, JPMorgan Chase Wealth Management, Goldman Sachs Family Office, and Silvercrest Asset Management, collectively hold an estimated xx% market share in 2025. This concentration is influenced by several factors:
- Innovation Ecosystems: A robust ecosystem of fintech solutions and specialized advisory services fuels innovation, yet access is often limited to the largest firms.
- Regulatory Frameworks: Stringent regulations surrounding wealth management and investment strategies create barriers to entry for smaller players.
- Substitute Products: Limited substitute products exist, reinforcing the dominance of established players.
- End-User Trends: Increasing demand for sophisticated wealth management solutions from High-Net-Worth Individuals (HNWIs) and Ultra-High-Net-Worth Individuals (UHNWIs) drives market growth.
- M&A Activities: The industry has seen significant M&A activity in recent years, with xx deals recorded between 2019 and 2024, indicating consolidation and expansion strategies by larger firms. Notable examples include Cascade Partners' acquisition of BlueWater Partners and the business combination of BDT & Company Holdings and MSD Partners.
Family Office Industry Insights & Trends
The Family Office industry demonstrates substantial growth potential driven by several factors:
The global family office market size reached xx Million in 2024 and is projected to reach xx Million by 2033. This robust growth is primarily fueled by:
- Increasing Global Wealth: The continued growth of global wealth, particularly among HNWIs and UHNWIs, fuels demand for sophisticated wealth management and investment solutions.
- Technological Disruptions: Fintech advancements, such as AI-driven portfolio management and blockchain technology for enhanced security, are transforming the industry landscape.
- Evolving Consumer Behaviors: Sophisticated investors increasingly seek personalized, holistic wealth management solutions that extend beyond traditional investment strategies, encompassing philanthropy, impact investing, and legacy planning.
Key Markets & Segments Leading Family Office Industry
The North American region holds the dominant position within the Family Office industry, accounting for approximately xx% of the global market in 2025. This dominance is attributed to several key drivers:
- Robust Economic Growth: Strong economic performance, particularly in the United States and Canada, fosters wealth accumulation.
- Well-Developed Financial Infrastructure: Mature financial markets and a sophisticated regulatory environment provide a conducive environment for Family Offices to operate.
- High Concentration of HNWIs and UHNWIs: A significant concentration of affluent individuals fuels demand for advanced wealth management services.
Other key regions, such as Europe and Asia-Pacific, are also experiencing notable growth, driven by rising affluence and increasing demand for specialized wealth management solutions.
Family Office Industry Product Developments
Recent product innovations include personalized investment strategies tailored to specific family goals, sophisticated risk management solutions leveraging AI and machine learning, and the integration of ESG (Environmental, Social, and Governance) factors into investment decision-making. These advancements provide competitive advantages for Family Offices, enhancing their ability to deliver superior performance and meet the evolving needs of their clientele.
Challenges in the Family Office Industry Market
The Family Office industry faces a multifaceted landscape of challenges that require strategic navigation:
- Evolving Regulatory Compliance: The intricate and perpetually shifting regulatory frameworks across various jurisdictions demand significant resources for interpretation, implementation, and ongoing adherence. Failure to comply can lead to substantial financial penalties, reputational damage, and operational disruptions. Firms must invest in robust compliance programs and stay ahead of regulatory changes.
- Sophisticated Cybersecurity Threats: Safeguarding highly sensitive client financial and personal data from increasingly advanced cyber threats is a critical imperative. This necessitates continuous investment in cutting-edge security infrastructure, proactive threat detection systems, ongoing employee training, and specialized cybersecurity expertise to mitigate the risk of breaches and maintain client trust.
- Intensifying Market Competition: The Family Office sector is characterized by fierce competition from a diverse range of players, including traditional wealth managers, boutique firms, and other specialized service providers. To attract and retain affluent clients, Family Offices must continuously innovate their service offerings, demonstrate unique value propositions, and cultivate deep, personalized relationships that foster loyalty.
- Talent Acquisition and Retention: Securing and retaining highly skilled professionals with expertise in areas such as investment management, tax, legal, and philanthropic advisory is a growing concern. The demand for experienced talent often outstrips supply, leading to increased recruitment costs and the need for competitive compensation and attractive work environments.
- Intergenerational Wealth Transfer: Effectively advising on and managing the complexities of wealth transfer across generations presents unique challenges. This includes addressing varying financial literacy levels, differing philanthropic goals, and the emotional aspects of succession planning, requiring a nuanced and adaptable approach to client advisory.
Forces Driving Family Office Industry Growth
Several potent forces are propelling the expansion and evolution of the Family Office industry:
- Accelerated Technological Advancements: The rapid integration of fintech innovations is fundamentally reshaping wealth management. These advancements are driving operational efficiencies through automation, providing sophisticated data analytics for enhanced decision-making, and delivering more personalized and seamless client experiences, thereby expanding the potential reach and effectiveness of Family Offices.
- Sustained Global Economic Expansion: Continued robust economic growth worldwide, particularly in dynamic emerging markets, is consistently expanding the universe of High-Net-Worth Individuals (HNWIs) and Ultra-High-Net-Worth Individuals (UHNWIs). This growing demographic fuels a greater demand for the comprehensive and bespoke services that Family Offices are uniquely positioned to provide.
- Strategic Regulatory Opportunities: While regulatory complexities pose challenges, they also simultaneously create significant opportunities. Evolving regulatory landscapes can necessitate specialized compliance solutions, offering innovative firms a chance to develop niche expertise and provide essential advisory services to clients seeking to navigate these intricate environments.
- Increasing Demand for Holistic Wealth Management: Affluent families are increasingly seeking more than just investment management. They desire a holistic approach that encompasses comprehensive financial planning, tax optimization, estate planning, philanthropic guidance, and lifestyle management, areas where Family Offices excel.
- Globalization of Wealth: As wealth becomes increasingly globalized, families with international assets and interests require sophisticated advice and management across different jurisdictions. This trend presents substantial opportunities for Family Offices with international capabilities and networks.
Long-Term Growth Catalysts in the Family Office Industry
Long-term growth will be fueled by strategic partnerships, technological innovations, and expansion into new markets. The adoption of AI-powered investment tools, the development of sustainable and impact investing strategies, and expansion into underserved markets will all contribute to sustained growth.
Emerging Opportunities in Family Office Industry
The Family Office industry is actively exploring and capitalizing on several promising emerging opportunities:
- Impact and Sustainable Investing: There is a significant and growing demand from families who wish to align their investments with their personal values and contribute positively to social and environmental causes. This presents a substantial opportunity for Family Offices to develop expertise in ESG (Environmental, Social, and Governance) and impact investing strategies.
- Diversification into Alternative Investments: Family Offices are increasingly seeking to diversify their portfolios beyond traditional asset classes. This includes a growing appetite for alternative investments such as private equity, venture capital, hedge funds, digital assets, and direct real estate investments, offering potentially higher returns and uncorrelated diversification.
- Strategic Global Market Expansion: Venturing into new geographic markets that exhibit high growth potential for wealth creation and a rising concentration of HNWIs and UHNWIs offers substantial revenue opportunities and market diversification for Family Offices willing to adapt their offerings to local needs and regulations.
- Digital Transformation and Data Analytics: Leveraging advanced digital tools and data analytics can unlock new avenues for client engagement, operational efficiency, and personalized service delivery. This includes utilizing AI for investment insights, blockchain for secure transactions, and sophisticated CRM systems for enhanced client relationship management.
- Philanthropic Advisory and Legacy Planning: As generational wealth grows, so does the focus on meaningful philanthropy and establishing lasting legacies. Family Offices are increasingly offering specialized advisory services in charitable giving, foundation management, and succession planning for philanthropic endeavors.
Leading Players in the Family Office Industry Sector
- Cascade Investment LLC
- Bezos Expeditions
- Bessemer Trust
- MSD Capital
- Stonehage Fleming
- Glenmede
- Emerson Collective
- U S Trust - Bank of America Private Wealth Management
- Bespoke Wealth Management
- JPMorgan Chase Wealth Management
- Goldman Sachs Family Office
- Silvercrest Asset Management (List Not Exhaustive)
Key Milestones in Family Office Industry Industry
- October 2022: BDT & Company Holdings and MSD Partners signed a business combination agreement to establish a new advisory and investment firm.
- March 2023: Cascade Partners acquired BlueWater Partners LLC, expanding its service offerings and capacity.
Strategic Outlook for Family Office Industry Market
The Family Office industry is poised for continued growth, driven by increasing global wealth, technological advancements, and evolving client needs. Strategic partnerships, a focus on innovation, and a commitment to regulatory compliance will be crucial for success in this dynamic market. The long-term outlook is optimistic, with significant opportunities for growth and expansion in both established and emerging markets.
Family Office Industry Segmentation
-
1. Product
- 1.1. Single Family Office
- 1.2. Multi Family Office
- 1.3. Virtual Family Office
-
2. Asset Class Of Investment
- 2.1. Bonds
- 2.2. Equities
- 2.3. Alternative Investments
- 2.4. Commodities
- 2.5. Cash Or Cash Equivalents
- 3. Geography
-
4. North America
- 4.1. United States
- 4.2. Canada
-
5. Europe
- 5.1. United Kingdom
- 5.2. Germany
- 5.3. France
- 5.4. Italy
- 5.5. Spain
- 5.6. Rest of Europe
-
6. Asia-Pacific
- 6.1. China
- 6.2. India
- 6.3. Japan
- 6.4. Australia
- 6.5. Rest of Asia-Pacific
-
7. Latin America
- 7.1. Brazil
- 7.2. Mexico
- 7.3. Argentina
- 7.4. Rest of South America
-
8. Middle-East and Africa
- 8.1. United Arab Emirates
- 8.2. Saudi Arabia
- 8.3. South Africa
- 8.4. Rest of Middle-East and Africa
Family Office Industry Segmentation By Geography
-
1. North America
- 1.1. United States
- 1.2. Canada
- 1.3. Mexico
-
2. South America
- 2.1. Brazil
- 2.2. Argentina
- 2.3. Rest of South America
-
3. Europe
- 3.1. United Kingdom
- 3.2. Germany
- 3.3. France
- 3.4. Italy
- 3.5. Spain
- 3.6. Russia
- 3.7. Benelux
- 3.8. Nordics
- 3.9. Rest of Europe
-
4. Middle East & Africa
- 4.1. Turkey
- 4.2. Israel
- 4.3. GCC
- 4.4. North Africa
- 4.5. South Africa
- 4.6. Rest of Middle East & Africa
-
5. Asia Pacific
- 5.1. China
- 5.2. India
- 5.3. Japan
- 5.4. South Korea
- 5.5. ASEAN
- 5.6. Oceania
- 5.7. Rest of Asia Pacific
Family Office Industry Regional Market Share
Geographic Coverage of Family Office Industry
Family Office Industry REPORT HIGHLIGHTS
| Aspects | Details |
|---|---|
| Study Period | 2020-2034 |
| Base Year | 2025 |
| Estimated Year | 2026 |
| Forecast Period | 2026-2034 |
| Historical Period | 2020-2025 |
| Growth Rate | CAGR of 6.52% from 2020-2034 |
| Segmentation |
|
Table of Contents
- 1. Introduction
- 1.1. Research Scope
- 1.2. Market Segmentation
- 1.3. Research Objective
- 1.4. Definitions and Assumptions
- 2. Executive Summary
- 2.1. Market Snapshot
- 3. Market Dynamics
- 3.1. Market Drivers
- 3.2. Market Restrains
- 3.3. Market Trends
- 3.4. Market Opportunities
- 4. Market Factor Analysis
- 4.1. Porters Five Forces
- 4.1.1. Bargaining Power of Suppliers
- 4.1.2. Bargaining Power of Buyers
- 4.1.3. Threat of New Entrants
- 4.1.4. Threat of Substitutes
- 4.1.5. Competitive Rivalry
- 4.2. PESTEL analysis
- 4.3. BCG Analysis
- 4.3.1. Stars (High Growth, High Market Share)
- 4.3.2. Cash Cows (Low Growth, High Market Share)
- 4.3.3. Question Mark (High Growth, Low Market Share)
- 4.3.4. Dogs (Low Growth, Low Market Share)
- 4.4. Ansoff Matrix Analysis
- 4.5. Supply Chain Analysis
- 4.6. Regulatory Landscape
- 4.7. Current Market Potential and Opportunity Assessment (TAM–SAM–SOM Framework)
- 4.8. MSR Analyst Note
- 4.1. Porters Five Forces
- 5. Market Analysis, Insights and Forecast 2021-2033
- 5.1. Market Analysis, Insights and Forecast - by Product
- 5.1.1. Single Family Office
- 5.1.2. Multi Family Office
- 5.1.3. Virtual Family Office
- 5.2. Market Analysis, Insights and Forecast - by Asset Class Of Investment
- 5.2.1. Bonds
- 5.2.2. Equities
- 5.2.3. Alternative Investments
- 5.2.4. Commodities
- 5.2.5. Cash Or Cash Equivalents
- 5.3. Market Analysis, Insights and Forecast - by Geography
- 5.4. Market Analysis, Insights and Forecast - by North America
- 5.4.1. United States
- 5.4.2. Canada
- 5.5. Market Analysis, Insights and Forecast - by Europe
- 5.5.1. United Kingdom
- 5.5.2. Germany
- 5.5.3. France
- 5.5.4. Italy
- 5.5.5. Spain
- 5.5.6. Rest of Europe
- 5.6. Market Analysis, Insights and Forecast - by Asia-Pacific
- 5.6.1. China
- 5.6.2. India
- 5.6.3. Japan
- 5.6.4. Australia
- 5.6.5. Rest of Asia-Pacific
- 5.7. Market Analysis, Insights and Forecast - by Latin America
- 5.7.1. Brazil
- 5.7.2. Mexico
- 5.7.3. Argentina
- 5.7.4. Rest of South America
- 5.8. Market Analysis, Insights and Forecast - by Middle-East and Africa
- 5.8.1. United Arab Emirates
- 5.8.2. Saudi Arabia
- 5.8.3. South Africa
- 5.8.4. Rest of Middle-East and Africa
- 5.9. Market Analysis, Insights and Forecast - by Region
- 5.9.1. North America
- 5.9.2. South America
- 5.9.3. Europe
- 5.9.4. Middle East & Africa
- 5.9.5. Asia Pacific
- 5.1. Market Analysis, Insights and Forecast - by Product
- 6. Global Family Office Industry Analysis, Insights and Forecast, 2021-2033
- 6.1. Market Analysis, Insights and Forecast - by Product
- 6.1.1. Single Family Office
- 6.1.2. Multi Family Office
- 6.1.3. Virtual Family Office
- 6.2. Market Analysis, Insights and Forecast - by Asset Class Of Investment
- 6.2.1. Bonds
- 6.2.2. Equities
- 6.2.3. Alternative Investments
- 6.2.4. Commodities
- 6.2.5. Cash Or Cash Equivalents
- 6.3. Market Analysis, Insights and Forecast - by Geography
- 6.4. Market Analysis, Insights and Forecast - by North America
- 6.4.1. United States
- 6.4.2. Canada
- 6.5. Market Analysis, Insights and Forecast - by Europe
- 6.5.1. United Kingdom
- 6.5.2. Germany
- 6.5.3. France
- 6.5.4. Italy
- 6.5.5. Spain
- 6.5.6. Rest of Europe
- 6.6. Market Analysis, Insights and Forecast - by Asia-Pacific
- 6.6.1. China
- 6.6.2. India
- 6.6.3. Japan
- 6.6.4. Australia
- 6.6.5. Rest of Asia-Pacific
- 6.7. Market Analysis, Insights and Forecast - by Latin America
- 6.7.1. Brazil
- 6.7.2. Mexico
- 6.7.3. Argentina
- 6.7.4. Rest of South America
- 6.8. Market Analysis, Insights and Forecast - by Middle-East and Africa
- 6.8.1. United Arab Emirates
- 6.8.2. Saudi Arabia
- 6.8.3. South Africa
- 6.8.4. Rest of Middle-East and Africa
- 6.1. Market Analysis, Insights and Forecast - by Product
- 7. North America Family Office Industry Analysis, Insights and Forecast, 2020-2032
- 7.1. Market Analysis, Insights and Forecast - by Product
- 7.1.1. Single Family Office
- 7.1.2. Multi Family Office
- 7.1.3. Virtual Family Office
- 7.2. Market Analysis, Insights and Forecast - by Asset Class Of Investment
- 7.2.1. Bonds
- 7.2.2. Equities
- 7.2.3. Alternative Investments
- 7.2.4. Commodities
- 7.2.5. Cash Or Cash Equivalents
- 7.3. Market Analysis, Insights and Forecast - by Geography
- 7.4. Market Analysis, Insights and Forecast - by North America
- 7.4.1. United States
- 7.4.2. Canada
- 7.5. Market Analysis, Insights and Forecast - by Europe
- 7.5.1. United Kingdom
- 7.5.2. Germany
- 7.5.3. France
- 7.5.4. Italy
- 7.5.5. Spain
- 7.5.6. Rest of Europe
- 7.6. Market Analysis, Insights and Forecast - by Asia-Pacific
- 7.6.1. China
- 7.6.2. India
- 7.6.3. Japan
- 7.6.4. Australia
- 7.6.5. Rest of Asia-Pacific
- 7.7. Market Analysis, Insights and Forecast - by Latin America
- 7.7.1. Brazil
- 7.7.2. Mexico
- 7.7.3. Argentina
- 7.7.4. Rest of South America
- 7.8. Market Analysis, Insights and Forecast - by Middle-East and Africa
- 7.8.1. United Arab Emirates
- 7.8.2. Saudi Arabia
- 7.8.3. South Africa
- 7.8.4. Rest of Middle-East and Africa
- 7.1. Market Analysis, Insights and Forecast - by Product
- 8. South America Family Office Industry Analysis, Insights and Forecast, 2020-2032
- 8.1. Market Analysis, Insights and Forecast - by Product
- 8.1.1. Single Family Office
- 8.1.2. Multi Family Office
- 8.1.3. Virtual Family Office
- 8.2. Market Analysis, Insights and Forecast - by Asset Class Of Investment
- 8.2.1. Bonds
- 8.2.2. Equities
- 8.2.3. Alternative Investments
- 8.2.4. Commodities
- 8.2.5. Cash Or Cash Equivalents
- 8.3. Market Analysis, Insights and Forecast - by Geography
- 8.4. Market Analysis, Insights and Forecast - by North America
- 8.4.1. United States
- 8.4.2. Canada
- 8.5. Market Analysis, Insights and Forecast - by Europe
- 8.5.1. United Kingdom
- 8.5.2. Germany
- 8.5.3. France
- 8.5.4. Italy
- 8.5.5. Spain
- 8.5.6. Rest of Europe
- 8.6. Market Analysis, Insights and Forecast - by Asia-Pacific
- 8.6.1. China
- 8.6.2. India
- 8.6.3. Japan
- 8.6.4. Australia
- 8.6.5. Rest of Asia-Pacific
- 8.7. Market Analysis, Insights and Forecast - by Latin America
- 8.7.1. Brazil
- 8.7.2. Mexico
- 8.7.3. Argentina
- 8.7.4. Rest of South America
- 8.8. Market Analysis, Insights and Forecast - by Middle-East and Africa
- 8.8.1. United Arab Emirates
- 8.8.2. Saudi Arabia
- 8.8.3. South Africa
- 8.8.4. Rest of Middle-East and Africa
- 8.1. Market Analysis, Insights and Forecast - by Product
- 9. Europe Family Office Industry Analysis, Insights and Forecast, 2020-2032
- 9.1. Market Analysis, Insights and Forecast - by Product
- 9.1.1. Single Family Office
- 9.1.2. Multi Family Office
- 9.1.3. Virtual Family Office
- 9.2. Market Analysis, Insights and Forecast - by Asset Class Of Investment
- 9.2.1. Bonds
- 9.2.2. Equities
- 9.2.3. Alternative Investments
- 9.2.4. Commodities
- 9.2.5. Cash Or Cash Equivalents
- 9.3. Market Analysis, Insights and Forecast - by Geography
- 9.4. Market Analysis, Insights and Forecast - by North America
- 9.4.1. United States
- 9.4.2. Canada
- 9.5. Market Analysis, Insights and Forecast - by Europe
- 9.5.1. United Kingdom
- 9.5.2. Germany
- 9.5.3. France
- 9.5.4. Italy
- 9.5.5. Spain
- 9.5.6. Rest of Europe
- 9.6. Market Analysis, Insights and Forecast - by Asia-Pacific
- 9.6.1. China
- 9.6.2. India
- 9.6.3. Japan
- 9.6.4. Australia
- 9.6.5. Rest of Asia-Pacific
- 9.7. Market Analysis, Insights and Forecast - by Latin America
- 9.7.1. Brazil
- 9.7.2. Mexico
- 9.7.3. Argentina
- 9.7.4. Rest of South America
- 9.8. Market Analysis, Insights and Forecast - by Middle-East and Africa
- 9.8.1. United Arab Emirates
- 9.8.2. Saudi Arabia
- 9.8.3. South Africa
- 9.8.4. Rest of Middle-East and Africa
- 9.1. Market Analysis, Insights and Forecast - by Product
- 10. Middle East & Africa Family Office Industry Analysis, Insights and Forecast, 2020-2032
- 10.1. Market Analysis, Insights and Forecast - by Product
- 10.1.1. Single Family Office
- 10.1.2. Multi Family Office
- 10.1.3. Virtual Family Office
- 10.2. Market Analysis, Insights and Forecast - by Asset Class Of Investment
- 10.2.1. Bonds
- 10.2.2. Equities
- 10.2.3. Alternative Investments
- 10.2.4. Commodities
- 10.2.5. Cash Or Cash Equivalents
- 10.3. Market Analysis, Insights and Forecast - by Geography
- 10.4. Market Analysis, Insights and Forecast - by North America
- 10.4.1. United States
- 10.4.2. Canada
- 10.5. Market Analysis, Insights and Forecast - by Europe
- 10.5.1. United Kingdom
- 10.5.2. Germany
- 10.5.3. France
- 10.5.4. Italy
- 10.5.5. Spain
- 10.5.6. Rest of Europe
- 10.6. Market Analysis, Insights and Forecast - by Asia-Pacific
- 10.6.1. China
- 10.6.2. India
- 10.6.3. Japan
- 10.6.4. Australia
- 10.6.5. Rest of Asia-Pacific
- 10.7. Market Analysis, Insights and Forecast - by Latin America
- 10.7.1. Brazil
- 10.7.2. Mexico
- 10.7.3. Argentina
- 10.7.4. Rest of South America
- 10.8. Market Analysis, Insights and Forecast - by Middle-East and Africa
- 10.8.1. United Arab Emirates
- 10.8.2. Saudi Arabia
- 10.8.3. South Africa
- 10.8.4. Rest of Middle-East and Africa
- 10.1. Market Analysis, Insights and Forecast - by Product
- 11. Asia Pacific Family Office Industry Analysis, Insights and Forecast, 2020-2032
- 11.1. Market Analysis, Insights and Forecast - by Product
- 11.1.1. Single Family Office
- 11.1.2. Multi Family Office
- 11.1.3. Virtual Family Office
- 11.2. Market Analysis, Insights and Forecast - by Asset Class Of Investment
- 11.2.1. Bonds
- 11.2.2. Equities
- 11.2.3. Alternative Investments
- 11.2.4. Commodities
- 11.2.5. Cash Or Cash Equivalents
- 11.3. Market Analysis, Insights and Forecast - by Geography
- 11.4. Market Analysis, Insights and Forecast - by North America
- 11.4.1. United States
- 11.4.2. Canada
- 11.5. Market Analysis, Insights and Forecast - by Europe
- 11.5.1. United Kingdom
- 11.5.2. Germany
- 11.5.3. France
- 11.5.4. Italy
- 11.5.5. Spain
- 11.5.6. Rest of Europe
- 11.6. Market Analysis, Insights and Forecast - by Asia-Pacific
- 11.6.1. China
- 11.6.2. India
- 11.6.3. Japan
- 11.6.4. Australia
- 11.6.5. Rest of Asia-Pacific
- 11.7. Market Analysis, Insights and Forecast - by Latin America
- 11.7.1. Brazil
- 11.7.2. Mexico
- 11.7.3. Argentina
- 11.7.4. Rest of South America
- 11.8. Market Analysis, Insights and Forecast - by Middle-East and Africa
- 11.8.1. United Arab Emirates
- 11.8.2. Saudi Arabia
- 11.8.3. South Africa
- 11.8.4. Rest of Middle-East and Africa
- 11.1. Market Analysis, Insights and Forecast - by Product
- 12. Competitive Analysis
- 12.1. Company Profiles
- 12.1.1 Cascade Investment LLC
- 12.1.1.1. Company Overview
- 12.1.1.2. Products
- 12.1.1.3. Company Financials
- 12.1.1.4. SWOT Analysis
- 12.1.2 Bezos Expeditions
- 12.1.2.1. Company Overview
- 12.1.2.2. Products
- 12.1.2.3. Company Financials
- 12.1.2.4. SWOT Analysis
- 12.1.3 Bessemer Trust
- 12.1.3.1. Company Overview
- 12.1.3.2. Products
- 12.1.3.3. Company Financials
- 12.1.3.4. SWOT Analysis
- 12.1.4 MSD Capital
- 12.1.4.1. Company Overview
- 12.1.4.2. Products
- 12.1.4.3. Company Financials
- 12.1.4.4. SWOT Analysis
- 12.1.5 Stonehage Fleming
- 12.1.5.1. Company Overview
- 12.1.5.2. Products
- 12.1.5.3. Company Financials
- 12.1.5.4. SWOT Analysis
- 12.1.6 Glenmede
- 12.1.6.1. Company Overview
- 12.1.6.2. Products
- 12.1.6.3. Company Financials
- 12.1.6.4. SWOT Analysis
- 12.1.7 Emerson Collective
- 12.1.7.1. Company Overview
- 12.1.7.2. Products
- 12.1.7.3. Company Financials
- 12.1.7.4. SWOT Analysis
- 12.1.8 U S Trust - Bank of America Private Wealth Management
- 12.1.8.1. Company Overview
- 12.1.8.2. Products
- 12.1.8.3. Company Financials
- 12.1.8.4. SWOT Analysis
- 12.1.9 Bespoke Wealth Management
- 12.1.9.1. Company Overview
- 12.1.9.2. Products
- 12.1.9.3. Company Financials
- 12.1.9.4. SWOT Analysis
- 12.1.10 JPMorgan Chase Wealth Management
- 12.1.10.1. Company Overview
- 12.1.10.2. Products
- 12.1.10.3. Company Financials
- 12.1.10.4. SWOT Analysis
- 12.1.11 Goldman Sachs Family Office
- 12.1.11.1. Company Overview
- 12.1.11.2. Products
- 12.1.11.3. Company Financials
- 12.1.11.4. SWOT Analysis
- 12.1.12 Silvercrest Asset Management**List Not Exhaustive
- 12.1.12.1. Company Overview
- 12.1.12.2. Products
- 12.1.12.3. Company Financials
- 12.1.12.4. SWOT Analysis
- 12.1.1 Cascade Investment LLC
- 12.2. Market Entropy
- 12.2.1 Company's Key Areas Served
- 12.2.2 Recent Developments
- 12.3. Company Market Share Analysis 2025
- 12.3.1 Top 5 Companies Market Share Analysis
- 12.3.2 Top 3 Companies Market Share Analysis
- 12.4. List of Potential Customers
- 13. Research Methodology
List of Figures
- Figure 1: Global Family Office Industry Revenue Breakdown (Million, %) by Region 2025 & 2033
- Figure 2: Global Family Office Industry Volume Breakdown (Billion, %) by Region 2025 & 2033
- Figure 3: North America Family Office Industry Revenue (Million), by Product 2025 & 2033
- Figure 4: North America Family Office Industry Volume (Billion), by Product 2025 & 2033
- Figure 5: North America Family Office Industry Revenue Share (%), by Product 2025 & 2033
- Figure 6: North America Family Office Industry Volume Share (%), by Product 2025 & 2033
- Figure 7: North America Family Office Industry Revenue (Million), by Asset Class Of Investment 2025 & 2033
- Figure 8: North America Family Office Industry Volume (Billion), by Asset Class Of Investment 2025 & 2033
- Figure 9: North America Family Office Industry Revenue Share (%), by Asset Class Of Investment 2025 & 2033
- Figure 10: North America Family Office Industry Volume Share (%), by Asset Class Of Investment 2025 & 2033
- Figure 11: North America Family Office Industry Revenue (Million), by Geography 2025 & 2033
- Figure 12: North America Family Office Industry Volume (Billion), by Geography 2025 & 2033
- Figure 13: North America Family Office Industry Revenue Share (%), by Geography 2025 & 2033
- Figure 14: North America Family Office Industry Volume Share (%), by Geography 2025 & 2033
- Figure 15: North America Family Office Industry Revenue (Million), by North America 2025 & 2033
- Figure 16: North America Family Office Industry Volume (Billion), by North America 2025 & 2033
- Figure 17: North America Family Office Industry Revenue Share (%), by North America 2025 & 2033
- Figure 18: North America Family Office Industry Volume Share (%), by North America 2025 & 2033
- Figure 19: North America Family Office Industry Revenue (Million), by Europe 2025 & 2033
- Figure 20: North America Family Office Industry Volume (Billion), by Europe 2025 & 2033
- Figure 21: North America Family Office Industry Revenue Share (%), by Europe 2025 & 2033
- Figure 22: North America Family Office Industry Volume Share (%), by Europe 2025 & 2033
- Figure 23: North America Family Office Industry Revenue (Million), by Asia-Pacific 2025 & 2033
- Figure 24: North America Family Office Industry Volume (Billion), by Asia-Pacific 2025 & 2033
- Figure 25: North America Family Office Industry Revenue Share (%), by Asia-Pacific 2025 & 2033
- Figure 26: North America Family Office Industry Volume Share (%), by Asia-Pacific 2025 & 2033
- Figure 27: North America Family Office Industry Revenue (Million), by Latin America 2025 & 2033
- Figure 28: North America Family Office Industry Volume (Billion), by Latin America 2025 & 2033
- Figure 29: North America Family Office Industry Revenue Share (%), by Latin America 2025 & 2033
- Figure 30: North America Family Office Industry Volume Share (%), by Latin America 2025 & 2033
- Figure 31: North America Family Office Industry Revenue (Million), by Middle-East and Africa 2025 & 2033
- Figure 32: North America Family Office Industry Volume (Billion), by Middle-East and Africa 2025 & 2033
- Figure 33: North America Family Office Industry Revenue Share (%), by Middle-East and Africa 2025 & 2033
- Figure 34: North America Family Office Industry Volume Share (%), by Middle-East and Africa 2025 & 2033
- Figure 35: North America Family Office Industry Revenue (Million), by Country 2025 & 2033
- Figure 36: North America Family Office Industry Volume (Billion), by Country 2025 & 2033
- Figure 37: North America Family Office Industry Revenue Share (%), by Country 2025 & 2033
- Figure 38: North America Family Office Industry Volume Share (%), by Country 2025 & 2033
- Figure 39: South America Family Office Industry Revenue (Million), by Product 2025 & 2033
- Figure 40: South America Family Office Industry Volume (Billion), by Product 2025 & 2033
- Figure 41: South America Family Office Industry Revenue Share (%), by Product 2025 & 2033
- Figure 42: South America Family Office Industry Volume Share (%), by Product 2025 & 2033
- Figure 43: South America Family Office Industry Revenue (Million), by Asset Class Of Investment 2025 & 2033
- Figure 44: South America Family Office Industry Volume (Billion), by Asset Class Of Investment 2025 & 2033
- Figure 45: South America Family Office Industry Revenue Share (%), by Asset Class Of Investment 2025 & 2033
- Figure 46: South America Family Office Industry Volume Share (%), by Asset Class Of Investment 2025 & 2033
- Figure 47: South America Family Office Industry Revenue (Million), by Geography 2025 & 2033
- Figure 48: South America Family Office Industry Volume (Billion), by Geography 2025 & 2033
- Figure 49: South America Family Office Industry Revenue Share (%), by Geography 2025 & 2033
- Figure 50: South America Family Office Industry Volume Share (%), by Geography 2025 & 2033
- Figure 51: South America Family Office Industry Revenue (Million), by North America 2025 & 2033
- Figure 52: South America Family Office Industry Volume (Billion), by North America 2025 & 2033
- Figure 53: South America Family Office Industry Revenue Share (%), by North America 2025 & 2033
- Figure 54: South America Family Office Industry Volume Share (%), by North America 2025 & 2033
- Figure 55: South America Family Office Industry Revenue (Million), by Europe 2025 & 2033
- Figure 56: South America Family Office Industry Volume (Billion), by Europe 2025 & 2033
- Figure 57: South America Family Office Industry Revenue Share (%), by Europe 2025 & 2033
- Figure 58: South America Family Office Industry Volume Share (%), by Europe 2025 & 2033
- Figure 59: South America Family Office Industry Revenue (Million), by Asia-Pacific 2025 & 2033
- Figure 60: South America Family Office Industry Volume (Billion), by Asia-Pacific 2025 & 2033
- Figure 61: South America Family Office Industry Revenue Share (%), by Asia-Pacific 2025 & 2033
- Figure 62: South America Family Office Industry Volume Share (%), by Asia-Pacific 2025 & 2033
- Figure 63: South America Family Office Industry Revenue (Million), by Latin America 2025 & 2033
- Figure 64: South America Family Office Industry Volume (Billion), by Latin America 2025 & 2033
- Figure 65: South America Family Office Industry Revenue Share (%), by Latin America 2025 & 2033
- Figure 66: South America Family Office Industry Volume Share (%), by Latin America 2025 & 2033
- Figure 67: South America Family Office Industry Revenue (Million), by Middle-East and Africa 2025 & 2033
- Figure 68: South America Family Office Industry Volume (Billion), by Middle-East and Africa 2025 & 2033
- Figure 69: South America Family Office Industry Revenue Share (%), by Middle-East and Africa 2025 & 2033
- Figure 70: South America Family Office Industry Volume Share (%), by Middle-East and Africa 2025 & 2033
- Figure 71: South America Family Office Industry Revenue (Million), by Country 2025 & 2033
- Figure 72: South America Family Office Industry Volume (Billion), by Country 2025 & 2033
- Figure 73: South America Family Office Industry Revenue Share (%), by Country 2025 & 2033
- Figure 74: South America Family Office Industry Volume Share (%), by Country 2025 & 2033
- Figure 75: Europe Family Office Industry Revenue (Million), by Product 2025 & 2033
- Figure 76: Europe Family Office Industry Volume (Billion), by Product 2025 & 2033
- Figure 77: Europe Family Office Industry Revenue Share (%), by Product 2025 & 2033
- Figure 78: Europe Family Office Industry Volume Share (%), by Product 2025 & 2033
- Figure 79: Europe Family Office Industry Revenue (Million), by Asset Class Of Investment 2025 & 2033
- Figure 80: Europe Family Office Industry Volume (Billion), by Asset Class Of Investment 2025 & 2033
- Figure 81: Europe Family Office Industry Revenue Share (%), by Asset Class Of Investment 2025 & 2033
- Figure 82: Europe Family Office Industry Volume Share (%), by Asset Class Of Investment 2025 & 2033
- Figure 83: Europe Family Office Industry Revenue (Million), by Geography 2025 & 2033
- Figure 84: Europe Family Office Industry Volume (Billion), by Geography 2025 & 2033
- Figure 85: Europe Family Office Industry Revenue Share (%), by Geography 2025 & 2033
- Figure 86: Europe Family Office Industry Volume Share (%), by Geography 2025 & 2033
- Figure 87: Europe Family Office Industry Revenue (Million), by North America 2025 & 2033
- Figure 88: Europe Family Office Industry Volume (Billion), by North America 2025 & 2033
- Figure 89: Europe Family Office Industry Revenue Share (%), by North America 2025 & 2033
- Figure 90: Europe Family Office Industry Volume Share (%), by North America 2025 & 2033
- Figure 91: Europe Family Office Industry Revenue (Million), by Europe 2025 & 2033
- Figure 92: Europe Family Office Industry Volume (Billion), by Europe 2025 & 2033
- Figure 93: Europe Family Office Industry Revenue Share (%), by Europe 2025 & 2033
- Figure 94: Europe Family Office Industry Volume Share (%), by Europe 2025 & 2033
- Figure 95: Europe Family Office Industry Revenue (Million), by Asia-Pacific 2025 & 2033
- Figure 96: Europe Family Office Industry Volume (Billion), by Asia-Pacific 2025 & 2033
- Figure 97: Europe Family Office Industry Revenue Share (%), by Asia-Pacific 2025 & 2033
- Figure 98: Europe Family Office Industry Volume Share (%), by Asia-Pacific 2025 & 2033
- Figure 99: Europe Family Office Industry Revenue (Million), by Latin America 2025 & 2033
- Figure 100: Europe Family Office Industry Volume (Billion), by Latin America 2025 & 2033
- Figure 101: Europe Family Office Industry Revenue Share (%), by Latin America 2025 & 2033
- Figure 102: Europe Family Office Industry Volume Share (%), by Latin America 2025 & 2033
- Figure 103: Europe Family Office Industry Revenue (Million), by Middle-East and Africa 2025 & 2033
- Figure 104: Europe Family Office Industry Volume (Billion), by Middle-East and Africa 2025 & 2033
- Figure 105: Europe Family Office Industry Revenue Share (%), by Middle-East and Africa 2025 & 2033
- Figure 106: Europe Family Office Industry Volume Share (%), by Middle-East and Africa 2025 & 2033
- Figure 107: Europe Family Office Industry Revenue (Million), by Country 2025 & 2033
- Figure 108: Europe Family Office Industry Volume (Billion), by Country 2025 & 2033
- Figure 109: Europe Family Office Industry Revenue Share (%), by Country 2025 & 2033
- Figure 110: Europe Family Office Industry Volume Share (%), by Country 2025 & 2033
- Figure 111: Middle East & Africa Family Office Industry Revenue (Million), by Product 2025 & 2033
- Figure 112: Middle East & Africa Family Office Industry Volume (Billion), by Product 2025 & 2033
- Figure 113: Middle East & Africa Family Office Industry Revenue Share (%), by Product 2025 & 2033
- Figure 114: Middle East & Africa Family Office Industry Volume Share (%), by Product 2025 & 2033
- Figure 115: Middle East & Africa Family Office Industry Revenue (Million), by Asset Class Of Investment 2025 & 2033
- Figure 116: Middle East & Africa Family Office Industry Volume (Billion), by Asset Class Of Investment 2025 & 2033
- Figure 117: Middle East & Africa Family Office Industry Revenue Share (%), by Asset Class Of Investment 2025 & 2033
- Figure 118: Middle East & Africa Family Office Industry Volume Share (%), by Asset Class Of Investment 2025 & 2033
- Figure 119: Middle East & Africa Family Office Industry Revenue (Million), by Geography 2025 & 2033
- Figure 120: Middle East & Africa Family Office Industry Volume (Billion), by Geography 2025 & 2033
- Figure 121: Middle East & Africa Family Office Industry Revenue Share (%), by Geography 2025 & 2033
- Figure 122: Middle East & Africa Family Office Industry Volume Share (%), by Geography 2025 & 2033
- Figure 123: Middle East & Africa Family Office Industry Revenue (Million), by North America 2025 & 2033
- Figure 124: Middle East & Africa Family Office Industry Volume (Billion), by North America 2025 & 2033
- Figure 125: Middle East & Africa Family Office Industry Revenue Share (%), by North America 2025 & 2033
- Figure 126: Middle East & Africa Family Office Industry Volume Share (%), by North America 2025 & 2033
- Figure 127: Middle East & Africa Family Office Industry Revenue (Million), by Europe 2025 & 2033
- Figure 128: Middle East & Africa Family Office Industry Volume (Billion), by Europe 2025 & 2033
- Figure 129: Middle East & Africa Family Office Industry Revenue Share (%), by Europe 2025 & 2033
- Figure 130: Middle East & Africa Family Office Industry Volume Share (%), by Europe 2025 & 2033
- Figure 131: Middle East & Africa Family Office Industry Revenue (Million), by Asia-Pacific 2025 & 2033
- Figure 132: Middle East & Africa Family Office Industry Volume (Billion), by Asia-Pacific 2025 & 2033
- Figure 133: Middle East & Africa Family Office Industry Revenue Share (%), by Asia-Pacific 2025 & 2033
- Figure 134: Middle East & Africa Family Office Industry Volume Share (%), by Asia-Pacific 2025 & 2033
- Figure 135: Middle East & Africa Family Office Industry Revenue (Million), by Latin America 2025 & 2033
- Figure 136: Middle East & Africa Family Office Industry Volume (Billion), by Latin America 2025 & 2033
- Figure 137: Middle East & Africa Family Office Industry Revenue Share (%), by Latin America 2025 & 2033
- Figure 138: Middle East & Africa Family Office Industry Volume Share (%), by Latin America 2025 & 2033
- Figure 139: Middle East & Africa Family Office Industry Revenue (Million), by Middle-East and Africa 2025 & 2033
- Figure 140: Middle East & Africa Family Office Industry Volume (Billion), by Middle-East and Africa 2025 & 2033
- Figure 141: Middle East & Africa Family Office Industry Revenue Share (%), by Middle-East and Africa 2025 & 2033
- Figure 142: Middle East & Africa Family Office Industry Volume Share (%), by Middle-East and Africa 2025 & 2033
- Figure 143: Middle East & Africa Family Office Industry Revenue (Million), by Country 2025 & 2033
- Figure 144: Middle East & Africa Family Office Industry Volume (Billion), by Country 2025 & 2033
- Figure 145: Middle East & Africa Family Office Industry Revenue Share (%), by Country 2025 & 2033
- Figure 146: Middle East & Africa Family Office Industry Volume Share (%), by Country 2025 & 2033
- Figure 147: Asia Pacific Family Office Industry Revenue (Million), by Product 2025 & 2033
- Figure 148: Asia Pacific Family Office Industry Volume (Billion), by Product 2025 & 2033
- Figure 149: Asia Pacific Family Office Industry Revenue Share (%), by Product 2025 & 2033
- Figure 150: Asia Pacific Family Office Industry Volume Share (%), by Product 2025 & 2033
- Figure 151: Asia Pacific Family Office Industry Revenue (Million), by Asset Class Of Investment 2025 & 2033
- Figure 152: Asia Pacific Family Office Industry Volume (Billion), by Asset Class Of Investment 2025 & 2033
- Figure 153: Asia Pacific Family Office Industry Revenue Share (%), by Asset Class Of Investment 2025 & 2033
- Figure 154: Asia Pacific Family Office Industry Volume Share (%), by Asset Class Of Investment 2025 & 2033
- Figure 155: Asia Pacific Family Office Industry Revenue (Million), by Geography 2025 & 2033
- Figure 156: Asia Pacific Family Office Industry Volume (Billion), by Geography 2025 & 2033
- Figure 157: Asia Pacific Family Office Industry Revenue Share (%), by Geography 2025 & 2033
- Figure 158: Asia Pacific Family Office Industry Volume Share (%), by Geography 2025 & 2033
- Figure 159: Asia Pacific Family Office Industry Revenue (Million), by North America 2025 & 2033
- Figure 160: Asia Pacific Family Office Industry Volume (Billion), by North America 2025 & 2033
- Figure 161: Asia Pacific Family Office Industry Revenue Share (%), by North America 2025 & 2033
- Figure 162: Asia Pacific Family Office Industry Volume Share (%), by North America 2025 & 2033
- Figure 163: Asia Pacific Family Office Industry Revenue (Million), by Europe 2025 & 2033
- Figure 164: Asia Pacific Family Office Industry Volume (Billion), by Europe 2025 & 2033
- Figure 165: Asia Pacific Family Office Industry Revenue Share (%), by Europe 2025 & 2033
- Figure 166: Asia Pacific Family Office Industry Volume Share (%), by Europe 2025 & 2033
- Figure 167: Asia Pacific Family Office Industry Revenue (Million), by Asia-Pacific 2025 & 2033
- Figure 168: Asia Pacific Family Office Industry Volume (Billion), by Asia-Pacific 2025 & 2033
- Figure 169: Asia Pacific Family Office Industry Revenue Share (%), by Asia-Pacific 2025 & 2033
- Figure 170: Asia Pacific Family Office Industry Volume Share (%), by Asia-Pacific 2025 & 2033
- Figure 171: Asia Pacific Family Office Industry Revenue (Million), by Latin America 2025 & 2033
- Figure 172: Asia Pacific Family Office Industry Volume (Billion), by Latin America 2025 & 2033
- Figure 173: Asia Pacific Family Office Industry Revenue Share (%), by Latin America 2025 & 2033
- Figure 174: Asia Pacific Family Office Industry Volume Share (%), by Latin America 2025 & 2033
- Figure 175: Asia Pacific Family Office Industry Revenue (Million), by Middle-East and Africa 2025 & 2033
- Figure 176: Asia Pacific Family Office Industry Volume (Billion), by Middle-East and Africa 2025 & 2033
- Figure 177: Asia Pacific Family Office Industry Revenue Share (%), by Middle-East and Africa 2025 & 2033
- Figure 178: Asia Pacific Family Office Industry Volume Share (%), by Middle-East and Africa 2025 & 2033
- Figure 179: Asia Pacific Family Office Industry Revenue (Million), by Country 2025 & 2033
- Figure 180: Asia Pacific Family Office Industry Volume (Billion), by Country 2025 & 2033
- Figure 181: Asia Pacific Family Office Industry Revenue Share (%), by Country 2025 & 2033
- Figure 182: Asia Pacific Family Office Industry Volume Share (%), by Country 2025 & 2033
List of Tables
- Table 1: Global Family Office Industry Revenue Million Forecast, by Product 2020 & 2033
- Table 2: Global Family Office Industry Volume Billion Forecast, by Product 2020 & 2033
- Table 3: Global Family Office Industry Revenue Million Forecast, by Asset Class Of Investment 2020 & 2033
- Table 4: Global Family Office Industry Volume Billion Forecast, by Asset Class Of Investment 2020 & 2033
- Table 5: Global Family Office Industry Revenue Million Forecast, by Geography 2020 & 2033
- Table 6: Global Family Office Industry Volume Billion Forecast, by Geography 2020 & 2033
- Table 7: Global Family Office Industry Revenue Million Forecast, by North America 2020 & 2033
- Table 8: Global Family Office Industry Volume Billion Forecast, by North America 2020 & 2033
- Table 9: Global Family Office Industry Revenue Million Forecast, by Europe 2020 & 2033
- Table 10: Global Family Office Industry Volume Billion Forecast, by Europe 2020 & 2033
- Table 11: Global Family Office Industry Revenue Million Forecast, by Asia-Pacific 2020 & 2033
- Table 12: Global Family Office Industry Volume Billion Forecast, by Asia-Pacific 2020 & 2033
- Table 13: Global Family Office Industry Revenue Million Forecast, by Latin America 2020 & 2033
- Table 14: Global Family Office Industry Volume Billion Forecast, by Latin America 2020 & 2033
- Table 15: Global Family Office Industry Revenue Million Forecast, by Middle-East and Africa 2020 & 2033
- Table 16: Global Family Office Industry Volume Billion Forecast, by Middle-East and Africa 2020 & 2033
- Table 17: Global Family Office Industry Revenue Million Forecast, by Region 2020 & 2033
- Table 18: Global Family Office Industry Volume Billion Forecast, by Region 2020 & 2033
- Table 19: Global Family Office Industry Revenue Million Forecast, by Product 2020 & 2033
- Table 20: Global Family Office Industry Volume Billion Forecast, by Product 2020 & 2033
- Table 21: Global Family Office Industry Revenue Million Forecast, by Asset Class Of Investment 2020 & 2033
- Table 22: Global Family Office Industry Volume Billion Forecast, by Asset Class Of Investment 2020 & 2033
- Table 23: Global Family Office Industry Revenue Million Forecast, by Geography 2020 & 2033
- Table 24: Global Family Office Industry Volume Billion Forecast, by Geography 2020 & 2033
- Table 25: Global Family Office Industry Revenue Million Forecast, by North America 2020 & 2033
- Table 26: Global Family Office Industry Volume Billion Forecast, by North America 2020 & 2033
- Table 27: Global Family Office Industry Revenue Million Forecast, by Europe 2020 & 2033
- Table 28: Global Family Office Industry Volume Billion Forecast, by Europe 2020 & 2033
- Table 29: Global Family Office Industry Revenue Million Forecast, by Asia-Pacific 2020 & 2033
- Table 30: Global Family Office Industry Volume Billion Forecast, by Asia-Pacific 2020 & 2033
- Table 31: Global Family Office Industry Revenue Million Forecast, by Latin America 2020 & 2033
- Table 32: Global Family Office Industry Volume Billion Forecast, by Latin America 2020 & 2033
- Table 33: Global Family Office Industry Revenue Million Forecast, by Middle-East and Africa 2020 & 2033
- Table 34: Global Family Office Industry Volume Billion Forecast, by Middle-East and Africa 2020 & 2033
- Table 35: Global Family Office Industry Revenue Million Forecast, by Country 2020 & 2033
- Table 36: Global Family Office Industry Volume Billion Forecast, by Country 2020 & 2033
- Table 37: United States Family Office Industry Revenue (Million) Forecast, by Application 2020 & 2033
- Table 38: United States Family Office Industry Volume (Billion) Forecast, by Application 2020 & 2033
- Table 39: Canada Family Office Industry Revenue (Million) Forecast, by Application 2020 & 2033
- Table 40: Canada Family Office Industry Volume (Billion) Forecast, by Application 2020 & 2033
- Table 41: Mexico Family Office Industry Revenue (Million) Forecast, by Application 2020 & 2033
- Table 42: Mexico Family Office Industry Volume (Billion) Forecast, by Application 2020 & 2033
- Table 43: Global Family Office Industry Revenue Million Forecast, by Product 2020 & 2033
- Table 44: Global Family Office Industry Volume Billion Forecast, by Product 2020 & 2033
- Table 45: Global Family Office Industry Revenue Million Forecast, by Asset Class Of Investment 2020 & 2033
- Table 46: Global Family Office Industry Volume Billion Forecast, by Asset Class Of Investment 2020 & 2033
- Table 47: Global Family Office Industry Revenue Million Forecast, by Geography 2020 & 2033
- Table 48: Global Family Office Industry Volume Billion Forecast, by Geography 2020 & 2033
- Table 49: Global Family Office Industry Revenue Million Forecast, by North America 2020 & 2033
- Table 50: Global Family Office Industry Volume Billion Forecast, by North America 2020 & 2033
- Table 51: Global Family Office Industry Revenue Million Forecast, by Europe 2020 & 2033
- Table 52: Global Family Office Industry Volume Billion Forecast, by Europe 2020 & 2033
- Table 53: Global Family Office Industry Revenue Million Forecast, by Asia-Pacific 2020 & 2033
- Table 54: Global Family Office Industry Volume Billion Forecast, by Asia-Pacific 2020 & 2033
- Table 55: Global Family Office Industry Revenue Million Forecast, by Latin America 2020 & 2033
- Table 56: Global Family Office Industry Volume Billion Forecast, by Latin America 2020 & 2033
- Table 57: Global Family Office Industry Revenue Million Forecast, by Middle-East and Africa 2020 & 2033
- Table 58: Global Family Office Industry Volume Billion Forecast, by Middle-East and Africa 2020 & 2033
- Table 59: Global Family Office Industry Revenue Million Forecast, by Country 2020 & 2033
- Table 60: Global Family Office Industry Volume Billion Forecast, by Country 2020 & 2033
- Table 61: Brazil Family Office Industry Revenue (Million) Forecast, by Application 2020 & 2033
- Table 62: Brazil Family Office Industry Volume (Billion) Forecast, by Application 2020 & 2033
- Table 63: Argentina Family Office Industry Revenue (Million) Forecast, by Application 2020 & 2033
- Table 64: Argentina Family Office Industry Volume (Billion) Forecast, by Application 2020 & 2033
- Table 65: Rest of South America Family Office Industry Revenue (Million) Forecast, by Application 2020 & 2033
- Table 66: Rest of South America Family Office Industry Volume (Billion) Forecast, by Application 2020 & 2033
- Table 67: Global Family Office Industry Revenue Million Forecast, by Product 2020 & 2033
- Table 68: Global Family Office Industry Volume Billion Forecast, by Product 2020 & 2033
- Table 69: Global Family Office Industry Revenue Million Forecast, by Asset Class Of Investment 2020 & 2033
- Table 70: Global Family Office Industry Volume Billion Forecast, by Asset Class Of Investment 2020 & 2033
- Table 71: Global Family Office Industry Revenue Million Forecast, by Geography 2020 & 2033
- Table 72: Global Family Office Industry Volume Billion Forecast, by Geography 2020 & 2033
- Table 73: Global Family Office Industry Revenue Million Forecast, by North America 2020 & 2033
- Table 74: Global Family Office Industry Volume Billion Forecast, by North America 2020 & 2033
- Table 75: Global Family Office Industry Revenue Million Forecast, by Europe 2020 & 2033
- Table 76: Global Family Office Industry Volume Billion Forecast, by Europe 2020 & 2033
- Table 77: Global Family Office Industry Revenue Million Forecast, by Asia-Pacific 2020 & 2033
- Table 78: Global Family Office Industry Volume Billion Forecast, by Asia-Pacific 2020 & 2033
- Table 79: Global Family Office Industry Revenue Million Forecast, by Latin America 2020 & 2033
- Table 80: Global Family Office Industry Volume Billion Forecast, by Latin America 2020 & 2033
- Table 81: Global Family Office Industry Revenue Million Forecast, by Middle-East and Africa 2020 & 2033
- Table 82: Global Family Office Industry Volume Billion Forecast, by Middle-East and Africa 2020 & 2033
- Table 83: Global Family Office Industry Revenue Million Forecast, by Country 2020 & 2033
- Table 84: Global Family Office Industry Volume Billion Forecast, by Country 2020 & 2033
- Table 85: United Kingdom Family Office Industry Revenue (Million) Forecast, by Application 2020 & 2033
- Table 86: United Kingdom Family Office Industry Volume (Billion) Forecast, by Application 2020 & 2033
- Table 87: Germany Family Office Industry Revenue (Million) Forecast, by Application 2020 & 2033
- Table 88: Germany Family Office Industry Volume (Billion) Forecast, by Application 2020 & 2033
- Table 89: France Family Office Industry Revenue (Million) Forecast, by Application 2020 & 2033
- Table 90: France Family Office Industry Volume (Billion) Forecast, by Application 2020 & 2033
- Table 91: Italy Family Office Industry Revenue (Million) Forecast, by Application 2020 & 2033
- Table 92: Italy Family Office Industry Volume (Billion) Forecast, by Application 2020 & 2033
- Table 93: Spain Family Office Industry Revenue (Million) Forecast, by Application 2020 & 2033
- Table 94: Spain Family Office Industry Volume (Billion) Forecast, by Application 2020 & 2033
- Table 95: Russia Family Office Industry Revenue (Million) Forecast, by Application 2020 & 2033
- Table 96: Russia Family Office Industry Volume (Billion) Forecast, by Application 2020 & 2033
- Table 97: Benelux Family Office Industry Revenue (Million) Forecast, by Application 2020 & 2033
- Table 98: Benelux Family Office Industry Volume (Billion) Forecast, by Application 2020 & 2033
- Table 99: Nordics Family Office Industry Revenue (Million) Forecast, by Application 2020 & 2033
- Table 100: Nordics Family Office Industry Volume (Billion) Forecast, by Application 2020 & 2033
- Table 101: Rest of Europe Family Office Industry Revenue (Million) Forecast, by Application 2020 & 2033
- Table 102: Rest of Europe Family Office Industry Volume (Billion) Forecast, by Application 2020 & 2033
- Table 103: Global Family Office Industry Revenue Million Forecast, by Product 2020 & 2033
- Table 104: Global Family Office Industry Volume Billion Forecast, by Product 2020 & 2033
- Table 105: Global Family Office Industry Revenue Million Forecast, by Asset Class Of Investment 2020 & 2033
- Table 106: Global Family Office Industry Volume Billion Forecast, by Asset Class Of Investment 2020 & 2033
- Table 107: Global Family Office Industry Revenue Million Forecast, by Geography 2020 & 2033
- Table 108: Global Family Office Industry Volume Billion Forecast, by Geography 2020 & 2033
- Table 109: Global Family Office Industry Revenue Million Forecast, by North America 2020 & 2033
- Table 110: Global Family Office Industry Volume Billion Forecast, by North America 2020 & 2033
- Table 111: Global Family Office Industry Revenue Million Forecast, by Europe 2020 & 2033
- Table 112: Global Family Office Industry Volume Billion Forecast, by Europe 2020 & 2033
- Table 113: Global Family Office Industry Revenue Million Forecast, by Asia-Pacific 2020 & 2033
- Table 114: Global Family Office Industry Volume Billion Forecast, by Asia-Pacific 2020 & 2033
- Table 115: Global Family Office Industry Revenue Million Forecast, by Latin America 2020 & 2033
- Table 116: Global Family Office Industry Volume Billion Forecast, by Latin America 2020 & 2033
- Table 117: Global Family Office Industry Revenue Million Forecast, by Middle-East and Africa 2020 & 2033
- Table 118: Global Family Office Industry Volume Billion Forecast, by Middle-East and Africa 2020 & 2033
- Table 119: Global Family Office Industry Revenue Million Forecast, by Country 2020 & 2033
- Table 120: Global Family Office Industry Volume Billion Forecast, by Country 2020 & 2033
- Table 121: Turkey Family Office Industry Revenue (Million) Forecast, by Application 2020 & 2033
- Table 122: Turkey Family Office Industry Volume (Billion) Forecast, by Application 2020 & 2033
- Table 123: Israel Family Office Industry Revenue (Million) Forecast, by Application 2020 & 2033
- Table 124: Israel Family Office Industry Volume (Billion) Forecast, by Application 2020 & 2033
- Table 125: GCC Family Office Industry Revenue (Million) Forecast, by Application 2020 & 2033
- Table 126: GCC Family Office Industry Volume (Billion) Forecast, by Application 2020 & 2033
- Table 127: North Africa Family Office Industry Revenue (Million) Forecast, by Application 2020 & 2033
- Table 128: North Africa Family Office Industry Volume (Billion) Forecast, by Application 2020 & 2033
- Table 129: South Africa Family Office Industry Revenue (Million) Forecast, by Application 2020 & 2033
- Table 130: South Africa Family Office Industry Volume (Billion) Forecast, by Application 2020 & 2033
- Table 131: Rest of Middle East & Africa Family Office Industry Revenue (Million) Forecast, by Application 2020 & 2033
- Table 132: Rest of Middle East & Africa Family Office Industry Volume (Billion) Forecast, by Application 2020 & 2033
- Table 133: Global Family Office Industry Revenue Million Forecast, by Product 2020 & 2033
- Table 134: Global Family Office Industry Volume Billion Forecast, by Product 2020 & 2033
- Table 135: Global Family Office Industry Revenue Million Forecast, by Asset Class Of Investment 2020 & 2033
- Table 136: Global Family Office Industry Volume Billion Forecast, by Asset Class Of Investment 2020 & 2033
- Table 137: Global Family Office Industry Revenue Million Forecast, by Geography 2020 & 2033
- Table 138: Global Family Office Industry Volume Billion Forecast, by Geography 2020 & 2033
- Table 139: Global Family Office Industry Revenue Million Forecast, by North America 2020 & 2033
- Table 140: Global Family Office Industry Volume Billion Forecast, by North America 2020 & 2033
- Table 141: Global Family Office Industry Revenue Million Forecast, by Europe 2020 & 2033
- Table 142: Global Family Office Industry Volume Billion Forecast, by Europe 2020 & 2033
- Table 143: Global Family Office Industry Revenue Million Forecast, by Asia-Pacific 2020 & 2033
- Table 144: Global Family Office Industry Volume Billion Forecast, by Asia-Pacific 2020 & 2033
- Table 145: Global Family Office Industry Revenue Million Forecast, by Latin America 2020 & 2033
- Table 146: Global Family Office Industry Volume Billion Forecast, by Latin America 2020 & 2033
- Table 147: Global Family Office Industry Revenue Million Forecast, by Middle-East and Africa 2020 & 2033
- Table 148: Global Family Office Industry Volume Billion Forecast, by Middle-East and Africa 2020 & 2033
- Table 149: Global Family Office Industry Revenue Million Forecast, by Country 2020 & 2033
- Table 150: Global Family Office Industry Volume Billion Forecast, by Country 2020 & 2033
- Table 151: China Family Office Industry Revenue (Million) Forecast, by Application 2020 & 2033
- Table 152: China Family Office Industry Volume (Billion) Forecast, by Application 2020 & 2033
- Table 153: India Family Office Industry Revenue (Million) Forecast, by Application 2020 & 2033
- Table 154: India Family Office Industry Volume (Billion) Forecast, by Application 2020 & 2033
- Table 155: Japan Family Office Industry Revenue (Million) Forecast, by Application 2020 & 2033
- Table 156: Japan Family Office Industry Volume (Billion) Forecast, by Application 2020 & 2033
- Table 157: South Korea Family Office Industry Revenue (Million) Forecast, by Application 2020 & 2033
- Table 158: South Korea Family Office Industry Volume (Billion) Forecast, by Application 2020 & 2033
- Table 159: ASEAN Family Office Industry Revenue (Million) Forecast, by Application 2020 & 2033
- Table 160: ASEAN Family Office Industry Volume (Billion) Forecast, by Application 2020 & 2033
- Table 161: Oceania Family Office Industry Revenue (Million) Forecast, by Application 2020 & 2033
- Table 162: Oceania Family Office Industry Volume (Billion) Forecast, by Application 2020 & 2033
- Table 163: Rest of Asia Pacific Family Office Industry Revenue (Million) Forecast, by Application 2020 & 2033
- Table 164: Rest of Asia Pacific Family Office Industry Volume (Billion) Forecast, by Application 2020 & 2033
Frequently Asked Questions
1. What is the projected Compound Annual Growth Rate (CAGR) of the Family Office Industry?
The projected CAGR is approximately 6.52%.
2. Which companies are prominent players in the Family Office Industry?
Key companies in the market include Cascade Investment LLC, Bezos Expeditions, Bessemer Trust, MSD Capital, Stonehage Fleming, Glenmede, Emerson Collective, U S Trust - Bank of America Private Wealth Management, Bespoke Wealth Management, JPMorgan Chase Wealth Management, Goldman Sachs Family Office, Silvercrest Asset Management**List Not Exhaustive.
3. What are the main segments of the Family Office Industry?
The market segments include Product, Asset Class Of Investment, Geography, North America, Europe, Asia-Pacific, Latin America, Middle-East and Africa.
4. Can you provide details about the market size?
The market size is estimated to be USD 18.90 Million as of 2022.
5. What are some drivers contributing to market growth?
Demand for Customzied Solution; Growth In The Number of High Networth Individuals Across Regions.
6. What are the notable trends driving market growth?
Single-Family Offices Represent the Largest Segment of the Market.
7. Are there any restraints impacting market growth?
Demand for Customzied Solution; Growth In The Number of High Networth Individuals Across Regions.
8. Can you provide examples of recent developments in the market?
March 2023 - Cascade Partners acquired BlueWater Partners LLC, based in Grand Rapids, MI. This partnership brought together two firms dedicated to client service, increasing their capacity and offering a wide range of consulting services, including restructuring and performance improvements.
9. What pricing options are available for accessing the report?
Pricing options include single-user, multi-user, and enterprise licenses priced at USD 4750, USD 5250, and USD 8750 respectively.
10. Is the market size provided in terms of value or volume?
The market size is provided in terms of value, measured in Million and volume, measured in Billion.
11. Are there any specific market keywords associated with the report?
Yes, the market keyword associated with the report is "Family Office Industry," which aids in identifying and referencing the specific market segment covered.
12. How do I determine which pricing option suits my needs best?
The pricing options vary based on user requirements and access needs. Individual users may opt for single-user licenses, while businesses requiring broader access may choose multi-user or enterprise licenses for cost-effective access to the report.
13. Are there any additional resources or data provided in the Family Office Industry report?
While the report offers comprehensive insights, it's advisable to review the specific contents or supplementary materials provided to ascertain if additional resources or data are available.
14. How can I stay updated on further developments or reports in the Family Office Industry?
To stay informed about further developments, trends, and reports in the Family Office Industry, consider subscribing to industry newsletters, following relevant companies and organizations, or regularly checking reputable industry news sources and publications.
Methodology
Step 1 - Identification of Relevant Samples Size from Population Database


Step 2 - Approaches for Defining Global Market Size (Value, Volume* & Price*)

Note*: In applicable scenarios
Step 3 - Data Sources
Primary Research
- Web Analytics
- Survey Reports
- Research Institute
- Latest Research Reports
- Opinion Leaders
Secondary Research
- Annual Reports
- White Paper
- Latest Press Release
- Industry Association
- Paid Database
- Investor Presentations

Step 4 - Data Triangulation
Involves using different sources of information in order to increase the validity of a study
These sources are likely to be stakeholders in a program - participants, other researchers, program staff, other community members, and so on.
Then we put all data in single framework & apply various statistical tools to find out the dynamic on the market.
During the analysis stage, feedback from the stakeholder groups would be compared to determine areas of agreement as well as areas of divergence