

Key Insights
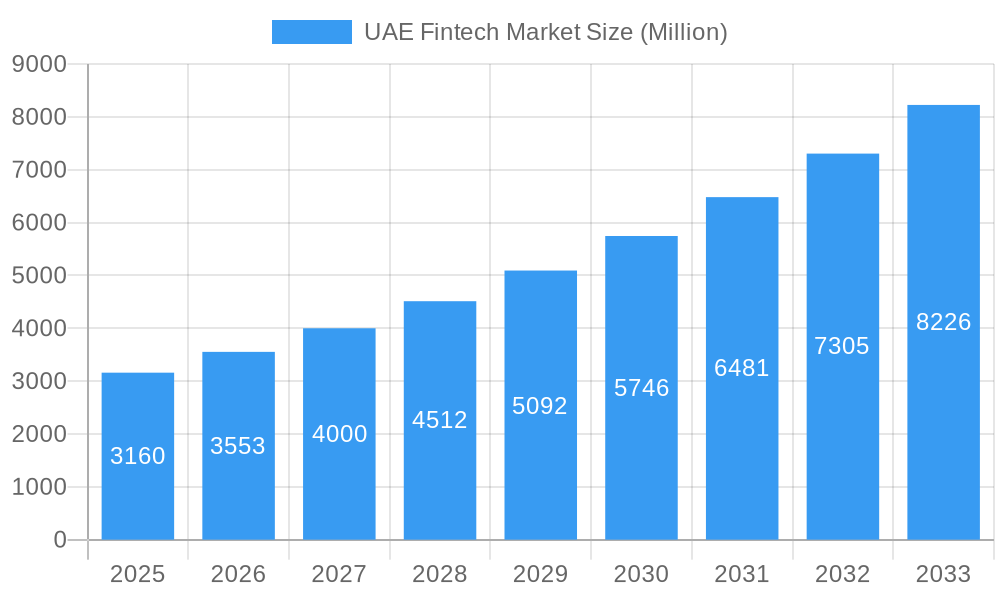
The UAE Fintech market, valued at $3.16 billion in 2025, is experiencing robust growth, projected to expand at a Compound Annual Growth Rate (CAGR) of 12.56% from 2025 to 2033. This surge is driven by several key factors. The UAE's proactive regulatory environment, fostering innovation and attracting significant foreign investment, plays a crucial role. Furthermore, the high mobile penetration rate and a digitally savvy population create a fertile ground for the adoption of fintech solutions. Increased government initiatives promoting digital transformation and a burgeoning e-commerce sector are also contributing significantly to market expansion. Key segments within the market likely include payments, lending, and investment management, each fueled by the increasing demand for convenient, efficient, and accessible financial services. The competitive landscape is dynamic, with both established players like Tabby and Yalla Compare, and emerging fintech startups like Beehive Fintech and Now Money vying for market share. The market's growth is further fueled by the government's vision for a cashless society and initiatives promoting financial inclusion.
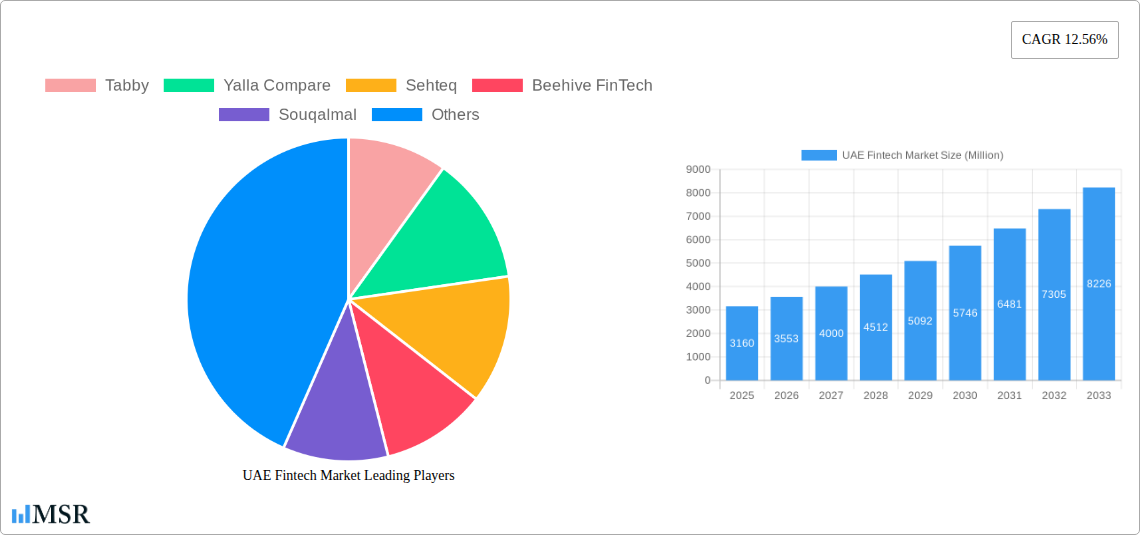
UAE Fintech Market Market Size (In Billion)
Looking ahead, the UAE Fintech market is poised for continued expansion. The increasing adoption of Open Banking APIs will unlock new opportunities for innovation and collaboration. The growing interest in blockchain technology and its potential applications in financial services will further shape the market landscape. While challenges like cybersecurity concerns and data privacy regulations exist, the overall positive economic outlook and government support suggest a promising future for the UAE Fintech sector. The market's expansion will likely be geographically diverse, with major cities such as Dubai and Abu Dhabi acting as key hubs, although growth is anticipated across the country as financial inclusion initiatives gain traction. Continued investment in infrastructure, particularly in areas like digital identity and payment systems, will be crucial for sustaining this growth trajectory.
UAE Fintech Market Company Market Share
UAE Fintech Market Report: 2019-2033 – A Comprehensive Analysis
This in-depth report provides a comprehensive analysis of the UAE Fintech market, covering its evolution from 2019 to 2024, current market dynamics in 2025, and future projections until 2033. The report offers actionable insights for investors, businesses, and policymakers navigating this rapidly evolving landscape. We examine key segments, leading players like Tabby, Yalla Compare, and others, and uncover emerging opportunities within this dynamic sector. The report utilizes data from the historical period (2019-2024), the base year (2025), and forecasts for the period (2025-2033).
UAE Fintech Market Market Concentration & Dynamics
The UAE Fintech market demonstrates a dynamic interplay of concentration, innovation, and regulatory oversight. While a few major players command significant market share, a thriving ecosystem of startups and established financial institutions fosters competition and innovation. The market is characterized by a significant number of mergers and acquisitions (M&A) deals, reflecting consolidation and expansion strategies within the sector. Regulatory frameworks, while generally supportive of fintech innovation, continue to evolve, shaping the competitive landscape. Substitute products, such as traditional banking services, remain relevant, but the increasing adoption of fintech solutions signifies a shift in consumer preference. End-user trends point towards an increasing demand for convenience, security, and personalized financial services, driving the growth of mobile payment solutions, digital lending platforms, and investment platforms.
- Market Concentration: The top 5 players hold approximately xx% of the market share in 2025 (Estimated). Further research is needed to precisely ascertain market shares for individual companies within this competitive market.
- M&A Activity: The number of M&A deals in the UAE Fintech market between 2019 and 2024 was approximately xx. This number reflects significant consolidation in the industry.
- Innovation Ecosystem: A vibrant ecosystem of incubators, accelerators, and venture capital funding supports the development of new fintech solutions, further driving innovation.
UAE Fintech Market Industry Insights & Trends
The UAE Fintech market is experiencing a period of significant and sustained expansion, propelled by a confluence of dynamic factors. Projections indicate a substantial market size of [Insert Specific Market Size in Million USD Here] Million USD by 2025, with an anticipated Compound Annual Growth Rate (CAGR) of [Insert Specific CAGR Percentage Here]% throughout the forecast horizon (2025-2033). This impressive trajectory is underpinned by several key drivers: the pervasive adoption of smartphones and enhanced internet penetration, a youthful and inherently tech-savvy demographic, progressive government policies actively championing digital transformation and innovation, and continuous advancements in financial technologies that are fostering groundbreaking solutions in digital payments, streamlined lending processes, and sophisticated investment platforms. Concurrently, consumer behavior is undergoing a pronounced shift towards digital channels for all financial transactions, with a clear preference for the convenience, speed, and efficiency that these modern solutions offer.
Key Markets & Segments Leading UAE Fintech Market
While detailed regional breakdown requires further research, initial indicators suggest that the UAE's major urban centers are dominant markets within the country. This dominance is driven by high concentrations of population, advanced digital infrastructure, and a strong concentration of businesses engaging in Fintech activities.
- Drivers of Market Dominance:
- High smartphone penetration and internet usage.
- Supportive government policies and regulations.
- Strong economic growth and high disposable incomes.
- Well-developed digital infrastructure.
- Increasing adoption of digital financial services.
UAE Fintech Market Product Developments
Recent years have witnessed significant product innovation in the UAE Fintech sector, encompassing advancements in mobile payment solutions, digital lending platforms, and investment management tools. These innovations often leverage Artificial Intelligence (AI) and machine learning to enhance user experience, risk assessment, and fraud prevention. The competitive landscape is dynamic, with companies vying to offer enhanced security features, personalized services, and seamless user interfaces to attract and retain customers.
Challenges in the UAE Fintech Market Market
The UAE Fintech market, while experiencing rapid growth, faces certain challenges. Regulatory complexities and evolving compliance requirements can pose hurdles for businesses. Competition is intense, requiring companies to constantly innovate and differentiate their offerings. Furthermore, ensuring data security and protecting consumer privacy are paramount concerns that need continuous investment and attention.
Forces Driving UAE Fintech Market Growth
A multifaceted array of forces is actively contributing to the sustained and vigorous growth of the UAE Fintech market. Paramount among these are rapid technological advancements, particularly in the fields of artificial intelligence and mobile technology, which are continuously fueling innovation and enhancing operational efficiencies across the sector. The proactive and supportive stance of the government, manifested through conducive regulatory environments and targeted initiatives aimed at accelerating digital transformation, provides a fertile ground for market expansion. Moreover, the escalating adoption of digital financial services by consumers, driven by increasing digital literacy and a growing trust in online financial solutions, is creating a robust and consistent demand for innovative Fintech products and services.
Long-Term Growth Catalysts in the UAE Fintech Market
Long-term growth will be driven by strategic partnerships between Fintech companies and traditional financial institutions, fostering innovation and expanding reach. Further advancements in AI and blockchain technology will open new avenues for growth. Expansion into new market segments, including underserved populations and SMEs, will also contribute to long-term sustainability and growth.
Emerging Opportunities in UAE Fintech Market
Significant opportunities exist in areas such as open banking, embedded finance, and the development of innovative solutions for the growing SME sector. The use of AI and machine learning for personalized financial services and risk management presents a large space for growth and further innovation. Additionally, exploring fintech solutions for the growing tourism sector in the UAE offers significant potential.
Leading Players in the UAE Fintech Market Sector
- Tabby
- Yalla Compare
- Sehteq
- Beehive FinTech
- Souqalmal
- Sarwa
- Mamo Pay
- Channel VAS
- Zinna
- Now Money
- List Not Exhaustive
Key Milestones in UAE Fintech Market Industry
- January 2023: Tabby, a leading player in the Buy Now, Pay Later (BNPL) space, successfully closed its Series C funding round, securing an impressive USD 58 Million and achieving a valuation of USD 660 Million. This significant investment underscores investor confidence in the company's growth trajectory and its potential within the region.
- August 2023: Tabby further solidified its market presence with the launch of Tabby Shop, an innovative, comprehensive shopping application. This platform seamlessly integrates over 500,000 products from more than 10,000 brands, representing a substantial expansion of Tabby's market reach and a significant enhancement of its product and service offering to consumers.
Strategic Outlook for UAE Fintech Market Market
The UAE Fintech market is poised for continued robust growth, driven by technological innovation, supportive regulations, and evolving consumer preferences. Strategic partnerships, strategic investments in emerging technologies, and a focus on expanding into new market segments will be crucial for success in this dynamic and competitive environment. The market's long-term outlook is positive, with immense potential for growth and innovation.
UAE Fintech Market Segmentation
-
1. Service proposition
- 1.1. Money Transfer and Payments
- 1.2. Savings and Investments
- 1.3. Digital Lending & Lending Marketplaces
- 1.4. Online Insurance & Insurance Marketplaces
UAE Fintech Market Segmentation By Geography
-
1. North America
- 1.1. United States
- 1.2. Canada
- 1.3. Mexico
-
2. South America
- 2.1. Brazil
- 2.2. Argentina
- 2.3. Rest of South America
-
3. Europe
- 3.1. United Kingdom
- 3.2. Germany
- 3.3. France
- 3.4. Italy
- 3.5. Spain
- 3.6. Russia
- 3.7. Benelux
- 3.8. Nordics
- 3.9. Rest of Europe
-
4. Middle East & Africa
- 4.1. Turkey
- 4.2. Israel
- 4.3. GCC
- 4.4. North Africa
- 4.5. South Africa
- 4.6. Rest of Middle East & Africa
-
5. Asia Pacific
- 5.1. China
- 5.2. India
- 5.3. Japan
- 5.4. South Korea
- 5.5. ASEAN
- 5.6. Oceania
- 5.7. Rest of Asia Pacific
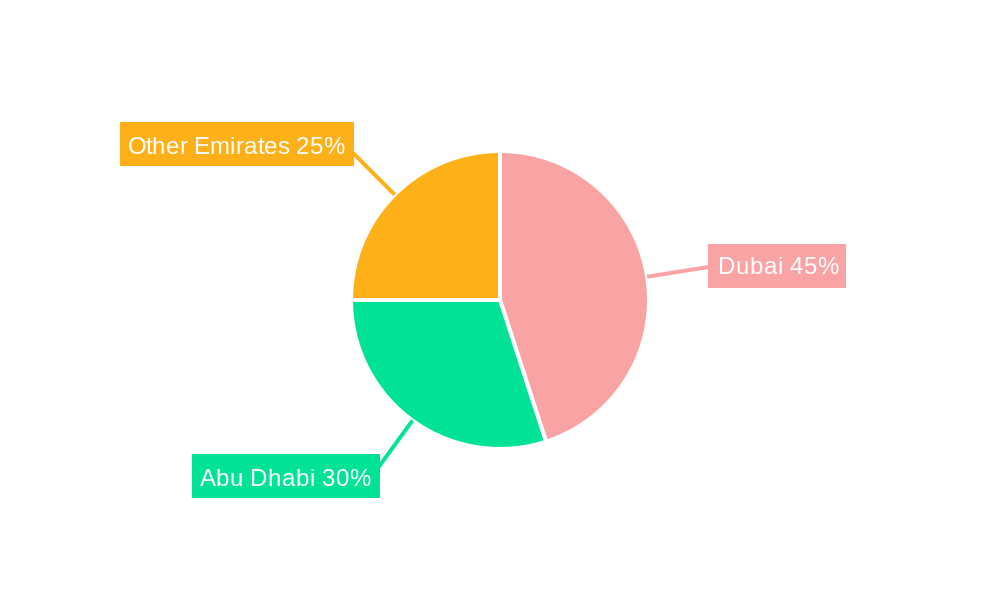
UAE Fintech Market Regional Market Share
Geographic Coverage of UAE Fintech Market
UAE Fintech Market REPORT HIGHLIGHTS
| Aspects | Details |
|---|---|
| Study Period | 2020-2034 |
| Base Year | 2025 |
| Estimated Year | 2026 |
| Forecast Period | 2026-2034 |
| Historical Period | 2020-2025 |
| Growth Rate | CAGR of 12.56% from 2020-2034 |
| Segmentation |
|
Table of Contents
- 1. Introduction
- 1.1. Research Scope
- 1.2. Market Segmentation
- 1.3. Research Objective
- 1.4. Definitions and Assumptions
- 2. Executive Summary
- 2.1. Market Snapshot
- 3. Market Dynamics
- 3.1. Market Drivers
- 3.2. Market Restrains
- 3.3. Market Trends
- 3.4. Market Opportunities
- 4. Market Factor Analysis
- 4.1. Porters Five Forces
- 4.1.1. Bargaining Power of Suppliers
- 4.1.2. Bargaining Power of Buyers
- 4.1.3. Threat of New Entrants
- 4.1.4. Threat of Substitutes
- 4.1.5. Competitive Rivalry
- 4.2. PESTEL analysis
- 4.3. BCG Analysis
- 4.3.1. Stars (High Growth, High Market Share)
- 4.3.2. Cash Cows (Low Growth, High Market Share)
- 4.3.3. Question Mark (High Growth, Low Market Share)
- 4.3.4. Dogs (Low Growth, Low Market Share)
- 4.4. Ansoff Matrix Analysis
- 4.5. Supply Chain Analysis
- 4.6. Regulatory Landscape
- 4.7. Current Market Potential and Opportunity Assessment (TAM–SAM–SOM Framework)
- 4.8. MSR Analyst Note
- 4.1. Porters Five Forces
- 5. Market Analysis, Insights and Forecast 2021-2033
- 5.1. Market Analysis, Insights and Forecast - by Service proposition
- 5.1.1. Money Transfer and Payments
- 5.1.2. Savings and Investments
- 5.1.3. Digital Lending & Lending Marketplaces
- 5.1.4. Online Insurance & Insurance Marketplaces
- 5.2. Market Analysis, Insights and Forecast - by Region
- 5.2.1. North America
- 5.2.2. South America
- 5.2.3. Europe
- 5.2.4. Middle East & Africa
- 5.2.5. Asia Pacific
- 5.1. Market Analysis, Insights and Forecast - by Service proposition
- 6. Global UAE Fintech Market Analysis, Insights and Forecast, 2021-2033
- 6.1. Market Analysis, Insights and Forecast - by Service proposition
- 6.1.1. Money Transfer and Payments
- 6.1.2. Savings and Investments
- 6.1.3. Digital Lending & Lending Marketplaces
- 6.1.4. Online Insurance & Insurance Marketplaces
- 6.1. Market Analysis, Insights and Forecast - by Service proposition
- 7. North America UAE Fintech Market Analysis, Insights and Forecast, 2020-2032
- 7.1. Market Analysis, Insights and Forecast - by Service proposition
- 7.1.1. Money Transfer and Payments
- 7.1.2. Savings and Investments
- 7.1.3. Digital Lending & Lending Marketplaces
- 7.1.4. Online Insurance & Insurance Marketplaces
- 7.1. Market Analysis, Insights and Forecast - by Service proposition
- 8. South America UAE Fintech Market Analysis, Insights and Forecast, 2020-2032
- 8.1. Market Analysis, Insights and Forecast - by Service proposition
- 8.1.1. Money Transfer and Payments
- 8.1.2. Savings and Investments
- 8.1.3. Digital Lending & Lending Marketplaces
- 8.1.4. Online Insurance & Insurance Marketplaces
- 8.1. Market Analysis, Insights and Forecast - by Service proposition
- 9. Europe UAE Fintech Market Analysis, Insights and Forecast, 2020-2032
- 9.1. Market Analysis, Insights and Forecast - by Service proposition
- 9.1.1. Money Transfer and Payments
- 9.1.2. Savings and Investments
- 9.1.3. Digital Lending & Lending Marketplaces
- 9.1.4. Online Insurance & Insurance Marketplaces
- 9.1. Market Analysis, Insights and Forecast - by Service proposition
- 10. Middle East & Africa UAE Fintech Market Analysis, Insights and Forecast, 2020-2032
- 10.1. Market Analysis, Insights and Forecast - by Service proposition
- 10.1.1. Money Transfer and Payments
- 10.1.2. Savings and Investments
- 10.1.3. Digital Lending & Lending Marketplaces
- 10.1.4. Online Insurance & Insurance Marketplaces
- 10.1. Market Analysis, Insights and Forecast - by Service proposition
- 11. Asia Pacific UAE Fintech Market Analysis, Insights and Forecast, 2020-2032
- 11.1. Market Analysis, Insights and Forecast - by Service proposition
- 11.1.1. Money Transfer and Payments
- 11.1.2. Savings and Investments
- 11.1.3. Digital Lending & Lending Marketplaces
- 11.1.4. Online Insurance & Insurance Marketplaces
- 11.1. Market Analysis, Insights and Forecast - by Service proposition
- 12. Competitive Analysis
- 12.1. Company Profiles
- 12.1.1 Tabby
- 12.1.1.1. Company Overview
- 12.1.1.2. Products
- 12.1.1.3. Company Financials
- 12.1.1.4. SWOT Analysis
- 12.1.2 Yalla Compare
- 12.1.2.1. Company Overview
- 12.1.2.2. Products
- 12.1.2.3. Company Financials
- 12.1.2.4. SWOT Analysis
- 12.1.3 Sehteq
- 12.1.3.1. Company Overview
- 12.1.3.2. Products
- 12.1.3.3. Company Financials
- 12.1.3.4. SWOT Analysis
- 12.1.4 Beehive FinTech
- 12.1.4.1. Company Overview
- 12.1.4.2. Products
- 12.1.4.3. Company Financials
- 12.1.4.4. SWOT Analysis
- 12.1.5 Souqalmal
- 12.1.5.1. Company Overview
- 12.1.5.2. Products
- 12.1.5.3. Company Financials
- 12.1.5.4. SWOT Analysis
- 12.1.6 Sarwa
- 12.1.6.1. Company Overview
- 12.1.6.2. Products
- 12.1.6.3. Company Financials
- 12.1.6.4. SWOT Analysis
- 12.1.7 Mamo Pay
- 12.1.7.1. Company Overview
- 12.1.7.2. Products
- 12.1.7.3. Company Financials
- 12.1.7.4. SWOT Analysis
- 12.1.8 Channel VAS
- 12.1.8.1. Company Overview
- 12.1.8.2. Products
- 12.1.8.3. Company Financials
- 12.1.8.4. SWOT Analysis
- 12.1.9 Zinna
- 12.1.9.1. Company Overview
- 12.1.9.2. Products
- 12.1.9.3. Company Financials
- 12.1.9.4. SWOT Analysis
- 12.1.10 Now Money**List Not Exhaustive
- 12.1.10.1. Company Overview
- 12.1.10.2. Products
- 12.1.10.3. Company Financials
- 12.1.10.4. SWOT Analysis
- 12.1.1 Tabby
- 12.2. Market Entropy
- 12.2.1 Company's Key Areas Served
- 12.2.2 Recent Developments
- 12.3. Company Market Share Analysis 2025
- 12.3.1 Top 5 Companies Market Share Analysis
- 12.3.2 Top 3 Companies Market Share Analysis
- 12.4. List of Potential Customers
- 13. Research Methodology
List of Figures
- Figure 1: Global UAE Fintech Market Revenue Breakdown (Million, %) by Region 2025 & 2033
- Figure 2: Global UAE Fintech Market Volume Breakdown (Billion, %) by Region 2025 & 2033
- Figure 3: North America UAE Fintech Market Revenue (Million), by Service proposition 2025 & 2033
- Figure 4: North America UAE Fintech Market Volume (Billion), by Service proposition 2025 & 2033
- Figure 5: North America UAE Fintech Market Revenue Share (%), by Service proposition 2025 & 2033
- Figure 6: North America UAE Fintech Market Volume Share (%), by Service proposition 2025 & 2033
- Figure 7: North America UAE Fintech Market Revenue (Million), by Country 2025 & 2033
- Figure 8: North America UAE Fintech Market Volume (Billion), by Country 2025 & 2033
- Figure 9: North America UAE Fintech Market Revenue Share (%), by Country 2025 & 2033
- Figure 10: North America UAE Fintech Market Volume Share (%), by Country 2025 & 2033
- Figure 11: South America UAE Fintech Market Revenue (Million), by Service proposition 2025 & 2033
- Figure 12: South America UAE Fintech Market Volume (Billion), by Service proposition 2025 & 2033
- Figure 13: South America UAE Fintech Market Revenue Share (%), by Service proposition 2025 & 2033
- Figure 14: South America UAE Fintech Market Volume Share (%), by Service proposition 2025 & 2033
- Figure 15: South America UAE Fintech Market Revenue (Million), by Country 2025 & 2033
- Figure 16: South America UAE Fintech Market Volume (Billion), by Country 2025 & 2033
- Figure 17: South America UAE Fintech Market Revenue Share (%), by Country 2025 & 2033
- Figure 18: South America UAE Fintech Market Volume Share (%), by Country 2025 & 2033
- Figure 19: Europe UAE Fintech Market Revenue (Million), by Service proposition 2025 & 2033
- Figure 20: Europe UAE Fintech Market Volume (Billion), by Service proposition 2025 & 2033
- Figure 21: Europe UAE Fintech Market Revenue Share (%), by Service proposition 2025 & 2033
- Figure 22: Europe UAE Fintech Market Volume Share (%), by Service proposition 2025 & 2033
- Figure 23: Europe UAE Fintech Market Revenue (Million), by Country 2025 & 2033
- Figure 24: Europe UAE Fintech Market Volume (Billion), by Country 2025 & 2033
- Figure 25: Europe UAE Fintech Market Revenue Share (%), by Country 2025 & 2033
- Figure 26: Europe UAE Fintech Market Volume Share (%), by Country 2025 & 2033
- Figure 27: Middle East & Africa UAE Fintech Market Revenue (Million), by Service proposition 2025 & 2033
- Figure 28: Middle East & Africa UAE Fintech Market Volume (Billion), by Service proposition 2025 & 2033
- Figure 29: Middle East & Africa UAE Fintech Market Revenue Share (%), by Service proposition 2025 & 2033
- Figure 30: Middle East & Africa UAE Fintech Market Volume Share (%), by Service proposition 2025 & 2033
- Figure 31: Middle East & Africa UAE Fintech Market Revenue (Million), by Country 2025 & 2033
- Figure 32: Middle East & Africa UAE Fintech Market Volume (Billion), by Country 2025 & 2033
- Figure 33: Middle East & Africa UAE Fintech Market Revenue Share (%), by Country 2025 & 2033
- Figure 34: Middle East & Africa UAE Fintech Market Volume Share (%), by Country 2025 & 2033
- Figure 35: Asia Pacific UAE Fintech Market Revenue (Million), by Service proposition 2025 & 2033
- Figure 36: Asia Pacific UAE Fintech Market Volume (Billion), by Service proposition 2025 & 2033
- Figure 37: Asia Pacific UAE Fintech Market Revenue Share (%), by Service proposition 2025 & 2033
- Figure 38: Asia Pacific UAE Fintech Market Volume Share (%), by Service proposition 2025 & 2033
- Figure 39: Asia Pacific UAE Fintech Market Revenue (Million), by Country 2025 & 2033
- Figure 40: Asia Pacific UAE Fintech Market Volume (Billion), by Country 2025 & 2033
- Figure 41: Asia Pacific UAE Fintech Market Revenue Share (%), by Country 2025 & 2033
- Figure 42: Asia Pacific UAE Fintech Market Volume Share (%), by Country 2025 & 2033
List of Tables
- Table 1: Global UAE Fintech Market Revenue Million Forecast, by Service proposition 2020 & 2033
- Table 2: Global UAE Fintech Market Volume Billion Forecast, by Service proposition 2020 & 2033
- Table 3: Global UAE Fintech Market Revenue Million Forecast, by Region 2020 & 2033
- Table 4: Global UAE Fintech Market Volume Billion Forecast, by Region 2020 & 2033
- Table 5: Global UAE Fintech Market Revenue Million Forecast, by Service proposition 2020 & 2033
- Table 6: Global UAE Fintech Market Volume Billion Forecast, by Service proposition 2020 & 2033
- Table 7: Global UAE Fintech Market Revenue Million Forecast, by Country 2020 & 2033
- Table 8: Global UAE Fintech Market Volume Billion Forecast, by Country 2020 & 2033
- Table 9: United States UAE Fintech Market Revenue (Million) Forecast, by Application 2020 & 2033
- Table 10: United States UAE Fintech Market Volume (Billion) Forecast, by Application 2020 & 2033
- Table 11: Canada UAE Fintech Market Revenue (Million) Forecast, by Application 2020 & 2033
- Table 12: Canada UAE Fintech Market Volume (Billion) Forecast, by Application 2020 & 2033
- Table 13: Mexico UAE Fintech Market Revenue (Million) Forecast, by Application 2020 & 2033
- Table 14: Mexico UAE Fintech Market Volume (Billion) Forecast, by Application 2020 & 2033
- Table 15: Global UAE Fintech Market Revenue Million Forecast, by Service proposition 2020 & 2033
- Table 16: Global UAE Fintech Market Volume Billion Forecast, by Service proposition 2020 & 2033
- Table 17: Global UAE Fintech Market Revenue Million Forecast, by Country 2020 & 2033
- Table 18: Global UAE Fintech Market Volume Billion Forecast, by Country 2020 & 2033
- Table 19: Brazil UAE Fintech Market Revenue (Million) Forecast, by Application 2020 & 2033
- Table 20: Brazil UAE Fintech Market Volume (Billion) Forecast, by Application 2020 & 2033
- Table 21: Argentina UAE Fintech Market Revenue (Million) Forecast, by Application 2020 & 2033
- Table 22: Argentina UAE Fintech Market Volume (Billion) Forecast, by Application 2020 & 2033
- Table 23: Rest of South America UAE Fintech Market Revenue (Million) Forecast, by Application 2020 & 2033
- Table 24: Rest of South America UAE Fintech Market Volume (Billion) Forecast, by Application 2020 & 2033
- Table 25: Global UAE Fintech Market Revenue Million Forecast, by Service proposition 2020 & 2033
- Table 26: Global UAE Fintech Market Volume Billion Forecast, by Service proposition 2020 & 2033
- Table 27: Global UAE Fintech Market Revenue Million Forecast, by Country 2020 & 2033
- Table 28: Global UAE Fintech Market Volume Billion Forecast, by Country 2020 & 2033
- Table 29: United Kingdom UAE Fintech Market Revenue (Million) Forecast, by Application 2020 & 2033
- Table 30: United Kingdom UAE Fintech Market Volume (Billion) Forecast, by Application 2020 & 2033
- Table 31: Germany UAE Fintech Market Revenue (Million) Forecast, by Application 2020 & 2033
- Table 32: Germany UAE Fintech Market Volume (Billion) Forecast, by Application 2020 & 2033
- Table 33: France UAE Fintech Market Revenue (Million) Forecast, by Application 2020 & 2033
- Table 34: France UAE Fintech Market Volume (Billion) Forecast, by Application 2020 & 2033
- Table 35: Italy UAE Fintech Market Revenue (Million) Forecast, by Application 2020 & 2033
- Table 36: Italy UAE Fintech Market Volume (Billion) Forecast, by Application 2020 & 2033
- Table 37: Spain UAE Fintech Market Revenue (Million) Forecast, by Application 2020 & 2033
- Table 38: Spain UAE Fintech Market Volume (Billion) Forecast, by Application 2020 & 2033
- Table 39: Russia UAE Fintech Market Revenue (Million) Forecast, by Application 2020 & 2033
- Table 40: Russia UAE Fintech Market Volume (Billion) Forecast, by Application 2020 & 2033
- Table 41: Benelux UAE Fintech Market Revenue (Million) Forecast, by Application 2020 & 2033
- Table 42: Benelux UAE Fintech Market Volume (Billion) Forecast, by Application 2020 & 2033
- Table 43: Nordics UAE Fintech Market Revenue (Million) Forecast, by Application 2020 & 2033
- Table 44: Nordics UAE Fintech Market Volume (Billion) Forecast, by Application 2020 & 2033
- Table 45: Rest of Europe UAE Fintech Market Revenue (Million) Forecast, by Application 2020 & 2033
- Table 46: Rest of Europe UAE Fintech Market Volume (Billion) Forecast, by Application 2020 & 2033
- Table 47: Global UAE Fintech Market Revenue Million Forecast, by Service proposition 2020 & 2033
- Table 48: Global UAE Fintech Market Volume Billion Forecast, by Service proposition 2020 & 2033
- Table 49: Global UAE Fintech Market Revenue Million Forecast, by Country 2020 & 2033
- Table 50: Global UAE Fintech Market Volume Billion Forecast, by Country 2020 & 2033
- Table 51: Turkey UAE Fintech Market Revenue (Million) Forecast, by Application 2020 & 2033
- Table 52: Turkey UAE Fintech Market Volume (Billion) Forecast, by Application 2020 & 2033
- Table 53: Israel UAE Fintech Market Revenue (Million) Forecast, by Application 2020 & 2033
- Table 54: Israel UAE Fintech Market Volume (Billion) Forecast, by Application 2020 & 2033
- Table 55: GCC UAE Fintech Market Revenue (Million) Forecast, by Application 2020 & 2033
- Table 56: GCC UAE Fintech Market Volume (Billion) Forecast, by Application 2020 & 2033
- Table 57: North Africa UAE Fintech Market Revenue (Million) Forecast, by Application 2020 & 2033
- Table 58: North Africa UAE Fintech Market Volume (Billion) Forecast, by Application 2020 & 2033
- Table 59: South Africa UAE Fintech Market Revenue (Million) Forecast, by Application 2020 & 2033
- Table 60: South Africa UAE Fintech Market Volume (Billion) Forecast, by Application 2020 & 2033
- Table 61: Rest of Middle East & Africa UAE Fintech Market Revenue (Million) Forecast, by Application 2020 & 2033
- Table 62: Rest of Middle East & Africa UAE Fintech Market Volume (Billion) Forecast, by Application 2020 & 2033
- Table 63: Global UAE Fintech Market Revenue Million Forecast, by Service proposition 2020 & 2033
- Table 64: Global UAE Fintech Market Volume Billion Forecast, by Service proposition 2020 & 2033
- Table 65: Global UAE Fintech Market Revenue Million Forecast, by Country 2020 & 2033
- Table 66: Global UAE Fintech Market Volume Billion Forecast, by Country 2020 & 2033
- Table 67: China UAE Fintech Market Revenue (Million) Forecast, by Application 2020 & 2033
- Table 68: China UAE Fintech Market Volume (Billion) Forecast, by Application 2020 & 2033
- Table 69: India UAE Fintech Market Revenue (Million) Forecast, by Application 2020 & 2033
- Table 70: India UAE Fintech Market Volume (Billion) Forecast, by Application 2020 & 2033
- Table 71: Japan UAE Fintech Market Revenue (Million) Forecast, by Application 2020 & 2033
- Table 72: Japan UAE Fintech Market Volume (Billion) Forecast, by Application 2020 & 2033
- Table 73: South Korea UAE Fintech Market Revenue (Million) Forecast, by Application 2020 & 2033
- Table 74: South Korea UAE Fintech Market Volume (Billion) Forecast, by Application 2020 & 2033
- Table 75: ASEAN UAE Fintech Market Revenue (Million) Forecast, by Application 2020 & 2033
- Table 76: ASEAN UAE Fintech Market Volume (Billion) Forecast, by Application 2020 & 2033
- Table 77: Oceania UAE Fintech Market Revenue (Million) Forecast, by Application 2020 & 2033
- Table 78: Oceania UAE Fintech Market Volume (Billion) Forecast, by Application 2020 & 2033
- Table 79: Rest of Asia Pacific UAE Fintech Market Revenue (Million) Forecast, by Application 2020 & 2033
- Table 80: Rest of Asia Pacific UAE Fintech Market Volume (Billion) Forecast, by Application 2020 & 2033
Frequently Asked Questions
1. What is the projected Compound Annual Growth Rate (CAGR) of the UAE Fintech Market?
The projected CAGR is approximately 12.56%.
2. Which companies are prominent players in the UAE Fintech Market?
Key companies in the market include Tabby, Yalla Compare, Sehteq, Beehive FinTech, Souqalmal, Sarwa, Mamo Pay, Channel VAS, Zinna, Now Money**List Not Exhaustive.
3. What are the main segments of the UAE Fintech Market?
The market segments include Service proposition.
4. Can you provide details about the market size?
The market size is estimated to be USD 3.16 Million as of 2022.
5. What are some drivers contributing to market growth?
Rise in the Number of Fintech Startups is Driving the Market; Favorable Regulatory Compliance Landscape is Promoting the Fintech Market.
6. What are the notable trends driving market growth?
The Market is Being Driven by the Development of New Technologies.
7. Are there any restraints impacting market growth?
Rise in the Number of Fintech Startups is Driving the Market; Favorable Regulatory Compliance Landscape is Promoting the Fintech Market.
8. Can you provide examples of recent developments in the market?
August 2023: MENA’s number one shopping and fintech app, Tabby, launched its latest all-in-one shopping tool, Tabby Shop. This is the biggest update to Tabby’s app since its inception. Tabi Shop is a comprehensive shopping app that brings together more than 500,000+ products from over 10,000+ brands in the Fashion, Beauty, Home, and Electronics categories. Tabby Shop offers several shopping tools, such as smarter search, better wishlists, deal notifications, and more.
9. What pricing options are available for accessing the report?
Pricing options include single-user, multi-user, and enterprise licenses priced at USD 3800, USD 4500, and USD 5800 respectively.
10. Is the market size provided in terms of value or volume?
The market size is provided in terms of value, measured in Million and volume, measured in Billion.
11. Are there any specific market keywords associated with the report?
Yes, the market keyword associated with the report is "UAE Fintech Market," which aids in identifying and referencing the specific market segment covered.
12. How do I determine which pricing option suits my needs best?
The pricing options vary based on user requirements and access needs. Individual users may opt for single-user licenses, while businesses requiring broader access may choose multi-user or enterprise licenses for cost-effective access to the report.
13. Are there any additional resources or data provided in the UAE Fintech Market report?
While the report offers comprehensive insights, it's advisable to review the specific contents or supplementary materials provided to ascertain if additional resources or data are available.
14. How can I stay updated on further developments or reports in the UAE Fintech Market?
To stay informed about further developments, trends, and reports in the UAE Fintech Market, consider subscribing to industry newsletters, following relevant companies and organizations, or regularly checking reputable industry news sources and publications.
Methodology
Step 1 - Identification of Relevant Samples Size from Population Database


Step 2 - Approaches for Defining Global Market Size (Value, Volume* & Price*)

Note*: In applicable scenarios
Step 3 - Data Sources
Primary Research
- Web Analytics
- Survey Reports
- Research Institute
- Latest Research Reports
- Opinion Leaders
Secondary Research
- Annual Reports
- White Paper
- Latest Press Release
- Industry Association
- Paid Database
- Investor Presentations

Step 4 - Data Triangulation
Involves using different sources of information in order to increase the validity of a study
These sources are likely to be stakeholders in a program - participants, other researchers, program staff, other community members, and so on.
Then we put all data in single framework & apply various statistical tools to find out the dynamic on the market.
During the analysis stage, feedback from the stakeholder groups would be compared to determine areas of agreement as well as areas of divergence