

Key Insights
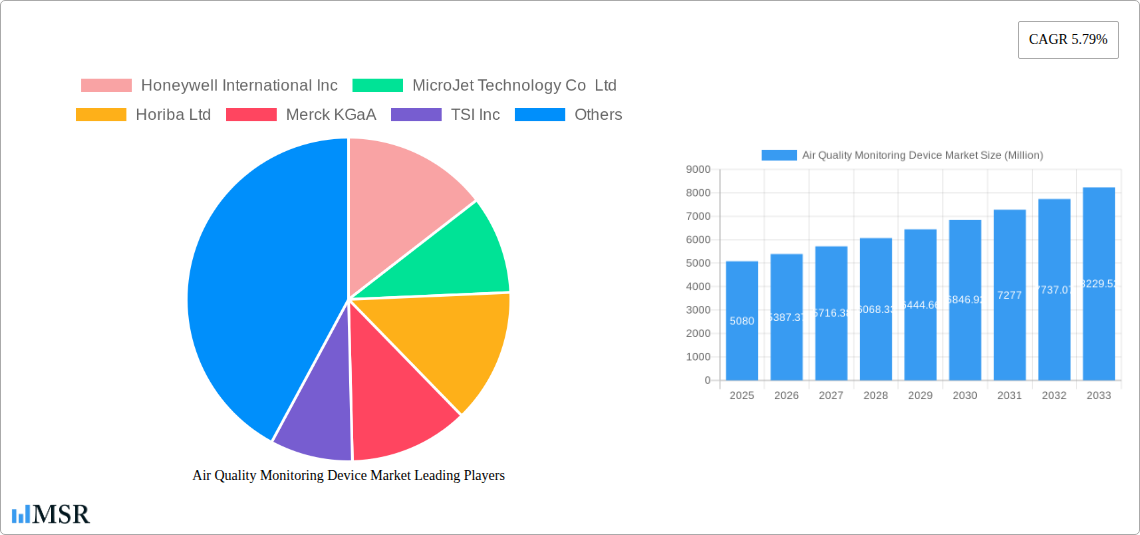
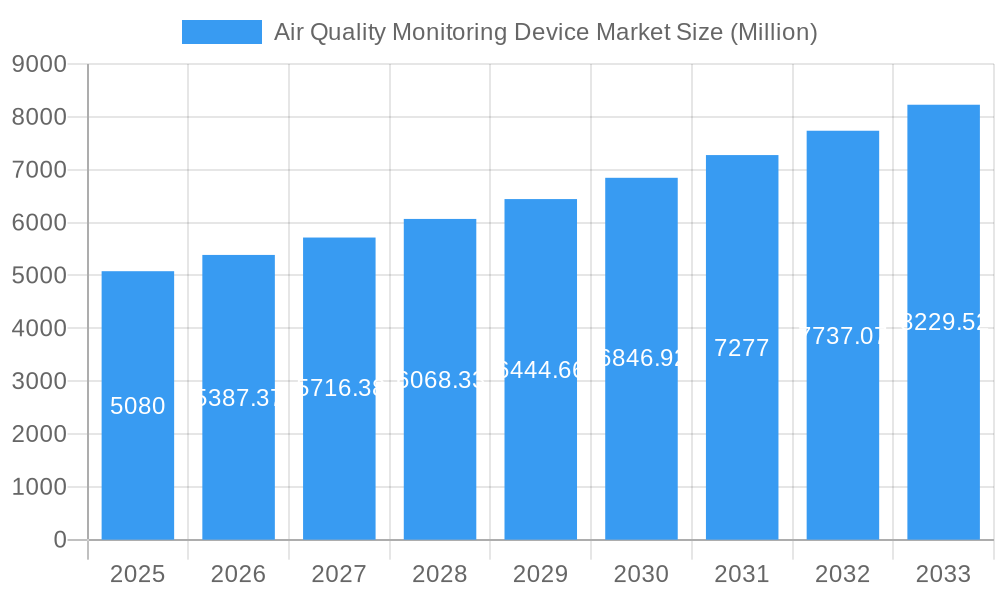
The Air Quality Monitoring Device market is experiencing robust growth, projected to reach \$5.08 billion in 2025 and maintain a Compound Annual Growth Rate (CAGR) of 5.79% from 2025 to 2033. This expansion is driven by several key factors. Increasing awareness of air pollution's health impacts, coupled with stringent government regulations aimed at improving air quality, are significantly boosting demand across residential, commercial, and industrial sectors. The rising adoption of smart city initiatives and the proliferation of IoT (Internet of Things) technologies are further fueling market growth, enabling real-time monitoring and data analysis for improved decision-making. Technological advancements leading to the development of more accurate, portable, and cost-effective devices are also contributing to market expansion. Growth is particularly strong in regions like Asia-Pacific, fueled by rapid urbanization and industrialization, while North America and Europe maintain significant market shares driven by established regulatory frameworks and consumer awareness. The market segmentation reveals strong growth in continuous monitoring systems across diverse end-use sectors including power generation and petrochemicals, emphasizing the importance of continuous data collection for effective air quality management.
Air Quality Monitoring Device Market Market Size (In Billion)
Market restraints primarily involve high initial investment costs for advanced monitoring systems, particularly for smaller businesses and residential users. However, this is being mitigated by the decreasing cost of sensors and related technologies. Furthermore, the need for skilled personnel to operate and maintain these systems presents a challenge, although training programs and user-friendly interfaces are gradually addressing this concern. Competition among established players like Honeywell, Thermo Fisher Scientific, and Siemens, along with the emergence of innovative startups, is fostering innovation and driving prices down, making these devices more accessible. Future growth hinges on continued technological advancements, supportive government policies, and increasing public awareness of the importance of clean air. The integration of advanced analytics and machine learning capabilities into monitoring systems will likely further shape market trends, providing more actionable insights for pollution control and public health initiatives.
Air Quality Monitoring Device Market Company Market Share
Air Quality Monitoring Device Market Report: 2019-2033
This comprehensive report provides an in-depth analysis of the Air Quality Monitoring Device market, offering invaluable insights for stakeholders across the industry. Covering the period 2019-2033, with a base year of 2025 and a forecast period of 2025-2033, this report unveils market dynamics, key trends, and future opportunities. The global market is estimated at xx Million in 2025, projected to reach xx Million by 2033, exhibiting a CAGR of xx%.
Air Quality Monitoring Device Market Market Concentration & Dynamics
The Air Quality Monitoring Device market exhibits a moderately concentrated landscape, with several key players holding significant market share. Honeywell International Inc, Thermo Fisher Scientific Inc, and 3M Co are among the leading companies, each contributing a substantial portion to the overall market revenue. Market share data for 2024 indicates Honeywell at approximately 15%, Thermo Fisher at 12%, and 3M at 10%, while other players contribute to the remaining 63%. Innovation within the sector is driven by advancements in sensor technology, data analytics, and connectivity. Stringent environmental regulations globally are a key growth driver, pushing demand for sophisticated monitoring solutions. The market also sees significant M&A activity, with an estimated xx M&A deals recorded between 2019 and 2024. Substitute products, such as less advanced monitoring techniques, pose a competitive challenge, though the demand for precise and reliable data is driving growth of sophisticated devices.
- Market Concentration: Moderately concentrated, with a few dominant players.
- Innovation: Focus on sensor technology, data analytics, and connectivity.
- Regulatory Framework: Stringent environmental regulations driving market growth.
- Substitute Products: Less advanced monitoring methods pose a competitive threat.
- End-User Trends: Increasing demand from residential, commercial, and industrial sectors.
- M&A Activity: Approximately xx M&A deals between 2019 and 2024.
Air Quality Monitoring Device Market Industry Insights & Trends
The Air Quality Monitoring Device market is experiencing robust growth, fueled by rising environmental concerns, increasing urbanization, and stricter government regulations. The market size is estimated at xx Million in 2025 and is expected to witness significant expansion, driven primarily by growing awareness of air pollution's health impacts and the need for accurate, real-time data. Technological advancements, such as the integration of IoT and AI technologies into monitoring devices, are revolutionizing the industry, enabling enhanced data analysis and predictive capabilities. Consumer behavior is shifting towards greater awareness and demand for personal air quality monitoring devices, boosting the residential segment's growth. The increasing adoption of smart homes and buildings is further contributing to market expansion. The market is also witnessing a growing preference for continuous monitoring systems over intermittent methods, driven by the need for comprehensive data.
Key Markets & Segments Leading Air Quality Monitoring Device Market
The global Air Quality Monitoring Device market is segmented by product type (Indoor Monitor, Outdoor Monitor), sampling method (Continuous, Manual, Intermittent), and end-user (Residential and Commercial, Power Generation, Petrochemicals, Other End Users). While the data for exact market share dominance is unavailable, we predict that the Outdoor Monitor segment holds a larger market share than the Indoor Monitor segment due to the widespread need for monitoring ambient air quality in various applications. Continuous sampling methods are anticipated to dominate other sampling methods, given the preference for continuous, real-time data over intermittent measurements. The Industrial sector, encompassing Power Generation and Petrochemicals, is also anticipated to show strong growth, driven by regulatory compliance and environmental responsibility.
- Dominant Region: Asia-Pacific (due to increasing industrialization and urbanization).
- Product Type: Outdoor Monitors expected to dominate due to broad applications.
- Sampling Method: Continuous monitoring anticipated to hold the largest market share.
- End User: Industrial sector (Power Generation and Petrochemicals) is expected to show significant growth.
Drivers:
- Economic Growth: Rising disposable incomes in developing countries fuels demand.
- Infrastructure Development: Expanding urban infrastructure necessitates robust air quality monitoring.
- Stringent Regulations: Government mandates drive adoption in various sectors.
Air Quality Monitoring Device Market Product Developments
Recent product innovations focus on miniaturization, enhanced sensor accuracy, improved data analytics capabilities, and seamless integration with IoT platforms. New devices offer advanced features like real-time data visualization, remote monitoring, and predictive analytics. These advancements offer a competitive edge, enabling manufacturers to provide more comprehensive and user-friendly solutions. The integration of AI algorithms is enhancing the accuracy of pollution predictions, while the incorporation of wireless technologies facilitates easy data transmission and remote management.
Challenges in the Air Quality Monitoring Device Market Market
The Air Quality Monitoring Device market faces several challenges. High initial investment costs can hinder adoption, especially for smaller businesses or residential users. Supply chain disruptions and the volatility of raw material prices can impact production costs. Intense competition among established players and new entrants creates pressure on pricing and margins. Stringent regulatory compliance requirements can add to compliance costs. Furthermore, data security and privacy concerns are increasingly becoming significant challenges for data-driven solutions.
Forces Driving Air Quality Monitoring Device Market Growth
Several factors fuel the growth of the Air Quality Monitoring Device market. The rising awareness of air pollution's health impact and the increasing frequency of extreme weather events are driving demand. Governments worldwide are implementing stricter regulations for emission control, leading to increased adoption of monitoring devices. Technological advancements, particularly in sensor technology and data analytics, are enhancing the accuracy and efficiency of monitoring systems. The rise of smart cities and the integration of IoT technology further propel market expansion.
Challenges in the Air Quality Monitoring Device Market Market
Long-term growth is fueled by continued technological innovation, strategic partnerships, and market expansion into emerging economies. The development of low-cost, high-accuracy sensors and the integration of advanced data analysis techniques will drive adoption. Strategic collaborations between manufacturers and data analytics firms will enhance data interpretation and actionability. Expanding into emerging markets with growing environmental concerns will unlock new growth avenues.
Emerging Opportunities in Air Quality Monitoring Device Market
Emerging opportunities lie in developing portable, user-friendly devices for personal air quality monitoring. The integration of air quality data with other environmental parameters offers potential for comprehensive environmental monitoring. Expanding into niche markets such as precision agriculture and smart transportation offers considerable growth potential. The development of low-power, long-life sensors is crucial for reducing operational costs and extending device longevity. Developing solutions for monitoring specific pollutants of concern in particular regions will also drive innovation and demand.
Leading Players in the Air Quality Monitoring Device Market Sector
- Honeywell International Inc (Honeywell)
- MicroJet Technology Co Ltd
- Horiba Ltd (Horiba)
- Merck KGaA (Merck)
- TSI Inc (TSI)
- Thermo Fisher Scientific Inc (Thermo Fisher Scientific)
- Hawa Dawa GmbH
- Emerson Electric Co (Emerson)
- Siemens AG (Siemens)
- Agilent Technologies Inc (Agilent Technologies)
- 3M Co (3M)
- Teledyne Technologies Inc (Teledyne Technologies)
Key Milestones in Air Quality Monitoring Device Market Industry
- March 2023: Tyndall National Institute participates in a European project to improve air quality monitoring, receiving EC funding.
- February 2022: Hawa Dawa partners with Thies Clima to offer a comprehensive air quality and weather data solution.
Strategic Outlook for Air Quality Monitoring Device Market Market
The Air Quality Monitoring Device market presents significant growth potential. Continued technological advancements, expanding regulatory frameworks, and rising environmental awareness will drive demand. Strategic partnerships and collaborations will be crucial for enhancing product offerings and expanding market reach. Focusing on data analytics and predictive capabilities will create value for customers. Expansion into emerging markets will unlock new growth opportunities.
Air Quality Monitoring Device Market Segmentation
-
1. Product Type
- 1.1. Indoor Monitor
- 1.2. Outdoor Monitor
-
2. Sampling Method
- 2.1. Continuous
- 2.2. Manual
- 2.3. Intermittent
-
3. End User
- 3.1. Residential and Commercial
- 3.2. Power Generation
- 3.3. Petrochemicals
- 3.4. Other End Users
Air Quality Monitoring Device Market Segmentation By Geography
-
1. North America
- 1.1. United States
- 1.2. Canada
- 1.3. Rest of the North America
-
2. Europe
- 2.1. United Kingdom
- 2.2. Spain
- 2.3. Germany
- 2.4. Italy
-
3. Asia
- 3.1. China
- 3.2. Japan
- 3.3. Vietnam
- 3.4. India
- 3.5. Australia and New Zealand
-
4. South America
- 4.1. Brazil
- 4.2. Argentina
-
5. Middle East and Africa
- 5.1. United Arab Emirates
- 5.2. South Africa
- 5.3. Saudi Arabia
- 5.4. Iraq
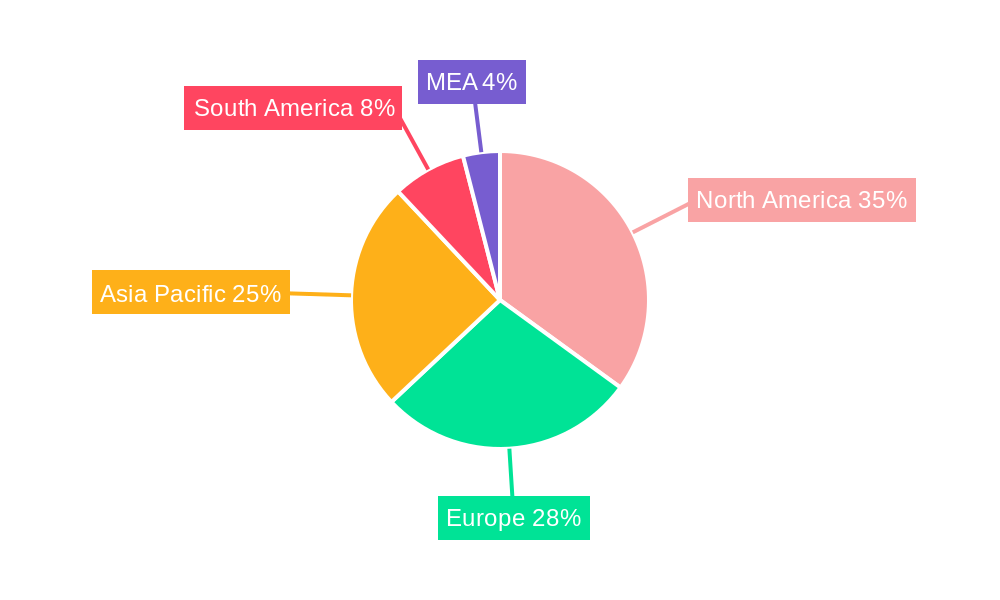
Air Quality Monitoring Device Market Regional Market Share
Geographic Coverage of Air Quality Monitoring Device Market
Air Quality Monitoring Device Market REPORT HIGHLIGHTS
| Aspects | Details |
|---|---|
| Study Period | 2020-2034 |
| Base Year | 2025 |
| Estimated Year | 2026 |
| Forecast Period | 2026-2034 |
| Historical Period | 2020-2025 |
| Growth Rate | CAGR of 5.79% from 2020-2034 |
| Segmentation |
|
Table of Contents
- 1. Introduction
- 1.1. Research Scope
- 1.2. Market Segmentation
- 1.3. Research Objective
- 1.4. Definitions and Assumptions
- 2. Executive Summary
- 2.1. Market Snapshot
- 3. Market Dynamics
- 3.1. Market Drivers
- 3.2. Market Restrains
- 3.3. Market Trends
- 3.4. Market Opportunities
- 4. Market Factor Analysis
- 4.1. Porters Five Forces
- 4.1.1. Bargaining Power of Suppliers
- 4.1.2. Bargaining Power of Buyers
- 4.1.3. Threat of New Entrants
- 4.1.4. Threat of Substitutes
- 4.1.5. Competitive Rivalry
- 4.2. PESTEL analysis
- 4.3. BCG Analysis
- 4.3.1. Stars (High Growth, High Market Share)
- 4.3.2. Cash Cows (Low Growth, High Market Share)
- 4.3.3. Question Mark (High Growth, Low Market Share)
- 4.3.4. Dogs (Low Growth, Low Market Share)
- 4.4. Ansoff Matrix Analysis
- 4.5. Supply Chain Analysis
- 4.6. Regulatory Landscape
- 4.7. Current Market Potential and Opportunity Assessment (TAM–SAM–SOM Framework)
- 4.8. MSR Analyst Note
- 4.1. Porters Five Forces
- 5. Market Analysis, Insights and Forecast 2021-2033
- 5.1. Market Analysis, Insights and Forecast - by Product Type
- 5.1.1. Indoor Monitor
- 5.1.2. Outdoor Monitor
- 5.2. Market Analysis, Insights and Forecast - by Sampling Method
- 5.2.1. Continuous
- 5.2.2. Manual
- 5.2.3. Intermittent
- 5.3. Market Analysis, Insights and Forecast - by End User
- 5.3.1. Residential and Commercial
- 5.3.2. Power Generation
- 5.3.3. Petrochemicals
- 5.3.4. Other End Users
- 5.4. Market Analysis, Insights and Forecast - by Region
- 5.4.1. North America
- 5.4.2. Europe
- 5.4.3. Asia
- 5.4.4. South America
- 5.4.5. Middle East and Africa
- 5.1. Market Analysis, Insights and Forecast - by Product Type
- 6. Global Air Quality Monitoring Device Market Analysis, Insights and Forecast, 2021-2033
- 6.1. Market Analysis, Insights and Forecast - by Product Type
- 6.1.1. Indoor Monitor
- 6.1.2. Outdoor Monitor
- 6.2. Market Analysis, Insights and Forecast - by Sampling Method
- 6.2.1. Continuous
- 6.2.2. Manual
- 6.2.3. Intermittent
- 6.3. Market Analysis, Insights and Forecast - by End User
- 6.3.1. Residential and Commercial
- 6.3.2. Power Generation
- 6.3.3. Petrochemicals
- 6.3.4. Other End Users
- 6.1. Market Analysis, Insights and Forecast - by Product Type
- 7. North America Air Quality Monitoring Device Market Analysis, Insights and Forecast, 2020-2032
- 7.1. Market Analysis, Insights and Forecast - by Product Type
- 7.1.1. Indoor Monitor
- 7.1.2. Outdoor Monitor
- 7.2. Market Analysis, Insights and Forecast - by Sampling Method
- 7.2.1. Continuous
- 7.2.2. Manual
- 7.2.3. Intermittent
- 7.3. Market Analysis, Insights and Forecast - by End User
- 7.3.1. Residential and Commercial
- 7.3.2. Power Generation
- 7.3.3. Petrochemicals
- 7.3.4. Other End Users
- 7.1. Market Analysis, Insights and Forecast - by Product Type
- 8. Europe Air Quality Monitoring Device Market Analysis, Insights and Forecast, 2020-2032
- 8.1. Market Analysis, Insights and Forecast - by Product Type
- 8.1.1. Indoor Monitor
- 8.1.2. Outdoor Monitor
- 8.2. Market Analysis, Insights and Forecast - by Sampling Method
- 8.2.1. Continuous
- 8.2.2. Manual
- 8.2.3. Intermittent
- 8.3. Market Analysis, Insights and Forecast - by End User
- 8.3.1. Residential and Commercial
- 8.3.2. Power Generation
- 8.3.3. Petrochemicals
- 8.3.4. Other End Users
- 8.1. Market Analysis, Insights and Forecast - by Product Type
- 9. Asia Air Quality Monitoring Device Market Analysis, Insights and Forecast, 2020-2032
- 9.1. Market Analysis, Insights and Forecast - by Product Type
- 9.1.1. Indoor Monitor
- 9.1.2. Outdoor Monitor
- 9.2. Market Analysis, Insights and Forecast - by Sampling Method
- 9.2.1. Continuous
- 9.2.2. Manual
- 9.2.3. Intermittent
- 9.3. Market Analysis, Insights and Forecast - by End User
- 9.3.1. Residential and Commercial
- 9.3.2. Power Generation
- 9.3.3. Petrochemicals
- 9.3.4. Other End Users
- 9.1. Market Analysis, Insights and Forecast - by Product Type
- 10. South America Air Quality Monitoring Device Market Analysis, Insights and Forecast, 2020-2032
- 10.1. Market Analysis, Insights and Forecast - by Product Type
- 10.1.1. Indoor Monitor
- 10.1.2. Outdoor Monitor
- 10.2. Market Analysis, Insights and Forecast - by Sampling Method
- 10.2.1. Continuous
- 10.2.2. Manual
- 10.2.3. Intermittent
- 10.3. Market Analysis, Insights and Forecast - by End User
- 10.3.1. Residential and Commercial
- 10.3.2. Power Generation
- 10.3.3. Petrochemicals
- 10.3.4. Other End Users
- 10.1. Market Analysis, Insights and Forecast - by Product Type
- 11. Middle East and Africa Air Quality Monitoring Device Market Analysis, Insights and Forecast, 2020-2032
- 11.1. Market Analysis, Insights and Forecast - by Product Type
- 11.1.1. Indoor Monitor
- 11.1.2. Outdoor Monitor
- 11.2. Market Analysis, Insights and Forecast - by Sampling Method
- 11.2.1. Continuous
- 11.2.2. Manual
- 11.2.3. Intermittent
- 11.3. Market Analysis, Insights and Forecast - by End User
- 11.3.1. Residential and Commercial
- 11.3.2. Power Generation
- 11.3.3. Petrochemicals
- 11.3.4. Other End Users
- 11.1. Market Analysis, Insights and Forecast - by Product Type
- 12. Competitive Analysis
- 12.1. Company Profiles
- 12.1.1 Honeywell International Inc
- 12.1.1.1. Company Overview
- 12.1.1.2. Products
- 12.1.1.3. Company Financials
- 12.1.1.4. SWOT Analysis
- 12.1.2 MicroJet Technology Co Ltd
- 12.1.2.1. Company Overview
- 12.1.2.2. Products
- 12.1.2.3. Company Financials
- 12.1.2.4. SWOT Analysis
- 12.1.3 Horiba Ltd
- 12.1.3.1. Company Overview
- 12.1.3.2. Products
- 12.1.3.3. Company Financials
- 12.1.3.4. SWOT Analysis
- 12.1.4 Merck KGaA
- 12.1.4.1. Company Overview
- 12.1.4.2. Products
- 12.1.4.3. Company Financials
- 12.1.4.4. SWOT Analysis
- 12.1.5 TSI Inc
- 12.1.5.1. Company Overview
- 12.1.5.2. Products
- 12.1.5.3. Company Financials
- 12.1.5.4. SWOT Analysis
- 12.1.6 Thermo Fisher Scientific Inc
- 12.1.6.1. Company Overview
- 12.1.6.2. Products
- 12.1.6.3. Company Financials
- 12.1.6.4. SWOT Analysis
- 12.1.7 Hawa Dawa GmbH
- 12.1.7.1. Company Overview
- 12.1.7.2. Products
- 12.1.7.3. Company Financials
- 12.1.7.4. SWOT Analysis
- 12.1.8 Emerson Electric Co
- 12.1.8.1. Company Overview
- 12.1.8.2. Products
- 12.1.8.3. Company Financials
- 12.1.8.4. SWOT Analysis
- 12.1.9 Siemens AG
- 12.1.9.1. Company Overview
- 12.1.9.2. Products
- 12.1.9.3. Company Financials
- 12.1.9.4. SWOT Analysis
- 12.1.10 Agilent Technologies Inc
- 12.1.10.1. Company Overview
- 12.1.10.2. Products
- 12.1.10.3. Company Financials
- 12.1.10.4. SWOT Analysis
- 12.1.11 3M Co
- 12.1.11.1. Company Overview
- 12.1.11.2. Products
- 12.1.11.3. Company Financials
- 12.1.11.4. SWOT Analysis
- 12.1.12 Teledyne Technologies Inc
- 12.1.12.1. Company Overview
- 12.1.12.2. Products
- 12.1.12.3. Company Financials
- 12.1.12.4. SWOT Analysis
- 12.1.1 Honeywell International Inc
- 12.2. Market Entropy
- 12.2.1 Company's Key Areas Served
- 12.2.2 Recent Developments
- 12.3. Company Market Share Analysis 2025
- 12.3.1 Top 5 Companies Market Share Analysis
- 12.3.2 Top 3 Companies Market Share Analysis
- 12.4. List of Potential Customers
- 13. Research Methodology
List of Figures
- Figure 1: Global Air Quality Monitoring Device Market Revenue Breakdown (Million, %) by Region 2025 & 2033
- Figure 2: Global Air Quality Monitoring Device Market Volume Breakdown (K Units, %) by Region 2025 & 2033
- Figure 3: North America Air Quality Monitoring Device Market Revenue (Million), by Product Type 2025 & 2033
- Figure 4: North America Air Quality Monitoring Device Market Volume (K Units), by Product Type 2025 & 2033
- Figure 5: North America Air Quality Monitoring Device Market Revenue Share (%), by Product Type 2025 & 2033
- Figure 6: North America Air Quality Monitoring Device Market Volume Share (%), by Product Type 2025 & 2033
- Figure 7: North America Air Quality Monitoring Device Market Revenue (Million), by Sampling Method 2025 & 2033
- Figure 8: North America Air Quality Monitoring Device Market Volume (K Units), by Sampling Method 2025 & 2033
- Figure 9: North America Air Quality Monitoring Device Market Revenue Share (%), by Sampling Method 2025 & 2033
- Figure 10: North America Air Quality Monitoring Device Market Volume Share (%), by Sampling Method 2025 & 2033
- Figure 11: North America Air Quality Monitoring Device Market Revenue (Million), by End User 2025 & 2033
- Figure 12: North America Air Quality Monitoring Device Market Volume (K Units), by End User 2025 & 2033
- Figure 13: North America Air Quality Monitoring Device Market Revenue Share (%), by End User 2025 & 2033
- Figure 14: North America Air Quality Monitoring Device Market Volume Share (%), by End User 2025 & 2033
- Figure 15: North America Air Quality Monitoring Device Market Revenue (Million), by Country 2025 & 2033
- Figure 16: North America Air Quality Monitoring Device Market Volume (K Units), by Country 2025 & 2033
- Figure 17: North America Air Quality Monitoring Device Market Revenue Share (%), by Country 2025 & 2033
- Figure 18: North America Air Quality Monitoring Device Market Volume Share (%), by Country 2025 & 2033
- Figure 19: Europe Air Quality Monitoring Device Market Revenue (Million), by Product Type 2025 & 2033
- Figure 20: Europe Air Quality Monitoring Device Market Volume (K Units), by Product Type 2025 & 2033
- Figure 21: Europe Air Quality Monitoring Device Market Revenue Share (%), by Product Type 2025 & 2033
- Figure 22: Europe Air Quality Monitoring Device Market Volume Share (%), by Product Type 2025 & 2033
- Figure 23: Europe Air Quality Monitoring Device Market Revenue (Million), by Sampling Method 2025 & 2033
- Figure 24: Europe Air Quality Monitoring Device Market Volume (K Units), by Sampling Method 2025 & 2033
- Figure 25: Europe Air Quality Monitoring Device Market Revenue Share (%), by Sampling Method 2025 & 2033
- Figure 26: Europe Air Quality Monitoring Device Market Volume Share (%), by Sampling Method 2025 & 2033
- Figure 27: Europe Air Quality Monitoring Device Market Revenue (Million), by End User 2025 & 2033
- Figure 28: Europe Air Quality Monitoring Device Market Volume (K Units), by End User 2025 & 2033
- Figure 29: Europe Air Quality Monitoring Device Market Revenue Share (%), by End User 2025 & 2033
- Figure 30: Europe Air Quality Monitoring Device Market Volume Share (%), by End User 2025 & 2033
- Figure 31: Europe Air Quality Monitoring Device Market Revenue (Million), by Country 2025 & 2033
- Figure 32: Europe Air Quality Monitoring Device Market Volume (K Units), by Country 2025 & 2033
- Figure 33: Europe Air Quality Monitoring Device Market Revenue Share (%), by Country 2025 & 2033
- Figure 34: Europe Air Quality Monitoring Device Market Volume Share (%), by Country 2025 & 2033
- Figure 35: Asia Air Quality Monitoring Device Market Revenue (Million), by Product Type 2025 & 2033
- Figure 36: Asia Air Quality Monitoring Device Market Volume (K Units), by Product Type 2025 & 2033
- Figure 37: Asia Air Quality Monitoring Device Market Revenue Share (%), by Product Type 2025 & 2033
- Figure 38: Asia Air Quality Monitoring Device Market Volume Share (%), by Product Type 2025 & 2033
- Figure 39: Asia Air Quality Monitoring Device Market Revenue (Million), by Sampling Method 2025 & 2033
- Figure 40: Asia Air Quality Monitoring Device Market Volume (K Units), by Sampling Method 2025 & 2033
- Figure 41: Asia Air Quality Monitoring Device Market Revenue Share (%), by Sampling Method 2025 & 2033
- Figure 42: Asia Air Quality Monitoring Device Market Volume Share (%), by Sampling Method 2025 & 2033
- Figure 43: Asia Air Quality Monitoring Device Market Revenue (Million), by End User 2025 & 2033
- Figure 44: Asia Air Quality Monitoring Device Market Volume (K Units), by End User 2025 & 2033
- Figure 45: Asia Air Quality Monitoring Device Market Revenue Share (%), by End User 2025 & 2033
- Figure 46: Asia Air Quality Monitoring Device Market Volume Share (%), by End User 2025 & 2033
- Figure 47: Asia Air Quality Monitoring Device Market Revenue (Million), by Country 2025 & 2033
- Figure 48: Asia Air Quality Monitoring Device Market Volume (K Units), by Country 2025 & 2033
- Figure 49: Asia Air Quality Monitoring Device Market Revenue Share (%), by Country 2025 & 2033
- Figure 50: Asia Air Quality Monitoring Device Market Volume Share (%), by Country 2025 & 2033
- Figure 51: South America Air Quality Monitoring Device Market Revenue (Million), by Product Type 2025 & 2033
- Figure 52: South America Air Quality Monitoring Device Market Volume (K Units), by Product Type 2025 & 2033
- Figure 53: South America Air Quality Monitoring Device Market Revenue Share (%), by Product Type 2025 & 2033
- Figure 54: South America Air Quality Monitoring Device Market Volume Share (%), by Product Type 2025 & 2033
- Figure 55: South America Air Quality Monitoring Device Market Revenue (Million), by Sampling Method 2025 & 2033
- Figure 56: South America Air Quality Monitoring Device Market Volume (K Units), by Sampling Method 2025 & 2033
- Figure 57: South America Air Quality Monitoring Device Market Revenue Share (%), by Sampling Method 2025 & 2033
- Figure 58: South America Air Quality Monitoring Device Market Volume Share (%), by Sampling Method 2025 & 2033
- Figure 59: South America Air Quality Monitoring Device Market Revenue (Million), by End User 2025 & 2033
- Figure 60: South America Air Quality Monitoring Device Market Volume (K Units), by End User 2025 & 2033
- Figure 61: South America Air Quality Monitoring Device Market Revenue Share (%), by End User 2025 & 2033
- Figure 62: South America Air Quality Monitoring Device Market Volume Share (%), by End User 2025 & 2033
- Figure 63: South America Air Quality Monitoring Device Market Revenue (Million), by Country 2025 & 2033
- Figure 64: South America Air Quality Monitoring Device Market Volume (K Units), by Country 2025 & 2033
- Figure 65: South America Air Quality Monitoring Device Market Revenue Share (%), by Country 2025 & 2033
- Figure 66: South America Air Quality Monitoring Device Market Volume Share (%), by Country 2025 & 2033
- Figure 67: Middle East and Africa Air Quality Monitoring Device Market Revenue (Million), by Product Type 2025 & 2033
- Figure 68: Middle East and Africa Air Quality Monitoring Device Market Volume (K Units), by Product Type 2025 & 2033
- Figure 69: Middle East and Africa Air Quality Monitoring Device Market Revenue Share (%), by Product Type 2025 & 2033
- Figure 70: Middle East and Africa Air Quality Monitoring Device Market Volume Share (%), by Product Type 2025 & 2033
- Figure 71: Middle East and Africa Air Quality Monitoring Device Market Revenue (Million), by Sampling Method 2025 & 2033
- Figure 72: Middle East and Africa Air Quality Monitoring Device Market Volume (K Units), by Sampling Method 2025 & 2033
- Figure 73: Middle East and Africa Air Quality Monitoring Device Market Revenue Share (%), by Sampling Method 2025 & 2033
- Figure 74: Middle East and Africa Air Quality Monitoring Device Market Volume Share (%), by Sampling Method 2025 & 2033
- Figure 75: Middle East and Africa Air Quality Monitoring Device Market Revenue (Million), by End User 2025 & 2033
- Figure 76: Middle East and Africa Air Quality Monitoring Device Market Volume (K Units), by End User 2025 & 2033
- Figure 77: Middle East and Africa Air Quality Monitoring Device Market Revenue Share (%), by End User 2025 & 2033
- Figure 78: Middle East and Africa Air Quality Monitoring Device Market Volume Share (%), by End User 2025 & 2033
- Figure 79: Middle East and Africa Air Quality Monitoring Device Market Revenue (Million), by Country 2025 & 2033
- Figure 80: Middle East and Africa Air Quality Monitoring Device Market Volume (K Units), by Country 2025 & 2033
- Figure 81: Middle East and Africa Air Quality Monitoring Device Market Revenue Share (%), by Country 2025 & 2033
- Figure 82: Middle East and Africa Air Quality Monitoring Device Market Volume Share (%), by Country 2025 & 2033
List of Tables
- Table 1: Global Air Quality Monitoring Device Market Revenue Million Forecast, by Product Type 2020 & 2033
- Table 2: Global Air Quality Monitoring Device Market Volume K Units Forecast, by Product Type 2020 & 2033
- Table 3: Global Air Quality Monitoring Device Market Revenue Million Forecast, by Sampling Method 2020 & 2033
- Table 4: Global Air Quality Monitoring Device Market Volume K Units Forecast, by Sampling Method 2020 & 2033
- Table 5: Global Air Quality Monitoring Device Market Revenue Million Forecast, by End User 2020 & 2033
- Table 6: Global Air Quality Monitoring Device Market Volume K Units Forecast, by End User 2020 & 2033
- Table 7: Global Air Quality Monitoring Device Market Revenue Million Forecast, by Region 2020 & 2033
- Table 8: Global Air Quality Monitoring Device Market Volume K Units Forecast, by Region 2020 & 2033
- Table 9: Global Air Quality Monitoring Device Market Revenue Million Forecast, by Product Type 2020 & 2033
- Table 10: Global Air Quality Monitoring Device Market Volume K Units Forecast, by Product Type 2020 & 2033
- Table 11: Global Air Quality Monitoring Device Market Revenue Million Forecast, by Sampling Method 2020 & 2033
- Table 12: Global Air Quality Monitoring Device Market Volume K Units Forecast, by Sampling Method 2020 & 2033
- Table 13: Global Air Quality Monitoring Device Market Revenue Million Forecast, by End User 2020 & 2033
- Table 14: Global Air Quality Monitoring Device Market Volume K Units Forecast, by End User 2020 & 2033
- Table 15: Global Air Quality Monitoring Device Market Revenue Million Forecast, by Country 2020 & 2033
- Table 16: Global Air Quality Monitoring Device Market Volume K Units Forecast, by Country 2020 & 2033
- Table 17: United States Air Quality Monitoring Device Market Revenue (Million) Forecast, by Application 2020 & 2033
- Table 18: United States Air Quality Monitoring Device Market Volume (K Units) Forecast, by Application 2020 & 2033
- Table 19: Canada Air Quality Monitoring Device Market Revenue (Million) Forecast, by Application 2020 & 2033
- Table 20: Canada Air Quality Monitoring Device Market Volume (K Units) Forecast, by Application 2020 & 2033
- Table 21: Rest of the North America Air Quality Monitoring Device Market Revenue (Million) Forecast, by Application 2020 & 2033
- Table 22: Rest of the North America Air Quality Monitoring Device Market Volume (K Units) Forecast, by Application 2020 & 2033
- Table 23: Global Air Quality Monitoring Device Market Revenue Million Forecast, by Product Type 2020 & 2033
- Table 24: Global Air Quality Monitoring Device Market Volume K Units Forecast, by Product Type 2020 & 2033
- Table 25: Global Air Quality Monitoring Device Market Revenue Million Forecast, by Sampling Method 2020 & 2033
- Table 26: Global Air Quality Monitoring Device Market Volume K Units Forecast, by Sampling Method 2020 & 2033
- Table 27: Global Air Quality Monitoring Device Market Revenue Million Forecast, by End User 2020 & 2033
- Table 28: Global Air Quality Monitoring Device Market Volume K Units Forecast, by End User 2020 & 2033
- Table 29: Global Air Quality Monitoring Device Market Revenue Million Forecast, by Country 2020 & 2033
- Table 30: Global Air Quality Monitoring Device Market Volume K Units Forecast, by Country 2020 & 2033
- Table 31: United Kingdom Air Quality Monitoring Device Market Revenue (Million) Forecast, by Application 2020 & 2033
- Table 32: United Kingdom Air Quality Monitoring Device Market Volume (K Units) Forecast, by Application 2020 & 2033
- Table 33: Spain Air Quality Monitoring Device Market Revenue (Million) Forecast, by Application 2020 & 2033
- Table 34: Spain Air Quality Monitoring Device Market Volume (K Units) Forecast, by Application 2020 & 2033
- Table 35: Germany Air Quality Monitoring Device Market Revenue (Million) Forecast, by Application 2020 & 2033
- Table 36: Germany Air Quality Monitoring Device Market Volume (K Units) Forecast, by Application 2020 & 2033
- Table 37: Italy Air Quality Monitoring Device Market Revenue (Million) Forecast, by Application 2020 & 2033
- Table 38: Italy Air Quality Monitoring Device Market Volume (K Units) Forecast, by Application 2020 & 2033
- Table 39: Global Air Quality Monitoring Device Market Revenue Million Forecast, by Product Type 2020 & 2033
- Table 40: Global Air Quality Monitoring Device Market Volume K Units Forecast, by Product Type 2020 & 2033
- Table 41: Global Air Quality Monitoring Device Market Revenue Million Forecast, by Sampling Method 2020 & 2033
- Table 42: Global Air Quality Monitoring Device Market Volume K Units Forecast, by Sampling Method 2020 & 2033
- Table 43: Global Air Quality Monitoring Device Market Revenue Million Forecast, by End User 2020 & 2033
- Table 44: Global Air Quality Monitoring Device Market Volume K Units Forecast, by End User 2020 & 2033
- Table 45: Global Air Quality Monitoring Device Market Revenue Million Forecast, by Country 2020 & 2033
- Table 46: Global Air Quality Monitoring Device Market Volume K Units Forecast, by Country 2020 & 2033
- Table 47: China Air Quality Monitoring Device Market Revenue (Million) Forecast, by Application 2020 & 2033
- Table 48: China Air Quality Monitoring Device Market Volume (K Units) Forecast, by Application 2020 & 2033
- Table 49: Japan Air Quality Monitoring Device Market Revenue (Million) Forecast, by Application 2020 & 2033
- Table 50: Japan Air Quality Monitoring Device Market Volume (K Units) Forecast, by Application 2020 & 2033
- Table 51: Vietnam Air Quality Monitoring Device Market Revenue (Million) Forecast, by Application 2020 & 2033
- Table 52: Vietnam Air Quality Monitoring Device Market Volume (K Units) Forecast, by Application 2020 & 2033
- Table 53: India Air Quality Monitoring Device Market Revenue (Million) Forecast, by Application 2020 & 2033
- Table 54: India Air Quality Monitoring Device Market Volume (K Units) Forecast, by Application 2020 & 2033
- Table 55: Australia and New Zealand Air Quality Monitoring Device Market Revenue (Million) Forecast, by Application 2020 & 2033
- Table 56: Australia and New Zealand Air Quality Monitoring Device Market Volume (K Units) Forecast, by Application 2020 & 2033
- Table 57: Global Air Quality Monitoring Device Market Revenue Million Forecast, by Product Type 2020 & 2033
- Table 58: Global Air Quality Monitoring Device Market Volume K Units Forecast, by Product Type 2020 & 2033
- Table 59: Global Air Quality Monitoring Device Market Revenue Million Forecast, by Sampling Method 2020 & 2033
- Table 60: Global Air Quality Monitoring Device Market Volume K Units Forecast, by Sampling Method 2020 & 2033
- Table 61: Global Air Quality Monitoring Device Market Revenue Million Forecast, by End User 2020 & 2033
- Table 62: Global Air Quality Monitoring Device Market Volume K Units Forecast, by End User 2020 & 2033
- Table 63: Global Air Quality Monitoring Device Market Revenue Million Forecast, by Country 2020 & 2033
- Table 64: Global Air Quality Monitoring Device Market Volume K Units Forecast, by Country 2020 & 2033
- Table 65: Brazil Air Quality Monitoring Device Market Revenue (Million) Forecast, by Application 2020 & 2033
- Table 66: Brazil Air Quality Monitoring Device Market Volume (K Units) Forecast, by Application 2020 & 2033
- Table 67: Argentina Air Quality Monitoring Device Market Revenue (Million) Forecast, by Application 2020 & 2033
- Table 68: Argentina Air Quality Monitoring Device Market Volume (K Units) Forecast, by Application 2020 & 2033
- Table 69: Global Air Quality Monitoring Device Market Revenue Million Forecast, by Product Type 2020 & 2033
- Table 70: Global Air Quality Monitoring Device Market Volume K Units Forecast, by Product Type 2020 & 2033
- Table 71: Global Air Quality Monitoring Device Market Revenue Million Forecast, by Sampling Method 2020 & 2033
- Table 72: Global Air Quality Monitoring Device Market Volume K Units Forecast, by Sampling Method 2020 & 2033
- Table 73: Global Air Quality Monitoring Device Market Revenue Million Forecast, by End User 2020 & 2033
- Table 74: Global Air Quality Monitoring Device Market Volume K Units Forecast, by End User 2020 & 2033
- Table 75: Global Air Quality Monitoring Device Market Revenue Million Forecast, by Country 2020 & 2033
- Table 76: Global Air Quality Monitoring Device Market Volume K Units Forecast, by Country 2020 & 2033
- Table 77: United Arab Emirates Air Quality Monitoring Device Market Revenue (Million) Forecast, by Application 2020 & 2033
- Table 78: United Arab Emirates Air Quality Monitoring Device Market Volume (K Units) Forecast, by Application 2020 & 2033
- Table 79: South Africa Air Quality Monitoring Device Market Revenue (Million) Forecast, by Application 2020 & 2033
- Table 80: South Africa Air Quality Monitoring Device Market Volume (K Units) Forecast, by Application 2020 & 2033
- Table 81: Saudi Arabia Air Quality Monitoring Device Market Revenue (Million) Forecast, by Application 2020 & 2033
- Table 82: Saudi Arabia Air Quality Monitoring Device Market Volume (K Units) Forecast, by Application 2020 & 2033
- Table 83: Iraq Air Quality Monitoring Device Market Revenue (Million) Forecast, by Application 2020 & 2033
- Table 84: Iraq Air Quality Monitoring Device Market Volume (K Units) Forecast, by Application 2020 & 2033
Frequently Asked Questions
1. What is the projected Compound Annual Growth Rate (CAGR) of the Air Quality Monitoring Device Market?
The projected CAGR is approximately 5.79%.
2. Which companies are prominent players in the Air Quality Monitoring Device Market?
Key companies in the market include Honeywell International Inc, MicroJet Technology Co Ltd, Horiba Ltd, Merck KGaA, TSI Inc, Thermo Fisher Scientific Inc, Hawa Dawa GmbH, Emerson Electric Co, Siemens AG, Agilent Technologies Inc, 3M Co, Teledyne Technologies Inc.
3. What are the main segments of the Air Quality Monitoring Device Market?
The market segments include Product Type, Sampling Method, End User.
4. Can you provide details about the market size?
The market size is estimated to be USD 5.08 Million as of 2022.
5. What are some drivers contributing to market growth?
4.; Supportive Government Policies to Regulate Air Pollution4.; Expansion of Industrialization Across the World.
6. What are the notable trends driving market growth?
The Outdoor Monitor Segment is Expected to be the Fastest-growing Segment.
7. Are there any restraints impacting market growth?
4.; The Penetration of Cleaner Energy Sources Like Renewables and Nuclear Power.
8. Can you provide examples of recent developments in the market?
In March 2023, Tyndall participated in a new European project aiming to improve air quality monitoring. It is a group member that has received EC (European Commission) funds to research air quality monitoring. The Tyndall National Institute for Research and Development in Microtechnologies (IMT) in Bucharest will lead the initiative, which will benefit from the experience of research institutions in Ireland and Italy.
9. What pricing options are available for accessing the report?
Pricing options include single-user, multi-user, and enterprise licenses priced at USD 4750, USD 5250, and USD 8750 respectively.
10. Is the market size provided in terms of value or volume?
The market size is provided in terms of value, measured in Million and volume, measured in K Units.
11. Are there any specific market keywords associated with the report?
Yes, the market keyword associated with the report is "Air Quality Monitoring Device Market," which aids in identifying and referencing the specific market segment covered.
12. How do I determine which pricing option suits my needs best?
The pricing options vary based on user requirements and access needs. Individual users may opt for single-user licenses, while businesses requiring broader access may choose multi-user or enterprise licenses for cost-effective access to the report.
13. Are there any additional resources or data provided in the Air Quality Monitoring Device Market report?
While the report offers comprehensive insights, it's advisable to review the specific contents or supplementary materials provided to ascertain if additional resources or data are available.
14. How can I stay updated on further developments or reports in the Air Quality Monitoring Device Market?
To stay informed about further developments, trends, and reports in the Air Quality Monitoring Device Market, consider subscribing to industry newsletters, following relevant companies and organizations, or regularly checking reputable industry news sources and publications.
Methodology
Step 1 - Identification of Relevant Samples Size from Population Database


Step 2 - Approaches for Defining Global Market Size (Value, Volume* & Price*)

Note*: In applicable scenarios
Step 3 - Data Sources
Primary Research
- Web Analytics
- Survey Reports
- Research Institute
- Latest Research Reports
- Opinion Leaders
Secondary Research
- Annual Reports
- White Paper
- Latest Press Release
- Industry Association
- Paid Database
- Investor Presentations

Step 4 - Data Triangulation
Involves using different sources of information in order to increase the validity of a study
These sources are likely to be stakeholders in a program - participants, other researchers, program staff, other community members, and so on.
Then we put all data in single framework & apply various statistical tools to find out the dynamic on the market.
During the analysis stage, feedback from the stakeholder groups would be compared to determine areas of agreement as well as areas of divergence