

Key Insights
The Asia-Pacific (APAC) biofertilizers market is experiencing robust growth, driven by increasing demand for sustainable agricultural practices and a rising global population requiring enhanced food production. The market's Compound Annual Growth Rate (CAGR) of 10.80% from 2019-2033 indicates significant expansion potential. Several factors contribute to this growth. Firstly, the region's large agricultural sector, particularly in countries like India, China, and Indonesia, creates a substantial market for biofertilizers as farmers seek alternatives to chemical fertilizers to improve soil health and crop yields. Secondly, government initiatives promoting sustainable agriculture and reducing reliance on chemical inputs further stimulate demand. This includes subsidies, awareness campaigns, and supportive policies aimed at promoting environmentally friendly farming methods. Thirdly, the growing awareness among farmers about the benefits of biofertilizers, such as improved nutrient uptake, enhanced crop resilience, and reduced environmental impact, is driving adoption. The segment encompassing grains & cereals, pulses & oilseeds, and commercial crops is expected to dominate the APAC market due to the high consumption of these crops in the region and the increasing need for efficient and sustainable fertilization. However, challenges remain, including the relatively high cost of some biofertilizers compared to chemical alternatives and a lack of awareness among some farming communities about their effectiveness. Despite these challenges, the long-term outlook for the APAC biofertilizer market remains positive, with continued growth fueled by technological advancements, expanding agricultural land, and increasing governmental support.
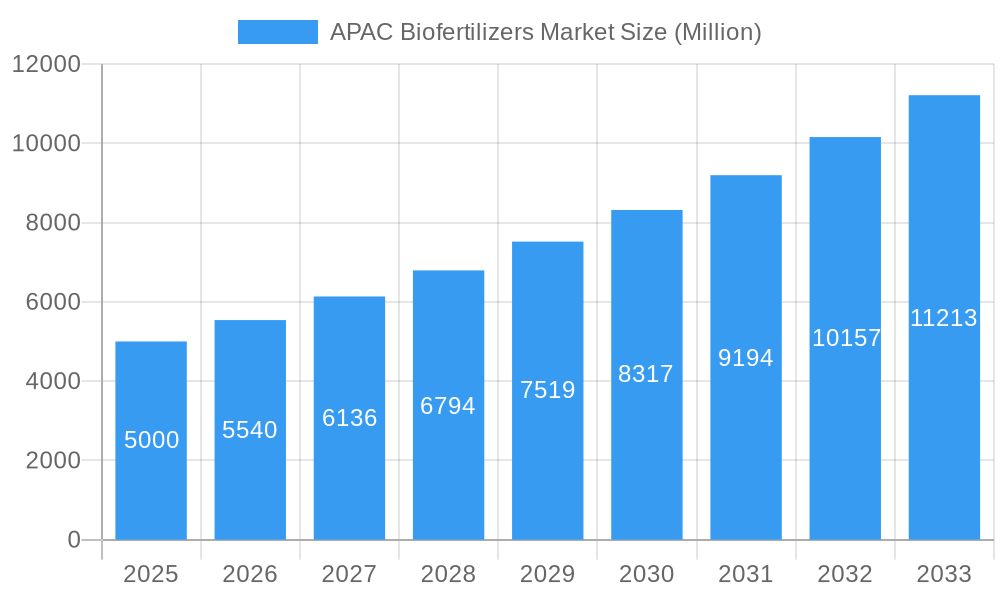
APAC Biofertilizers Market Market Size (In Billion)
The market segmentation within APAC shows a diverse landscape. While Rhizobium, Azospirillum, and Phosphate Solubilizing Bacteria are currently popular choices, the growing awareness of the benefits of Mycorrhiza and other microorganisms is anticipated to boost their market share. The increasing adoption of precision agriculture techniques further supports this trend, as targeted applications of biofertilizers can optimize their effectiveness. Regional variations exist within APAC. India and China, with their extensive agricultural lands and large populations, are expected to dominate the market, while other nations like South Korea, Japan, and Australia contribute significantly. The competitive landscape features a mix of international and domestic players, each vying for market share through research and development, product innovation, and strategic partnerships. The presence of both large multinational corporations and smaller, specialized firms creates a dynamic and competitive environment.
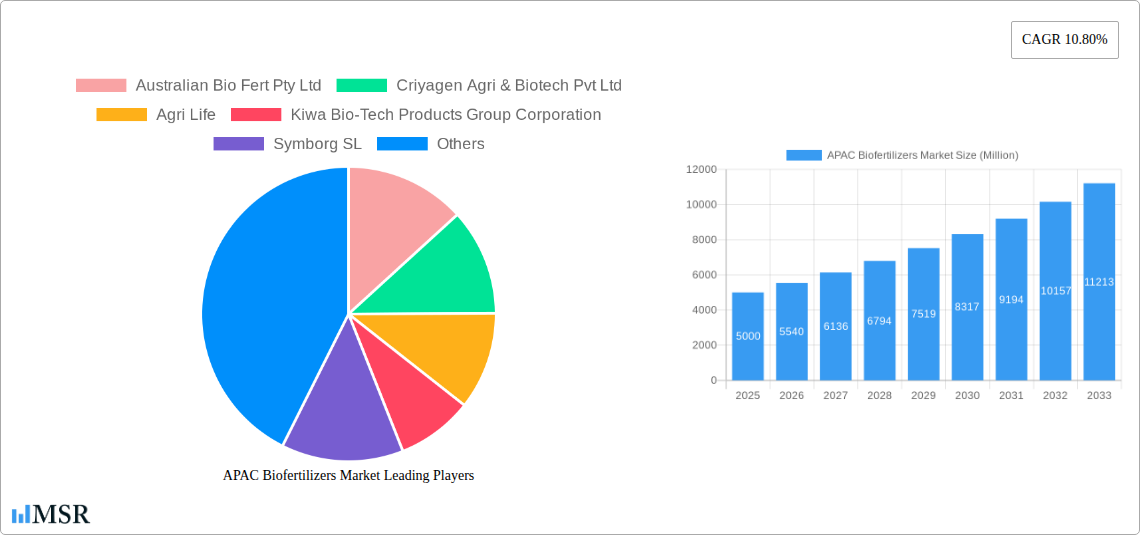
APAC Biofertilizers Market Company Market Share
APAC Biofertilizers Market: A Comprehensive Report (2019-2033)
This comprehensive report provides an in-depth analysis of the Asia-Pacific Biofertilizers market, offering invaluable insights for stakeholders, investors, and industry professionals. Covering the period from 2019 to 2033, with a focus on 2025, this report meticulously examines market dynamics, leading segments, key players, and future growth opportunities. The market is segmented by Microorganism (Rhizobium, Azospirillum, Azotobacter, Blue-Green Algae, Phosphate Solubilizing Bacteria, Mycorrhiza, Other Microorganisms) and Application (Grains & Cereals, Pulses & Oilseeds, Commercial Crops, Fruits & Vegetables, Other Applications).
APAC Biofertilizers Market Concentration & Dynamics
The APAC biofertilizers market exhibits a moderately concentrated landscape, with several key players vying for market share. Market concentration is influenced by factors such as R&D investments, technological advancements, and strategic mergers and acquisitions (M&A). The study period (2019-2024) saw approximately xx M&A deals, contributing to market consolidation. Key players like Australian Bio Fert Pty Ltd, Criyagen Agri & Biotech Pvt Ltd, and Symborg SL hold significant market shares, estimated at xx%, xx%, and xx% respectively in 2025. However, the market also features numerous smaller players, particularly in niche segments. Regulatory frameworks vary across APAC nations, impacting market entry and product approvals. The market experiences competitive pressure from traditional chemical fertilizers, yet the growing awareness of sustainable agriculture fuels the demand for biofertilizers. End-user trends point toward a preference for eco-friendly and cost-effective solutions, driving the adoption of biofertilizers across various agricultural applications.
APAC Biofertilizers Market Industry Insights & Trends
The APAC biofertilizers market is experiencing robust growth, with a projected CAGR of xx% during the forecast period (2025-2033). The market size is estimated at $xx Million in 2025 and is expected to reach $xx Million by 2033. This growth is driven by several factors, including rising demand for sustainable agriculture practices, stringent government regulations promoting eco-friendly farming, and increasing awareness among farmers about the benefits of biofertilizers compared to chemical fertilizers. Technological advancements in biofertilizer production and formulation, along with the introduction of innovative products tailored to specific crop needs, further fuel market expansion. Evolving consumer preferences toward organically grown food products have also created a positive ripple effect, boosting the demand for biofertilizers. The rising disposable incomes in several APAC countries further contribute to this growth trajectory.
Key Markets & Segments Leading APAC Biofertilizers Market
Dominant Regions/Segments: India and China are projected to lead the APAC biofertilizer market in 2025, accounting for a combined xx% market share. The Grains & Cereals segment dominates the application sector, driven by high crop cultivation across the region. Among microorganisms, Phosphate Solubilizing Bacteria and Rhizobium are the leading segments, due to their effectiveness in enhancing nutrient uptake by plants.
Growth Drivers:
- Economic Growth: Rising disposable incomes in many APAC countries lead to increased agricultural investment.
- Government Support: Government initiatives promoting sustainable agriculture and organic farming enhance biofertilizer adoption.
- Technological Advancements: Innovations in biofertilizer production and application methods improve efficiency and efficacy.
- Growing Awareness: Increasing farmer awareness about the benefits of biofertilizers over chemical fertilizers stimulates market expansion.
APAC Biofertilizers Market Product Developments
Recent years have witnessed significant product innovations in the APAC biofertilizers market. Companies are developing advanced formulations with enhanced nutrient delivery systems and improved shelf life. These innovations provide competitive advantages and cater to specific crop requirements. The focus on developing biofertilizers that address specific soil and crop limitations has driven product diversification. The integration of biotechnology and nanotechnology in biofertilizer production is creating novel products with improved efficiency and efficacy.
Challenges in the APAC Biofertilizers Market Market
The APAC biofertilizers market faces certain challenges. These include inconsistent product quality, lack of standardized quality control measures, and high production costs impacting affordability. Regulatory hurdles and complex approval processes in some countries pose significant barriers to market entry. Supply chain inefficiencies and inadequate storage and distribution infrastructure also impact the market's growth.
Forces Driving APAC Biofertilizers Market Growth
The APAC biofertilizers market is experiencing a surge driven by several key factors. These include increasing government support for sustainable agriculture practices, growing consumer demand for organically produced food, and rising awareness among farmers regarding the benefits of biofertilizers. Technological advancements in biofertilizer formulations and delivery systems are further contributing to market growth. Stringent environmental regulations that discourage the use of chemical fertilizers also propel the market forward.
Long-Term Growth Catalysts in the APAC Biofertilizers Market
Long-term growth hinges on ongoing R&D in biofertilizer technology, creating products with enhanced efficacy and cost-effectiveness. Strategic partnerships between biofertilizer producers and agricultural companies will expand market reach and create more integrated solutions for farmers. The expansion of biofertilizer applications into new agricultural sectors and geographies will also create significant opportunities for growth.
Emerging Opportunities in APAC Biofertilizers Market
Emerging opportunities lie in the development of specialized biofertilizers for specific crops and soil conditions. The increasing demand for organic and sustainable farming practices presents lucrative avenues. Exploring new market segments like hydroponics and vertical farming offers exciting potential for growth. The integration of digital technologies and data analytics into biofertilizer application and monitoring will optimize their use and yield.
Leading Players in the APAC Biofertilizers Market Sector
- Australian Bio Fert Pty Ltd
- Criyagen Agri & Biotech Pvt Ltd
- Agri Life
- Kiwa Bio-Tech Products Group Corporation
- Symborg SL
- CBF China Biofertilizers AG
- Biomax Naturals
- Agrinos AS
- BioAg Pty Ltd
- Camson Biotechnologies Limited
- National Fertilizer Ltd
Key Milestones in APAC Biofertilizers Market Industry
- 2020: Introduction of a new nitrogen-fixing biofertilizer by Symborg SL.
- 2021: Government of India launches a subsidy program for biofertilizer adoption.
- 2022: Major merger between two leading biofertilizer companies in China.
- 2023: Launch of a novel phosphorus solubilizing biofertilizer by Australian Bio Fert Pty Ltd.
- 2024: Several key players invest heavily in R&D to develop next-generation biofertilizers.
Strategic Outlook for APAC Biofertilizers Market Market
The future of the APAC biofertilizers market is bright. Continued innovation in biofertilizer technology, coupled with supportive government policies and increasing farmer awareness, will drive significant growth in the coming years. Strategic alliances and market expansion into new regions will be crucial for companies to capitalize on this lucrative opportunity. The market is poised for substantial growth, presenting significant opportunities for both established players and new entrants alike.
APAC Biofertilizers Market Segmentation
- 1. Production Analysis
- 2. Consumption Analysis
- 3. Import Market Analysis (Value & Volume)
- 4. Export Market Analysis (Value & Volume)
- 5. Price Trend Analysis
APAC Biofertilizers Market Segmentation By Geography
-
1. North America
- 1.1. United States
- 1.2. Canada
- 1.3. Mexico
-
2. South America
- 2.1. Brazil
- 2.2. Argentina
- 2.3. Rest of South America
-
3. Europe
- 3.1. United Kingdom
- 3.2. Germany
- 3.3. France
- 3.4. Italy
- 3.5. Spain
- 3.6. Russia
- 3.7. Benelux
- 3.8. Nordics
- 3.9. Rest of Europe
-
4. Middle East & Africa
- 4.1. Turkey
- 4.2. Israel
- 4.3. GCC
- 4.4. North Africa
- 4.5. South Africa
- 4.6. Rest of Middle East & Africa
-
5. Asia Pacific
- 5.1. China
- 5.2. India
- 5.3. Japan
- 5.4. South Korea
- 5.5. ASEAN
- 5.6. Oceania
- 5.7. Rest of Asia Pacific
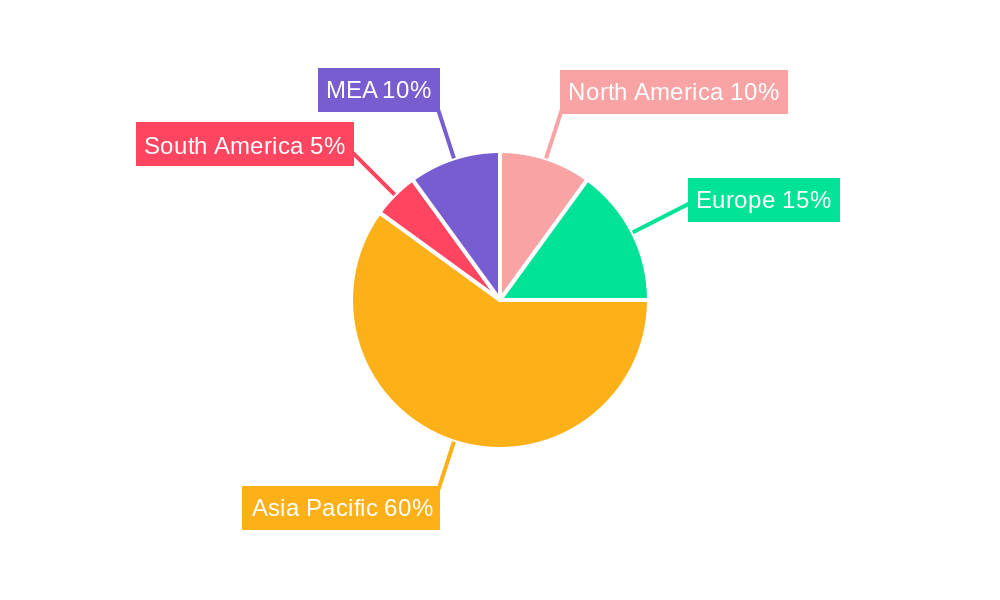
APAC Biofertilizers Market Regional Market Share
Geographic Coverage of APAC Biofertilizers Market
APAC Biofertilizers Market REPORT HIGHLIGHTS
| Aspects | Details |
|---|---|
| Study Period | 2020-2034 |
| Base Year | 2025 |
| Estimated Year | 2026 |
| Forecast Period | 2026-2034 |
| Historical Period | 2020-2025 |
| Growth Rate | CAGR of 13.6% from 2020-2034 |
| Segmentation |
|
Table of Contents
- 1. Introduction
- 1.1. Research Scope
- 1.2. Market Segmentation
- 1.3. Research Objective
- 1.4. Definitions and Assumptions
- 2. Executive Summary
- 2.1. Market Snapshot
- 3. Market Dynamics
- 3.1. Market Drivers
- 3.2. Market Restrains
- 3.3. Market Trends
- 3.4. Market Opportunities
- 4. Market Factor Analysis
- 4.1. Porters Five Forces
- 4.1.1. Bargaining Power of Suppliers
- 4.1.2. Bargaining Power of Buyers
- 4.1.3. Threat of New Entrants
- 4.1.4. Threat of Substitutes
- 4.1.5. Competitive Rivalry
- 4.2. PESTEL analysis
- 4.3. BCG Analysis
- 4.3.1. Stars (High Growth, High Market Share)
- 4.3.2. Cash Cows (Low Growth, High Market Share)
- 4.3.3. Question Mark (High Growth, Low Market Share)
- 4.3.4. Dogs (Low Growth, Low Market Share)
- 4.4. Ansoff Matrix Analysis
- 4.5. Supply Chain Analysis
- 4.6. Regulatory Landscape
- 4.7. Current Market Potential and Opportunity Assessment (TAM–SAM–SOM Framework)
- 4.8. MSR Analyst Note
- 4.1. Porters Five Forces
- 5. Market Analysis, Insights and Forecast 2021-2033
- 5.1. Market Analysis, Insights and Forecast - by Production Analysis
- 5.2. Market Analysis, Insights and Forecast - by Consumption Analysis
- 5.3. Market Analysis, Insights and Forecast - by Import Market Analysis (Value & Volume)
- 5.4. Market Analysis, Insights and Forecast - by Export Market Analysis (Value & Volume)
- 5.5. Market Analysis, Insights and Forecast - by Price Trend Analysis
- 5.6. Market Analysis, Insights and Forecast - by Region
- 5.6.1. North America
- 5.6.2. South America
- 5.6.3. Europe
- 5.6.4. Middle East & Africa
- 5.6.5. Asia Pacific
- 6. Global APAC Biofertilizers Market Analysis, Insights and Forecast, 2021-2033
- 6.1. Market Analysis, Insights and Forecast - by Production Analysis
- 6.2. Market Analysis, Insights and Forecast - by Consumption Analysis
- 6.3. Market Analysis, Insights and Forecast - by Import Market Analysis (Value & Volume)
- 6.4. Market Analysis, Insights and Forecast - by Export Market Analysis (Value & Volume)
- 6.5. Market Analysis, Insights and Forecast - by Price Trend Analysis
- 7. North America APAC Biofertilizers Market Analysis, Insights and Forecast, 2020-2032
- 7.1. Market Analysis, Insights and Forecast - by Production Analysis
- 7.2. Market Analysis, Insights and Forecast - by Consumption Analysis
- 7.3. Market Analysis, Insights and Forecast - by Import Market Analysis (Value & Volume)
- 7.4. Market Analysis, Insights and Forecast - by Export Market Analysis (Value & Volume)
- 7.5. Market Analysis, Insights and Forecast - by Price Trend Analysis
- 8. South America APAC Biofertilizers Market Analysis, Insights and Forecast, 2020-2032
- 8.1. Market Analysis, Insights and Forecast - by Production Analysis
- 8.2. Market Analysis, Insights and Forecast - by Consumption Analysis
- 8.3. Market Analysis, Insights and Forecast - by Import Market Analysis (Value & Volume)
- 8.4. Market Analysis, Insights and Forecast - by Export Market Analysis (Value & Volume)
- 8.5. Market Analysis, Insights and Forecast - by Price Trend Analysis
- 9. Europe APAC Biofertilizers Market Analysis, Insights and Forecast, 2020-2032
- 9.1. Market Analysis, Insights and Forecast - by Production Analysis
- 9.2. Market Analysis, Insights and Forecast - by Consumption Analysis
- 9.3. Market Analysis, Insights and Forecast - by Import Market Analysis (Value & Volume)
- 9.4. Market Analysis, Insights and Forecast - by Export Market Analysis (Value & Volume)
- 9.5. Market Analysis, Insights and Forecast - by Price Trend Analysis
- 10. Middle East & Africa APAC Biofertilizers Market Analysis, Insights and Forecast, 2020-2032
- 10.1. Market Analysis, Insights and Forecast - by Production Analysis
- 10.2. Market Analysis, Insights and Forecast - by Consumption Analysis
- 10.3. Market Analysis, Insights and Forecast - by Import Market Analysis (Value & Volume)
- 10.4. Market Analysis, Insights and Forecast - by Export Market Analysis (Value & Volume)
- 10.5. Market Analysis, Insights and Forecast - by Price Trend Analysis
- 11. Asia Pacific APAC Biofertilizers Market Analysis, Insights and Forecast, 2020-2032
- 11.1. Market Analysis, Insights and Forecast - by Production Analysis
- 11.2. Market Analysis, Insights and Forecast - by Consumption Analysis
- 11.3. Market Analysis, Insights and Forecast - by Import Market Analysis (Value & Volume)
- 11.4. Market Analysis, Insights and Forecast - by Export Market Analysis (Value & Volume)
- 11.5. Market Analysis, Insights and Forecast - by Price Trend Analysis
- 12. Competitive Analysis
- 12.1. Company Profiles
- 12.1.1 Australian Bio Fert Pty Ltd
- 12.1.1.1. Company Overview
- 12.1.1.2. Products
- 12.1.1.3. Company Financials
- 12.1.1.4. SWOT Analysis
- 12.1.2 Criyagen Agri & Biotech Pvt Ltd
- 12.1.2.1. Company Overview
- 12.1.2.2. Products
- 12.1.2.3. Company Financials
- 12.1.2.4. SWOT Analysis
- 12.1.3 Agri Life
- 12.1.3.1. Company Overview
- 12.1.3.2. Products
- 12.1.3.3. Company Financials
- 12.1.3.4. SWOT Analysis
- 12.1.4 Kiwa Bio-Tech Products Group Corporation
- 12.1.4.1. Company Overview
- 12.1.4.2. Products
- 12.1.4.3. Company Financials
- 12.1.4.4. SWOT Analysis
- 12.1.5 Symborg SL
- 12.1.5.1. Company Overview
- 12.1.5.2. Products
- 12.1.5.3. Company Financials
- 12.1.5.4. SWOT Analysis
- 12.1.6 CBF China Biofertilizers AG
- 12.1.6.1. Company Overview
- 12.1.6.2. Products
- 12.1.6.3. Company Financials
- 12.1.6.4. SWOT Analysis
- 12.1.7 Biomax Naturals
- 12.1.7.1. Company Overview
- 12.1.7.2. Products
- 12.1.7.3. Company Financials
- 12.1.7.4. SWOT Analysis
- 12.1.8 Agrinos AS
- 12.1.8.1. Company Overview
- 12.1.8.2. Products
- 12.1.8.3. Company Financials
- 12.1.8.4. SWOT Analysis
- 12.1.9 BioAg Pty Ltd
- 12.1.9.1. Company Overview
- 12.1.9.2. Products
- 12.1.9.3. Company Financials
- 12.1.9.4. SWOT Analysis
- 12.1.10 Camson Biotechnologies Limited
- 12.1.10.1. Company Overview
- 12.1.10.2. Products
- 12.1.10.3. Company Financials
- 12.1.10.4. SWOT Analysis
- 12.1.11 National Fertilizer Ltd
- 12.1.11.1. Company Overview
- 12.1.11.2. Products
- 12.1.11.3. Company Financials
- 12.1.11.4. SWOT Analysis
- 12.1.1 Australian Bio Fert Pty Ltd
- 12.2. Market Entropy
- 12.2.1 Company's Key Areas Served
- 12.2.2 Recent Developments
- 12.3. Company Market Share Analysis 2025
- 12.3.1 Top 5 Companies Market Share Analysis
- 12.3.2 Top 3 Companies Market Share Analysis
- 12.4. List of Potential Customers
- 13. Research Methodology
List of Figures
- Figure 1: Global APAC Biofertilizers Market Revenue Breakdown (undefined, %) by Region 2025 & 2033
- Figure 2: Global APAC Biofertilizers Market Volume Breakdown (Kiloton, %) by Region 2025 & 2033
- Figure 3: North America APAC Biofertilizers Market Revenue (undefined), by Production Analysis 2025 & 2033
- Figure 4: North America APAC Biofertilizers Market Volume (Kiloton), by Production Analysis 2025 & 2033
- Figure 5: North America APAC Biofertilizers Market Revenue Share (%), by Production Analysis 2025 & 2033
- Figure 6: North America APAC Biofertilizers Market Volume Share (%), by Production Analysis 2025 & 2033
- Figure 7: North America APAC Biofertilizers Market Revenue (undefined), by Consumption Analysis 2025 & 2033
- Figure 8: North America APAC Biofertilizers Market Volume (Kiloton), by Consumption Analysis 2025 & 2033
- Figure 9: North America APAC Biofertilizers Market Revenue Share (%), by Consumption Analysis 2025 & 2033
- Figure 10: North America APAC Biofertilizers Market Volume Share (%), by Consumption Analysis 2025 & 2033
- Figure 11: North America APAC Biofertilizers Market Revenue (undefined), by Import Market Analysis (Value & Volume) 2025 & 2033
- Figure 12: North America APAC Biofertilizers Market Volume (Kiloton), by Import Market Analysis (Value & Volume) 2025 & 2033
- Figure 13: North America APAC Biofertilizers Market Revenue Share (%), by Import Market Analysis (Value & Volume) 2025 & 2033
- Figure 14: North America APAC Biofertilizers Market Volume Share (%), by Import Market Analysis (Value & Volume) 2025 & 2033
- Figure 15: North America APAC Biofertilizers Market Revenue (undefined), by Export Market Analysis (Value & Volume) 2025 & 2033
- Figure 16: North America APAC Biofertilizers Market Volume (Kiloton), by Export Market Analysis (Value & Volume) 2025 & 2033
- Figure 17: North America APAC Biofertilizers Market Revenue Share (%), by Export Market Analysis (Value & Volume) 2025 & 2033
- Figure 18: North America APAC Biofertilizers Market Volume Share (%), by Export Market Analysis (Value & Volume) 2025 & 2033
- Figure 19: North America APAC Biofertilizers Market Revenue (undefined), by Price Trend Analysis 2025 & 2033
- Figure 20: North America APAC Biofertilizers Market Volume (Kiloton), by Price Trend Analysis 2025 & 2033
- Figure 21: North America APAC Biofertilizers Market Revenue Share (%), by Price Trend Analysis 2025 & 2033
- Figure 22: North America APAC Biofertilizers Market Volume Share (%), by Price Trend Analysis 2025 & 2033
- Figure 23: North America APAC Biofertilizers Market Revenue (undefined), by Country 2025 & 2033
- Figure 24: North America APAC Biofertilizers Market Volume (Kiloton), by Country 2025 & 2033
- Figure 25: North America APAC Biofertilizers Market Revenue Share (%), by Country 2025 & 2033
- Figure 26: North America APAC Biofertilizers Market Volume Share (%), by Country 2025 & 2033
- Figure 27: South America APAC Biofertilizers Market Revenue (undefined), by Production Analysis 2025 & 2033
- Figure 28: South America APAC Biofertilizers Market Volume (Kiloton), by Production Analysis 2025 & 2033
- Figure 29: South America APAC Biofertilizers Market Revenue Share (%), by Production Analysis 2025 & 2033
- Figure 30: South America APAC Biofertilizers Market Volume Share (%), by Production Analysis 2025 & 2033
- Figure 31: South America APAC Biofertilizers Market Revenue (undefined), by Consumption Analysis 2025 & 2033
- Figure 32: South America APAC Biofertilizers Market Volume (Kiloton), by Consumption Analysis 2025 & 2033
- Figure 33: South America APAC Biofertilizers Market Revenue Share (%), by Consumption Analysis 2025 & 2033
- Figure 34: South America APAC Biofertilizers Market Volume Share (%), by Consumption Analysis 2025 & 2033
- Figure 35: South America APAC Biofertilizers Market Revenue (undefined), by Import Market Analysis (Value & Volume) 2025 & 2033
- Figure 36: South America APAC Biofertilizers Market Volume (Kiloton), by Import Market Analysis (Value & Volume) 2025 & 2033
- Figure 37: South America APAC Biofertilizers Market Revenue Share (%), by Import Market Analysis (Value & Volume) 2025 & 2033
- Figure 38: South America APAC Biofertilizers Market Volume Share (%), by Import Market Analysis (Value & Volume) 2025 & 2033
- Figure 39: South America APAC Biofertilizers Market Revenue (undefined), by Export Market Analysis (Value & Volume) 2025 & 2033
- Figure 40: South America APAC Biofertilizers Market Volume (Kiloton), by Export Market Analysis (Value & Volume) 2025 & 2033
- Figure 41: South America APAC Biofertilizers Market Revenue Share (%), by Export Market Analysis (Value & Volume) 2025 & 2033
- Figure 42: South America APAC Biofertilizers Market Volume Share (%), by Export Market Analysis (Value & Volume) 2025 & 2033
- Figure 43: South America APAC Biofertilizers Market Revenue (undefined), by Price Trend Analysis 2025 & 2033
- Figure 44: South America APAC Biofertilizers Market Volume (Kiloton), by Price Trend Analysis 2025 & 2033
- Figure 45: South America APAC Biofertilizers Market Revenue Share (%), by Price Trend Analysis 2025 & 2033
- Figure 46: South America APAC Biofertilizers Market Volume Share (%), by Price Trend Analysis 2025 & 2033
- Figure 47: South America APAC Biofertilizers Market Revenue (undefined), by Country 2025 & 2033
- Figure 48: South America APAC Biofertilizers Market Volume (Kiloton), by Country 2025 & 2033
- Figure 49: South America APAC Biofertilizers Market Revenue Share (%), by Country 2025 & 2033
- Figure 50: South America APAC Biofertilizers Market Volume Share (%), by Country 2025 & 2033
- Figure 51: Europe APAC Biofertilizers Market Revenue (undefined), by Production Analysis 2025 & 2033
- Figure 52: Europe APAC Biofertilizers Market Volume (Kiloton), by Production Analysis 2025 & 2033
- Figure 53: Europe APAC Biofertilizers Market Revenue Share (%), by Production Analysis 2025 & 2033
- Figure 54: Europe APAC Biofertilizers Market Volume Share (%), by Production Analysis 2025 & 2033
- Figure 55: Europe APAC Biofertilizers Market Revenue (undefined), by Consumption Analysis 2025 & 2033
- Figure 56: Europe APAC Biofertilizers Market Volume (Kiloton), by Consumption Analysis 2025 & 2033
- Figure 57: Europe APAC Biofertilizers Market Revenue Share (%), by Consumption Analysis 2025 & 2033
- Figure 58: Europe APAC Biofertilizers Market Volume Share (%), by Consumption Analysis 2025 & 2033
- Figure 59: Europe APAC Biofertilizers Market Revenue (undefined), by Import Market Analysis (Value & Volume) 2025 & 2033
- Figure 60: Europe APAC Biofertilizers Market Volume (Kiloton), by Import Market Analysis (Value & Volume) 2025 & 2033
- Figure 61: Europe APAC Biofertilizers Market Revenue Share (%), by Import Market Analysis (Value & Volume) 2025 & 2033
- Figure 62: Europe APAC Biofertilizers Market Volume Share (%), by Import Market Analysis (Value & Volume) 2025 & 2033
- Figure 63: Europe APAC Biofertilizers Market Revenue (undefined), by Export Market Analysis (Value & Volume) 2025 & 2033
- Figure 64: Europe APAC Biofertilizers Market Volume (Kiloton), by Export Market Analysis (Value & Volume) 2025 & 2033
- Figure 65: Europe APAC Biofertilizers Market Revenue Share (%), by Export Market Analysis (Value & Volume) 2025 & 2033
- Figure 66: Europe APAC Biofertilizers Market Volume Share (%), by Export Market Analysis (Value & Volume) 2025 & 2033
- Figure 67: Europe APAC Biofertilizers Market Revenue (undefined), by Price Trend Analysis 2025 & 2033
- Figure 68: Europe APAC Biofertilizers Market Volume (Kiloton), by Price Trend Analysis 2025 & 2033
- Figure 69: Europe APAC Biofertilizers Market Revenue Share (%), by Price Trend Analysis 2025 & 2033
- Figure 70: Europe APAC Biofertilizers Market Volume Share (%), by Price Trend Analysis 2025 & 2033
- Figure 71: Europe APAC Biofertilizers Market Revenue (undefined), by Country 2025 & 2033
- Figure 72: Europe APAC Biofertilizers Market Volume (Kiloton), by Country 2025 & 2033
- Figure 73: Europe APAC Biofertilizers Market Revenue Share (%), by Country 2025 & 2033
- Figure 74: Europe APAC Biofertilizers Market Volume Share (%), by Country 2025 & 2033
- Figure 75: Middle East & Africa APAC Biofertilizers Market Revenue (undefined), by Production Analysis 2025 & 2033
- Figure 76: Middle East & Africa APAC Biofertilizers Market Volume (Kiloton), by Production Analysis 2025 & 2033
- Figure 77: Middle East & Africa APAC Biofertilizers Market Revenue Share (%), by Production Analysis 2025 & 2033
- Figure 78: Middle East & Africa APAC Biofertilizers Market Volume Share (%), by Production Analysis 2025 & 2033
- Figure 79: Middle East & Africa APAC Biofertilizers Market Revenue (undefined), by Consumption Analysis 2025 & 2033
- Figure 80: Middle East & Africa APAC Biofertilizers Market Volume (Kiloton), by Consumption Analysis 2025 & 2033
- Figure 81: Middle East & Africa APAC Biofertilizers Market Revenue Share (%), by Consumption Analysis 2025 & 2033
- Figure 82: Middle East & Africa APAC Biofertilizers Market Volume Share (%), by Consumption Analysis 2025 & 2033
- Figure 83: Middle East & Africa APAC Biofertilizers Market Revenue (undefined), by Import Market Analysis (Value & Volume) 2025 & 2033
- Figure 84: Middle East & Africa APAC Biofertilizers Market Volume (Kiloton), by Import Market Analysis (Value & Volume) 2025 & 2033
- Figure 85: Middle East & Africa APAC Biofertilizers Market Revenue Share (%), by Import Market Analysis (Value & Volume) 2025 & 2033
- Figure 86: Middle East & Africa APAC Biofertilizers Market Volume Share (%), by Import Market Analysis (Value & Volume) 2025 & 2033
- Figure 87: Middle East & Africa APAC Biofertilizers Market Revenue (undefined), by Export Market Analysis (Value & Volume) 2025 & 2033
- Figure 88: Middle East & Africa APAC Biofertilizers Market Volume (Kiloton), by Export Market Analysis (Value & Volume) 2025 & 2033
- Figure 89: Middle East & Africa APAC Biofertilizers Market Revenue Share (%), by Export Market Analysis (Value & Volume) 2025 & 2033
- Figure 90: Middle East & Africa APAC Biofertilizers Market Volume Share (%), by Export Market Analysis (Value & Volume) 2025 & 2033
- Figure 91: Middle East & Africa APAC Biofertilizers Market Revenue (undefined), by Price Trend Analysis 2025 & 2033
- Figure 92: Middle East & Africa APAC Biofertilizers Market Volume (Kiloton), by Price Trend Analysis 2025 & 2033
- Figure 93: Middle East & Africa APAC Biofertilizers Market Revenue Share (%), by Price Trend Analysis 2025 & 2033
- Figure 94: Middle East & Africa APAC Biofertilizers Market Volume Share (%), by Price Trend Analysis 2025 & 2033
- Figure 95: Middle East & Africa APAC Biofertilizers Market Revenue (undefined), by Country 2025 & 2033
- Figure 96: Middle East & Africa APAC Biofertilizers Market Volume (Kiloton), by Country 2025 & 2033
- Figure 97: Middle East & Africa APAC Biofertilizers Market Revenue Share (%), by Country 2025 & 2033
- Figure 98: Middle East & Africa APAC Biofertilizers Market Volume Share (%), by Country 2025 & 2033
- Figure 99: Asia Pacific APAC Biofertilizers Market Revenue (undefined), by Production Analysis 2025 & 2033
- Figure 100: Asia Pacific APAC Biofertilizers Market Volume (Kiloton), by Production Analysis 2025 & 2033
- Figure 101: Asia Pacific APAC Biofertilizers Market Revenue Share (%), by Production Analysis 2025 & 2033
- Figure 102: Asia Pacific APAC Biofertilizers Market Volume Share (%), by Production Analysis 2025 & 2033
- Figure 103: Asia Pacific APAC Biofertilizers Market Revenue (undefined), by Consumption Analysis 2025 & 2033
- Figure 104: Asia Pacific APAC Biofertilizers Market Volume (Kiloton), by Consumption Analysis 2025 & 2033
- Figure 105: Asia Pacific APAC Biofertilizers Market Revenue Share (%), by Consumption Analysis 2025 & 2033
- Figure 106: Asia Pacific APAC Biofertilizers Market Volume Share (%), by Consumption Analysis 2025 & 2033
- Figure 107: Asia Pacific APAC Biofertilizers Market Revenue (undefined), by Import Market Analysis (Value & Volume) 2025 & 2033
- Figure 108: Asia Pacific APAC Biofertilizers Market Volume (Kiloton), by Import Market Analysis (Value & Volume) 2025 & 2033
- Figure 109: Asia Pacific APAC Biofertilizers Market Revenue Share (%), by Import Market Analysis (Value & Volume) 2025 & 2033
- Figure 110: Asia Pacific APAC Biofertilizers Market Volume Share (%), by Import Market Analysis (Value & Volume) 2025 & 2033
- Figure 111: Asia Pacific APAC Biofertilizers Market Revenue (undefined), by Export Market Analysis (Value & Volume) 2025 & 2033
- Figure 112: Asia Pacific APAC Biofertilizers Market Volume (Kiloton), by Export Market Analysis (Value & Volume) 2025 & 2033
- Figure 113: Asia Pacific APAC Biofertilizers Market Revenue Share (%), by Export Market Analysis (Value & Volume) 2025 & 2033
- Figure 114: Asia Pacific APAC Biofertilizers Market Volume Share (%), by Export Market Analysis (Value & Volume) 2025 & 2033
- Figure 115: Asia Pacific APAC Biofertilizers Market Revenue (undefined), by Price Trend Analysis 2025 & 2033
- Figure 116: Asia Pacific APAC Biofertilizers Market Volume (Kiloton), by Price Trend Analysis 2025 & 2033
- Figure 117: Asia Pacific APAC Biofertilizers Market Revenue Share (%), by Price Trend Analysis 2025 & 2033
- Figure 118: Asia Pacific APAC Biofertilizers Market Volume Share (%), by Price Trend Analysis 2025 & 2033
- Figure 119: Asia Pacific APAC Biofertilizers Market Revenue (undefined), by Country 2025 & 2033
- Figure 120: Asia Pacific APAC Biofertilizers Market Volume (Kiloton), by Country 2025 & 2033
- Figure 121: Asia Pacific APAC Biofertilizers Market Revenue Share (%), by Country 2025 & 2033
- Figure 122: Asia Pacific APAC Biofertilizers Market Volume Share (%), by Country 2025 & 2033
List of Tables
- Table 1: Global APAC Biofertilizers Market Revenue undefined Forecast, by Production Analysis 2020 & 2033
- Table 2: Global APAC Biofertilizers Market Volume Kiloton Forecast, by Production Analysis 2020 & 2033
- Table 3: Global APAC Biofertilizers Market Revenue undefined Forecast, by Consumption Analysis 2020 & 2033
- Table 4: Global APAC Biofertilizers Market Volume Kiloton Forecast, by Consumption Analysis 2020 & 2033
- Table 5: Global APAC Biofertilizers Market Revenue undefined Forecast, by Import Market Analysis (Value & Volume) 2020 & 2033
- Table 6: Global APAC Biofertilizers Market Volume Kiloton Forecast, by Import Market Analysis (Value & Volume) 2020 & 2033
- Table 7: Global APAC Biofertilizers Market Revenue undefined Forecast, by Export Market Analysis (Value & Volume) 2020 & 2033
- Table 8: Global APAC Biofertilizers Market Volume Kiloton Forecast, by Export Market Analysis (Value & Volume) 2020 & 2033
- Table 9: Global APAC Biofertilizers Market Revenue undefined Forecast, by Price Trend Analysis 2020 & 2033
- Table 10: Global APAC Biofertilizers Market Volume Kiloton Forecast, by Price Trend Analysis 2020 & 2033
- Table 11: Global APAC Biofertilizers Market Revenue undefined Forecast, by Region 2020 & 2033
- Table 12: Global APAC Biofertilizers Market Volume Kiloton Forecast, by Region 2020 & 2033
- Table 13: Global APAC Biofertilizers Market Revenue undefined Forecast, by Production Analysis 2020 & 2033
- Table 14: Global APAC Biofertilizers Market Volume Kiloton Forecast, by Production Analysis 2020 & 2033
- Table 15: Global APAC Biofertilizers Market Revenue undefined Forecast, by Consumption Analysis 2020 & 2033
- Table 16: Global APAC Biofertilizers Market Volume Kiloton Forecast, by Consumption Analysis 2020 & 2033
- Table 17: Global APAC Biofertilizers Market Revenue undefined Forecast, by Import Market Analysis (Value & Volume) 2020 & 2033
- Table 18: Global APAC Biofertilizers Market Volume Kiloton Forecast, by Import Market Analysis (Value & Volume) 2020 & 2033
- Table 19: Global APAC Biofertilizers Market Revenue undefined Forecast, by Export Market Analysis (Value & Volume) 2020 & 2033
- Table 20: Global APAC Biofertilizers Market Volume Kiloton Forecast, by Export Market Analysis (Value & Volume) 2020 & 2033
- Table 21: Global APAC Biofertilizers Market Revenue undefined Forecast, by Price Trend Analysis 2020 & 2033
- Table 22: Global APAC Biofertilizers Market Volume Kiloton Forecast, by Price Trend Analysis 2020 & 2033
- Table 23: Global APAC Biofertilizers Market Revenue undefined Forecast, by Country 2020 & 2033
- Table 24: Global APAC Biofertilizers Market Volume Kiloton Forecast, by Country 2020 & 2033
- Table 25: United States APAC Biofertilizers Market Revenue (undefined) Forecast, by Application 2020 & 2033
- Table 26: United States APAC Biofertilizers Market Volume (Kiloton) Forecast, by Application 2020 & 2033
- Table 27: Canada APAC Biofertilizers Market Revenue (undefined) Forecast, by Application 2020 & 2033
- Table 28: Canada APAC Biofertilizers Market Volume (Kiloton) Forecast, by Application 2020 & 2033
- Table 29: Mexico APAC Biofertilizers Market Revenue (undefined) Forecast, by Application 2020 & 2033
- Table 30: Mexico APAC Biofertilizers Market Volume (Kiloton) Forecast, by Application 2020 & 2033
- Table 31: Global APAC Biofertilizers Market Revenue undefined Forecast, by Production Analysis 2020 & 2033
- Table 32: Global APAC Biofertilizers Market Volume Kiloton Forecast, by Production Analysis 2020 & 2033
- Table 33: Global APAC Biofertilizers Market Revenue undefined Forecast, by Consumption Analysis 2020 & 2033
- Table 34: Global APAC Biofertilizers Market Volume Kiloton Forecast, by Consumption Analysis 2020 & 2033
- Table 35: Global APAC Biofertilizers Market Revenue undefined Forecast, by Import Market Analysis (Value & Volume) 2020 & 2033
- Table 36: Global APAC Biofertilizers Market Volume Kiloton Forecast, by Import Market Analysis (Value & Volume) 2020 & 2033
- Table 37: Global APAC Biofertilizers Market Revenue undefined Forecast, by Export Market Analysis (Value & Volume) 2020 & 2033
- Table 38: Global APAC Biofertilizers Market Volume Kiloton Forecast, by Export Market Analysis (Value & Volume) 2020 & 2033
- Table 39: Global APAC Biofertilizers Market Revenue undefined Forecast, by Price Trend Analysis 2020 & 2033
- Table 40: Global APAC Biofertilizers Market Volume Kiloton Forecast, by Price Trend Analysis 2020 & 2033
- Table 41: Global APAC Biofertilizers Market Revenue undefined Forecast, by Country 2020 & 2033
- Table 42: Global APAC Biofertilizers Market Volume Kiloton Forecast, by Country 2020 & 2033
- Table 43: Brazil APAC Biofertilizers Market Revenue (undefined) Forecast, by Application 2020 & 2033
- Table 44: Brazil APAC Biofertilizers Market Volume (Kiloton) Forecast, by Application 2020 & 2033
- Table 45: Argentina APAC Biofertilizers Market Revenue (undefined) Forecast, by Application 2020 & 2033
- Table 46: Argentina APAC Biofertilizers Market Volume (Kiloton) Forecast, by Application 2020 & 2033
- Table 47: Rest of South America APAC Biofertilizers Market Revenue (undefined) Forecast, by Application 2020 & 2033
- Table 48: Rest of South America APAC Biofertilizers Market Volume (Kiloton) Forecast, by Application 2020 & 2033
- Table 49: Global APAC Biofertilizers Market Revenue undefined Forecast, by Production Analysis 2020 & 2033
- Table 50: Global APAC Biofertilizers Market Volume Kiloton Forecast, by Production Analysis 2020 & 2033
- Table 51: Global APAC Biofertilizers Market Revenue undefined Forecast, by Consumption Analysis 2020 & 2033
- Table 52: Global APAC Biofertilizers Market Volume Kiloton Forecast, by Consumption Analysis 2020 & 2033
- Table 53: Global APAC Biofertilizers Market Revenue undefined Forecast, by Import Market Analysis (Value & Volume) 2020 & 2033
- Table 54: Global APAC Biofertilizers Market Volume Kiloton Forecast, by Import Market Analysis (Value & Volume) 2020 & 2033
- Table 55: Global APAC Biofertilizers Market Revenue undefined Forecast, by Export Market Analysis (Value & Volume) 2020 & 2033
- Table 56: Global APAC Biofertilizers Market Volume Kiloton Forecast, by Export Market Analysis (Value & Volume) 2020 & 2033
- Table 57: Global APAC Biofertilizers Market Revenue undefined Forecast, by Price Trend Analysis 2020 & 2033
- Table 58: Global APAC Biofertilizers Market Volume Kiloton Forecast, by Price Trend Analysis 2020 & 2033
- Table 59: Global APAC Biofertilizers Market Revenue undefined Forecast, by Country 2020 & 2033
- Table 60: Global APAC Biofertilizers Market Volume Kiloton Forecast, by Country 2020 & 2033
- Table 61: United Kingdom APAC Biofertilizers Market Revenue (undefined) Forecast, by Application 2020 & 2033
- Table 62: United Kingdom APAC Biofertilizers Market Volume (Kiloton) Forecast, by Application 2020 & 2033
- Table 63: Germany APAC Biofertilizers Market Revenue (undefined) Forecast, by Application 2020 & 2033
- Table 64: Germany APAC Biofertilizers Market Volume (Kiloton) Forecast, by Application 2020 & 2033
- Table 65: France APAC Biofertilizers Market Revenue (undefined) Forecast, by Application 2020 & 2033
- Table 66: France APAC Biofertilizers Market Volume (Kiloton) Forecast, by Application 2020 & 2033
- Table 67: Italy APAC Biofertilizers Market Revenue (undefined) Forecast, by Application 2020 & 2033
- Table 68: Italy APAC Biofertilizers Market Volume (Kiloton) Forecast, by Application 2020 & 2033
- Table 69: Spain APAC Biofertilizers Market Revenue (undefined) Forecast, by Application 2020 & 2033
- Table 70: Spain APAC Biofertilizers Market Volume (Kiloton) Forecast, by Application 2020 & 2033
- Table 71: Russia APAC Biofertilizers Market Revenue (undefined) Forecast, by Application 2020 & 2033
- Table 72: Russia APAC Biofertilizers Market Volume (Kiloton) Forecast, by Application 2020 & 2033
- Table 73: Benelux APAC Biofertilizers Market Revenue (undefined) Forecast, by Application 2020 & 2033
- Table 74: Benelux APAC Biofertilizers Market Volume (Kiloton) Forecast, by Application 2020 & 2033
- Table 75: Nordics APAC Biofertilizers Market Revenue (undefined) Forecast, by Application 2020 & 2033
- Table 76: Nordics APAC Biofertilizers Market Volume (Kiloton) Forecast, by Application 2020 & 2033
- Table 77: Rest of Europe APAC Biofertilizers Market Revenue (undefined) Forecast, by Application 2020 & 2033
- Table 78: Rest of Europe APAC Biofertilizers Market Volume (Kiloton) Forecast, by Application 2020 & 2033
- Table 79: Global APAC Biofertilizers Market Revenue undefined Forecast, by Production Analysis 2020 & 2033
- Table 80: Global APAC Biofertilizers Market Volume Kiloton Forecast, by Production Analysis 2020 & 2033
- Table 81: Global APAC Biofertilizers Market Revenue undefined Forecast, by Consumption Analysis 2020 & 2033
- Table 82: Global APAC Biofertilizers Market Volume Kiloton Forecast, by Consumption Analysis 2020 & 2033
- Table 83: Global APAC Biofertilizers Market Revenue undefined Forecast, by Import Market Analysis (Value & Volume) 2020 & 2033
- Table 84: Global APAC Biofertilizers Market Volume Kiloton Forecast, by Import Market Analysis (Value & Volume) 2020 & 2033
- Table 85: Global APAC Biofertilizers Market Revenue undefined Forecast, by Export Market Analysis (Value & Volume) 2020 & 2033
- Table 86: Global APAC Biofertilizers Market Volume Kiloton Forecast, by Export Market Analysis (Value & Volume) 2020 & 2033
- Table 87: Global APAC Biofertilizers Market Revenue undefined Forecast, by Price Trend Analysis 2020 & 2033
- Table 88: Global APAC Biofertilizers Market Volume Kiloton Forecast, by Price Trend Analysis 2020 & 2033
- Table 89: Global APAC Biofertilizers Market Revenue undefined Forecast, by Country 2020 & 2033
- Table 90: Global APAC Biofertilizers Market Volume Kiloton Forecast, by Country 2020 & 2033
- Table 91: Turkey APAC Biofertilizers Market Revenue (undefined) Forecast, by Application 2020 & 2033
- Table 92: Turkey APAC Biofertilizers Market Volume (Kiloton) Forecast, by Application 2020 & 2033
- Table 93: Israel APAC Biofertilizers Market Revenue (undefined) Forecast, by Application 2020 & 2033
- Table 94: Israel APAC Biofertilizers Market Volume (Kiloton) Forecast, by Application 2020 & 2033
- Table 95: GCC APAC Biofertilizers Market Revenue (undefined) Forecast, by Application 2020 & 2033
- Table 96: GCC APAC Biofertilizers Market Volume (Kiloton) Forecast, by Application 2020 & 2033
- Table 97: North Africa APAC Biofertilizers Market Revenue (undefined) Forecast, by Application 2020 & 2033
- Table 98: North Africa APAC Biofertilizers Market Volume (Kiloton) Forecast, by Application 2020 & 2033
- Table 99: South Africa APAC Biofertilizers Market Revenue (undefined) Forecast, by Application 2020 & 2033
- Table 100: South Africa APAC Biofertilizers Market Volume (Kiloton) Forecast, by Application 2020 & 2033
- Table 101: Rest of Middle East & Africa APAC Biofertilizers Market Revenue (undefined) Forecast, by Application 2020 & 2033
- Table 102: Rest of Middle East & Africa APAC Biofertilizers Market Volume (Kiloton) Forecast, by Application 2020 & 2033
- Table 103: Global APAC Biofertilizers Market Revenue undefined Forecast, by Production Analysis 2020 & 2033
- Table 104: Global APAC Biofertilizers Market Volume Kiloton Forecast, by Production Analysis 2020 & 2033
- Table 105: Global APAC Biofertilizers Market Revenue undefined Forecast, by Consumption Analysis 2020 & 2033
- Table 106: Global APAC Biofertilizers Market Volume Kiloton Forecast, by Consumption Analysis 2020 & 2033
- Table 107: Global APAC Biofertilizers Market Revenue undefined Forecast, by Import Market Analysis (Value & Volume) 2020 & 2033
- Table 108: Global APAC Biofertilizers Market Volume Kiloton Forecast, by Import Market Analysis (Value & Volume) 2020 & 2033
- Table 109: Global APAC Biofertilizers Market Revenue undefined Forecast, by Export Market Analysis (Value & Volume) 2020 & 2033
- Table 110: Global APAC Biofertilizers Market Volume Kiloton Forecast, by Export Market Analysis (Value & Volume) 2020 & 2033
- Table 111: Global APAC Biofertilizers Market Revenue undefined Forecast, by Price Trend Analysis 2020 & 2033
- Table 112: Global APAC Biofertilizers Market Volume Kiloton Forecast, by Price Trend Analysis 2020 & 2033
- Table 113: Global APAC Biofertilizers Market Revenue undefined Forecast, by Country 2020 & 2033
- Table 114: Global APAC Biofertilizers Market Volume Kiloton Forecast, by Country 2020 & 2033
- Table 115: China APAC Biofertilizers Market Revenue (undefined) Forecast, by Application 2020 & 2033
- Table 116: China APAC Biofertilizers Market Volume (Kiloton) Forecast, by Application 2020 & 2033
- Table 117: India APAC Biofertilizers Market Revenue (undefined) Forecast, by Application 2020 & 2033
- Table 118: India APAC Biofertilizers Market Volume (Kiloton) Forecast, by Application 2020 & 2033
- Table 119: Japan APAC Biofertilizers Market Revenue (undefined) Forecast, by Application 2020 & 2033
- Table 120: Japan APAC Biofertilizers Market Volume (Kiloton) Forecast, by Application 2020 & 2033
- Table 121: South Korea APAC Biofertilizers Market Revenue (undefined) Forecast, by Application 2020 & 2033
- Table 122: South Korea APAC Biofertilizers Market Volume (Kiloton) Forecast, by Application 2020 & 2033
- Table 123: ASEAN APAC Biofertilizers Market Revenue (undefined) Forecast, by Application 2020 & 2033
- Table 124: ASEAN APAC Biofertilizers Market Volume (Kiloton) Forecast, by Application 2020 & 2033
- Table 125: Oceania APAC Biofertilizers Market Revenue (undefined) Forecast, by Application 2020 & 2033
- Table 126: Oceania APAC Biofertilizers Market Volume (Kiloton) Forecast, by Application 2020 & 2033
- Table 127: Rest of Asia Pacific APAC Biofertilizers Market Revenue (undefined) Forecast, by Application 2020 & 2033
- Table 128: Rest of Asia Pacific APAC Biofertilizers Market Volume (Kiloton) Forecast, by Application 2020 & 2033
Frequently Asked Questions
1. What is the projected Compound Annual Growth Rate (CAGR) of the APAC Biofertilizers Market?
The projected CAGR is approximately 13.6%.
2. Which companies are prominent players in the APAC Biofertilizers Market?
Key companies in the market include Australian Bio Fert Pty Ltd, Criyagen Agri & Biotech Pvt Ltd, Agri Life, Kiwa Bio-Tech Products Group Corporation, Symborg SL, CBF China Biofertilizers AG, Biomax Naturals, Agrinos AS, BioAg Pty Ltd, Camson Biotechnologies Limited, National Fertilizer Ltd.
3. What are the main segments of the APAC Biofertilizers Market?
The market segments include Production Analysis, Consumption Analysis, Import Market Analysis (Value & Volume), Export Market Analysis (Value & Volume), Price Trend Analysis.
4. Can you provide details about the market size?
The market size is estimated to be USD XXX N/A as of 2022.
5. What are some drivers contributing to market growth?
Seed Treatment As A Solution To Enhance Yield; Growing Awareness For Seed Treatment Among The Farmers; Rising Trend Of Organic Farming.
6. What are the notable trends driving market growth?
Increased Practice for Organic Farming.
7. Are there any restraints impacting market growth?
Limitations Across Farm-Level Seed Treatment; Rising Environmental Concerns.
8. Can you provide examples of recent developments in the market?
N/A
9. What pricing options are available for accessing the report?
Pricing options include single-user, multi-user, and enterprise licenses priced at USD 4750, USD 5250, and USD 8750 respectively.
10. Is the market size provided in terms of value or volume?
The market size is provided in terms of value, measured in N/A and volume, measured in Kiloton.
11. Are there any specific market keywords associated with the report?
Yes, the market keyword associated with the report is "APAC Biofertilizers Market," which aids in identifying and referencing the specific market segment covered.
12. How do I determine which pricing option suits my needs best?
The pricing options vary based on user requirements and access needs. Individual users may opt for single-user licenses, while businesses requiring broader access may choose multi-user or enterprise licenses for cost-effective access to the report.
13. Are there any additional resources or data provided in the APAC Biofertilizers Market report?
While the report offers comprehensive insights, it's advisable to review the specific contents or supplementary materials provided to ascertain if additional resources or data are available.
14. How can I stay updated on further developments or reports in the APAC Biofertilizers Market?
To stay informed about further developments, trends, and reports in the APAC Biofertilizers Market, consider subscribing to industry newsletters, following relevant companies and organizations, or regularly checking reputable industry news sources and publications.
Methodology
Step 1 - Identification of Relevant Samples Size from Population Database


Step 2 - Approaches for Defining Global Market Size (Value, Volume* & Price*)

Note*: In applicable scenarios
Step 3 - Data Sources
Primary Research
- Web Analytics
- Survey Reports
- Research Institute
- Latest Research Reports
- Opinion Leaders
Secondary Research
- Annual Reports
- White Paper
- Latest Press Release
- Industry Association
- Paid Database
- Investor Presentations

Step 4 - Data Triangulation
Involves using different sources of information in order to increase the validity of a study
These sources are likely to be stakeholders in a program - participants, other researchers, program staff, other community members, and so on.
Then we put all data in single framework & apply various statistical tools to find out the dynamic on the market.
During the analysis stage, feedback from the stakeholder groups would be compared to determine areas of agreement as well as areas of divergence