

Key Insights
The global molluscicides market is poised for substantial growth, projected to reach $837.82 million by 2025, with an estimated Compound Annual Growth Rate (CAGR) of 9.67% through 2033. This expansion is fueled by the critical need for effective agricultural pest control to protect crop yields from slug and snail damage. Growing global food demand necessitates molluscicides to prevent significant crop losses. Innovations in formulation technology, delivering more targeted and eco-friendly products, also drive market growth. Increased farmer awareness of infestation economic impacts and the adoption of Integrated Pest Management (IPM) strategies further support consistent demand.
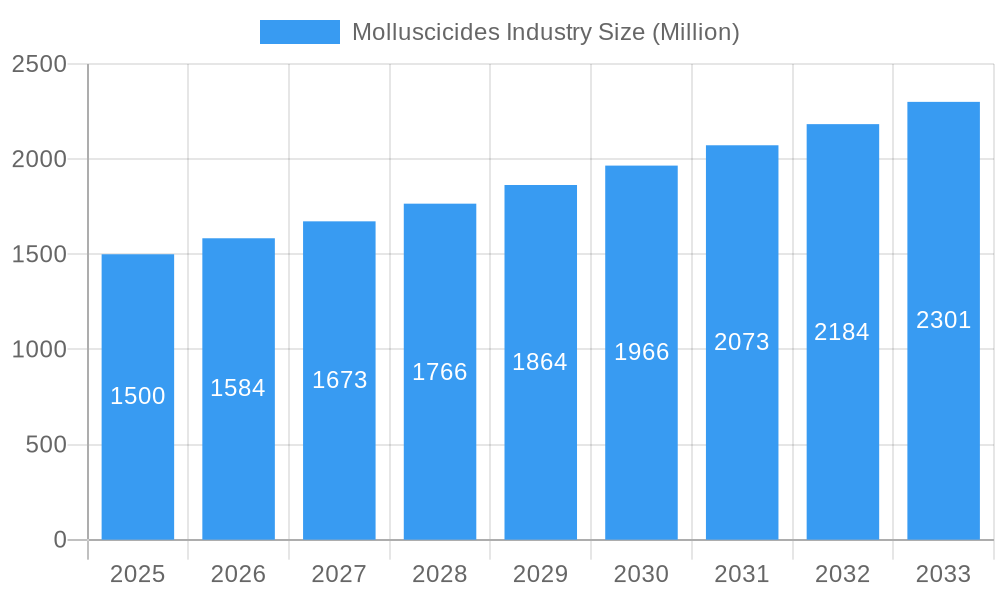
Molluscicides Industry Market Size (In Million)
Key market trends include a rising preference for biological molluscicides, driven by sustainability demands, environmental regulations, and consumer interest in organic produce. However, market restraints include the toxicity and environmental concerns associated with some synthetic molluscicides, requiring stringent regulatory approvals and potentially facing public apprehension. Fluctuating raw material prices also impact manufacturer profit margins. Geographically, the Asia Pacific region, led by China and India, is anticipated to be a significant growth driver due to its extensive agricultural base and the adoption of advanced farming techniques. North America and Europe represent mature markets with steady growth, supported by technological innovation and demand for high-value crops.
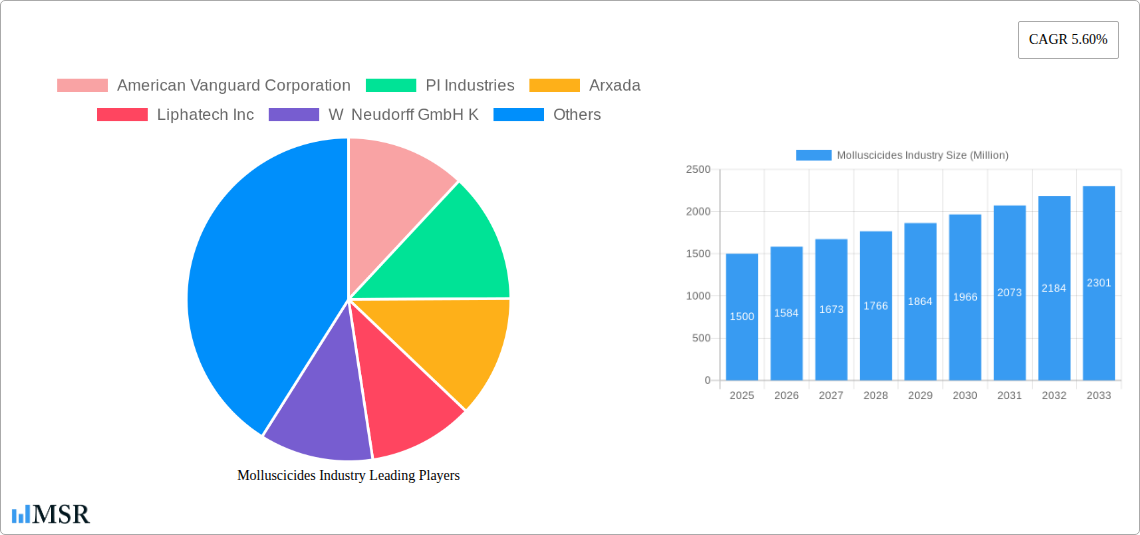
Molluscicides Industry Company Market Share
Unlocking Global Growth: A Comprehensive Molluscicides Market Report (2019-2033)
Dive deep into the vital Molluscicides Industry with this in-depth market analysis, covering production, consumption, trade, pricing, and pivotal industry developments. This report provides actionable intelligence for stakeholders seeking to navigate and capitalize on the dynamic global molluscicide market from 2019 to 2033, with a focus on the base year 2025 and a robust forecast period.
Molluscicides Industry Market Concentration & Dynamics
The global molluscicides market exhibits a moderate to high level of concentration, with a few key players dominating market share, estimated at over 60% in 2025. Innovation ecosystems are evolving, driven by the demand for more effective and environmentally friendly solutions, particularly in agriculture and public health. Regulatory frameworks remain stringent, influencing product development and market entry. Substitute products, such as biological control agents and advanced agricultural practices, pose a growing challenge, necessitating continuous innovation in molluscicide formulations. End-user trends point towards integrated pest management (IPM) strategies, where molluscicides play a targeted role. Mergers and acquisitions (M&A) activities are a significant dynamic, with an estimated 5 major deals anticipated between 2024 and 2028, reshaping the competitive landscape and consolidating market presence.
Molluscicides Industry Industry Insights & Trends
The molluscicides industry is poised for significant growth, driven by escalating demand for crop protection solutions amidst a rising global population and the increasing prevalence of slug and snail infestations in agricultural lands and gardens. The market size for molluscicides is projected to reach approximately $1,500 Million in 2025, with an estimated Compound Annual Growth Rate (CAGR) of 4.8% from 2025 to 2033. Technological disruptions, including the development of novel active ingredients with lower environmental impact and improved efficacy against resistant pest populations, are shaping market dynamics. Evolving consumer behaviors, particularly the growing consumer preference for organic produce and sustainable farming practices, are indirectly influencing the demand for safer and more targeted molluscicide solutions. The impact of climate change, leading to altered pest distribution and increased infestation rates in certain regions, is also a significant market driver. Furthermore, the expanding horticulture and ornamental plant sectors contribute to sustained demand for molluscicide products.
Key Markets & Segments Leading Molluscicides Industry
Production Analysis: Asia Pacific, particularly China and India, leads global molluscicide production, accounting for an estimated 40% of global output in 2025. This dominance is fueled by cost-effective manufacturing capabilities and a robust chemical industry infrastructure.
Consumption Analysis: Europe is the largest consuming region, representing approximately 35% of global molluscicide consumption in 2025. This is driven by intensive agriculture, a high prevalence of gastropod pests in vineyards and vegetable crops, and stringent regulatory requirements for crop protection. North America follows closely, with significant consumption in agricultural and horticultural sectors.
- Drivers for European Consumption:
- High demand for grapes, fruits, and vegetables susceptible to slug and snail damage.
- Strict food safety regulations mandating effective pest control.
- Well-established distribution networks for crop protection chemicals.
Import Market Analysis (Value & Volume): The import market is highly concentrated in developed economies, with Europe and North America being major importers. In 2025, import value is estimated at $700 Million and import volume at 80,000 metric tons. Key importing countries include Germany, France, the United States, and the United Kingdom.
Export Market Analysis (Value & Volume): Asia Pacific nations are the primary exporters of molluscicides, with an estimated export value of $850 Million and export volume of 95,000 metric tons in 2025. China and India are key players in the global export market, supplying to various regions worldwide.
Price Trend Analysis: The price trend analysis indicates a steady increase in molluscicide prices, driven by rising raw material costs, increased R&D investments in developing newer, safer formulations, and inflationary pressures. Metaldehyde and iron phosphate-based molluscicides are expected to see price appreciation of 3-5% annually in the forecast period.
Molluscicides Industry Product Developments
Product innovation in the molluscicides industry is increasingly focused on developing formulations with improved safety profiles for non-target organisms and the environment. This includes a growing emphasis on biodegradable active ingredients and granular formulations that offer precise application and reduced drift. Advanced delivery systems, such as slow-release pellets and bait stations, are also being developed to enhance efficacy and minimize usage. These technological advancements are critical for maintaining market competitiveness and meeting evolving regulatory and consumer demands.
Challenges in the Molluscicides Industry Market
The molluscicides industry faces significant challenges, including stringent regulatory hurdles and approval processes for new active ingredients, which can delay market entry and increase development costs. Supply chain disruptions, as seen in recent global events, can impact the availability and cost of raw materials. Furthermore, increasing competition from alternative pest control methods, including biological controls and integrated pest management strategies, requires continuous innovation and differentiation. The negative public perception associated with certain chemical pesticides also presents a marketing challenge.
Forces Driving Molluscicides Industry Growth
Key growth drivers for the molluscicides industry include the escalating demand for food security due to a growing global population, which necessitates effective crop protection measures against pest infestations. Technological advancements leading to the development of more targeted and eco-friendly molluscicides are also fueling market expansion. The increasing adoption of precision agriculture techniques and the growth of the ornamental horticulture sector further contribute to sustained demand. Favorable government policies supporting agricultural productivity in various developing economies also play a crucial role.
Challenges in the Molluscicides Industry Market
Long-term growth catalysts for the molluscicides industry lie in continued innovation and strategic market expansion. The development of novel, highly specific molluscicides with minimal impact on beneficial insects and wildlife will be critical. Strategic partnerships and collaborations between chemical manufacturers and agricultural technology providers can accelerate the adoption of advanced solutions. Furthermore, exploring new market segments, such as urban pest control and aquaculture, could unlock significant growth potential.
Emerging Opportunities in Molluscicides Industry
Emerging opportunities in the molluscicides industry are abundant, particularly in the development and adoption of bio-molluscicides derived from natural sources, offering a sustainable alternative. The integration of smart pest monitoring systems with targeted molluscicide application technologies presents a significant growth avenue. Furthermore, the growing demand for organic farming practices is creating a niche for certified organic molluscicides. Expanding into emerging economies with increasing agricultural intensity and a growing awareness of pest management needs also offers substantial potential.
Leading Players in the Molluscicides Industry Sector
- American Vanguard Corporation
- PI Industries
- Arxada
- Liphatech Inc
- W Neudorff GmbH K
- Mitsui & Co Ltd (Certis Belchim)
- UPL Limited
- Nufarm Ltd
Key Milestones in Molluscicides Industry Industry
- November 2022: Certis Belchim BV acquired the assets of Henry Manufacturing Limited in New Zealand, bolstering its crop protection portfolio with potassium fatty-acid salts.
- March 2022: Certis Belchim BV was formed by Mitsui & Co. Ltd through the merger of Belchim Crop Protection and Certis Europe, creating a stronger European presence.
- June 2021: Mitsui & Co. Ltd acquired the remaining 32% stake in Belchim Crop Protection, solidifying its commitment to establishing a sustainable crop protection business in Europe.
Strategic Outlook for Molluscicides Industry Market
The strategic outlook for the molluscicides industry is positive, with a clear trajectory towards innovation in sustainable and targeted solutions. Growth will be propelled by the increasing global need for effective pest management in agriculture and horticulture, coupled with a growing emphasis on environmental safety. Companies that invest in R&D for novel active ingredients, bio-molluscicides, and integrated pest management solutions will be well-positioned to capture market share. Strategic alliances and expansions into emerging markets will further enhance competitive advantage and long-term profitability.
Molluscicides Industry Segmentation
- 1. Production Analysis
- 2. Consumption Analysis
- 3. Import Market Analysis (Value & Volume)
- 4. Export Market Analysis (Value & Volume)
- 5. Price Trend Analysis
Molluscicides Industry Segmentation By Geography
-
1. North America
- 1.1. United States
- 1.2. Canada
- 1.3. Mexico
-
2. South America
- 2.1. Brazil
- 2.2. Argentina
- 2.3. Rest of South America
-
3. Europe
- 3.1. United Kingdom
- 3.2. Germany
- 3.3. France
- 3.4. Italy
- 3.5. Spain
- 3.6. Russia
- 3.7. Benelux
- 3.8. Nordics
- 3.9. Rest of Europe
-
4. Middle East & Africa
- 4.1. Turkey
- 4.2. Israel
- 4.3. GCC
- 4.4. North Africa
- 4.5. South Africa
- 4.6. Rest of Middle East & Africa
-
5. Asia Pacific
- 5.1. China
- 5.2. India
- 5.3. Japan
- 5.4. South Korea
- 5.5. ASEAN
- 5.6. Oceania
- 5.7. Rest of Asia Pacific
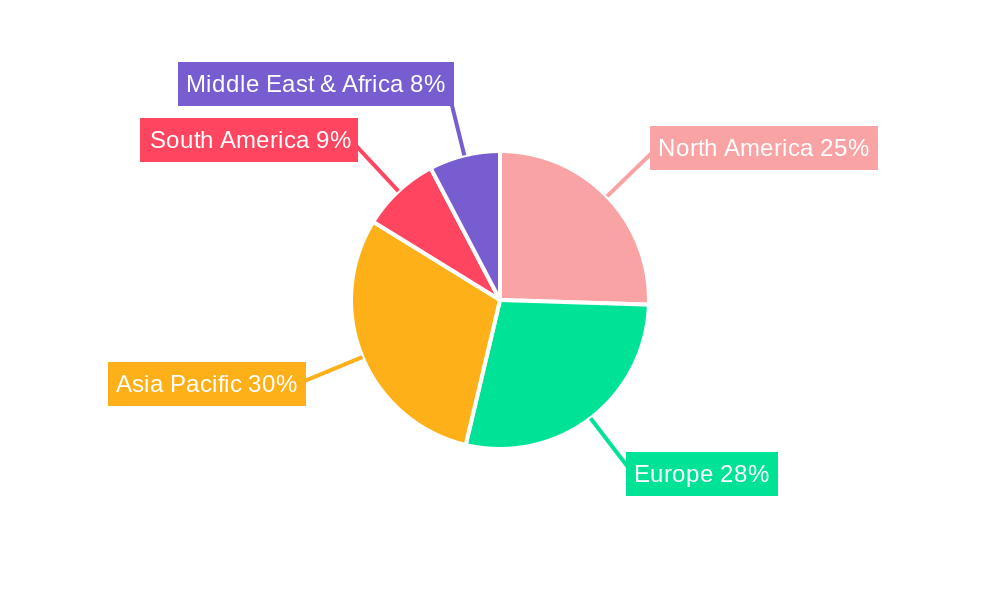
Molluscicides Industry Regional Market Share
Geographic Coverage of Molluscicides Industry
Molluscicides Industry REPORT HIGHLIGHTS
| Aspects | Details |
|---|---|
| Study Period | 2020-2034 |
| Base Year | 2025 |
| Estimated Year | 2026 |
| Forecast Period | 2026-2034 |
| Historical Period | 2020-2025 |
| Growth Rate | CAGR of 9.67% from 2020-2034 |
| Segmentation |
|
Table of Contents
- 1. Introduction
- 1.1. Research Scope
- 1.2. Market Segmentation
- 1.3. Research Objective
- 1.4. Definitions and Assumptions
- 2. Executive Summary
- 2.1. Market Snapshot
- 3. Market Dynamics
- 3.1. Market Drivers
- 3.2. Market Restrains
- 3.3. Market Trends
- 3.4. Market Opportunities
- 4. Market Factor Analysis
- 4.1. Porters Five Forces
- 4.1.1. Bargaining Power of Suppliers
- 4.1.2. Bargaining Power of Buyers
- 4.1.3. Threat of New Entrants
- 4.1.4. Threat of Substitutes
- 4.1.5. Competitive Rivalry
- 4.2. PESTEL analysis
- 4.3. BCG Analysis
- 4.3.1. Stars (High Growth, High Market Share)
- 4.3.2. Cash Cows (Low Growth, High Market Share)
- 4.3.3. Question Mark (High Growth, Low Market Share)
- 4.3.4. Dogs (Low Growth, Low Market Share)
- 4.4. Ansoff Matrix Analysis
- 4.5. Supply Chain Analysis
- 4.6. Regulatory Landscape
- 4.7. Current Market Potential and Opportunity Assessment (TAM–SAM–SOM Framework)
- 4.8. MSR Analyst Note
- 4.1. Porters Five Forces
- 5. Market Analysis, Insights and Forecast 2021-2033
- 5.1. Market Analysis, Insights and Forecast - by Production Analysis
- 5.2. Market Analysis, Insights and Forecast - by Consumption Analysis
- 5.3. Market Analysis, Insights and Forecast - by Import Market Analysis (Value & Volume)
- 5.4. Market Analysis, Insights and Forecast - by Export Market Analysis (Value & Volume)
- 5.5. Market Analysis, Insights and Forecast - by Price Trend Analysis
- 5.6. Market Analysis, Insights and Forecast - by Region
- 5.6.1. North America
- 5.6.2. South America
- 5.6.3. Europe
- 5.6.4. Middle East & Africa
- 5.6.5. Asia Pacific
- 6. Global Molluscicides Industry Analysis, Insights and Forecast, 2021-2033
- 6.1. Market Analysis, Insights and Forecast - by Production Analysis
- 6.2. Market Analysis, Insights and Forecast - by Consumption Analysis
- 6.3. Market Analysis, Insights and Forecast - by Import Market Analysis (Value & Volume)
- 6.4. Market Analysis, Insights and Forecast - by Export Market Analysis (Value & Volume)
- 6.5. Market Analysis, Insights and Forecast - by Price Trend Analysis
- 7. North America Molluscicides Industry Analysis, Insights and Forecast, 2020-2032
- 7.1. Market Analysis, Insights and Forecast - by Production Analysis
- 7.2. Market Analysis, Insights and Forecast - by Consumption Analysis
- 7.3. Market Analysis, Insights and Forecast - by Import Market Analysis (Value & Volume)
- 7.4. Market Analysis, Insights and Forecast - by Export Market Analysis (Value & Volume)
- 7.5. Market Analysis, Insights and Forecast - by Price Trend Analysis
- 8. South America Molluscicides Industry Analysis, Insights and Forecast, 2020-2032
- 8.1. Market Analysis, Insights and Forecast - by Production Analysis
- 8.2. Market Analysis, Insights and Forecast - by Consumption Analysis
- 8.3. Market Analysis, Insights and Forecast - by Import Market Analysis (Value & Volume)
- 8.4. Market Analysis, Insights and Forecast - by Export Market Analysis (Value & Volume)
- 8.5. Market Analysis, Insights and Forecast - by Price Trend Analysis
- 9. Europe Molluscicides Industry Analysis, Insights and Forecast, 2020-2032
- 9.1. Market Analysis, Insights and Forecast - by Production Analysis
- 9.2. Market Analysis, Insights and Forecast - by Consumption Analysis
- 9.3. Market Analysis, Insights and Forecast - by Import Market Analysis (Value & Volume)
- 9.4. Market Analysis, Insights and Forecast - by Export Market Analysis (Value & Volume)
- 9.5. Market Analysis, Insights and Forecast - by Price Trend Analysis
- 10. Middle East & Africa Molluscicides Industry Analysis, Insights and Forecast, 2020-2032
- 10.1. Market Analysis, Insights and Forecast - by Production Analysis
- 10.2. Market Analysis, Insights and Forecast - by Consumption Analysis
- 10.3. Market Analysis, Insights and Forecast - by Import Market Analysis (Value & Volume)
- 10.4. Market Analysis, Insights and Forecast - by Export Market Analysis (Value & Volume)
- 10.5. Market Analysis, Insights and Forecast - by Price Trend Analysis
- 11. Asia Pacific Molluscicides Industry Analysis, Insights and Forecast, 2020-2032
- 11.1. Market Analysis, Insights and Forecast - by Production Analysis
- 11.2. Market Analysis, Insights and Forecast - by Consumption Analysis
- 11.3. Market Analysis, Insights and Forecast - by Import Market Analysis (Value & Volume)
- 11.4. Market Analysis, Insights and Forecast - by Export Market Analysis (Value & Volume)
- 11.5. Market Analysis, Insights and Forecast - by Price Trend Analysis
- 12. Competitive Analysis
- 12.1. Company Profiles
- 12.1.1 American Vanguard Corporation
- 12.1.1.1. Company Overview
- 12.1.1.2. Products
- 12.1.1.3. Company Financials
- 12.1.1.4. SWOT Analysis
- 12.1.2 PI Industries
- 12.1.2.1. Company Overview
- 12.1.2.2. Products
- 12.1.2.3. Company Financials
- 12.1.2.4. SWOT Analysis
- 12.1.3 Arxada
- 12.1.3.1. Company Overview
- 12.1.3.2. Products
- 12.1.3.3. Company Financials
- 12.1.3.4. SWOT Analysis
- 12.1.4 Liphatech Inc
- 12.1.4.1. Company Overview
- 12.1.4.2. Products
- 12.1.4.3. Company Financials
- 12.1.4.4. SWOT Analysis
- 12.1.5 W Neudorff GmbH K
- 12.1.5.1. Company Overview
- 12.1.5.2. Products
- 12.1.5.3. Company Financials
- 12.1.5.4. SWOT Analysis
- 12.1.6 Mitsui & Co Ltd (Certis Belchim)
- 12.1.6.1. Company Overview
- 12.1.6.2. Products
- 12.1.6.3. Company Financials
- 12.1.6.4. SWOT Analysis
- 12.1.7 UPL Limited
- 12.1.7.1. Company Overview
- 12.1.7.2. Products
- 12.1.7.3. Company Financials
- 12.1.7.4. SWOT Analysis
- 12.1.8 Nufarm Ltd
- 12.1.8.1. Company Overview
- 12.1.8.2. Products
- 12.1.8.3. Company Financials
- 12.1.8.4. SWOT Analysis
- 12.1.1 American Vanguard Corporation
- 12.2. Market Entropy
- 12.2.1 Company's Key Areas Served
- 12.2.2 Recent Developments
- 12.3. Company Market Share Analysis 2025
- 12.3.1 Top 5 Companies Market Share Analysis
- 12.3.2 Top 3 Companies Market Share Analysis
- 12.4. List of Potential Customers
- 13. Research Methodology
List of Figures
- Figure 1: Global Molluscicides Industry Revenue Breakdown (million, %) by Region 2025 & 2033
- Figure 2: North America Molluscicides Industry Revenue (million), by Production Analysis 2025 & 2033
- Figure 3: North America Molluscicides Industry Revenue Share (%), by Production Analysis 2025 & 2033
- Figure 4: North America Molluscicides Industry Revenue (million), by Consumption Analysis 2025 & 2033
- Figure 5: North America Molluscicides Industry Revenue Share (%), by Consumption Analysis 2025 & 2033
- Figure 6: North America Molluscicides Industry Revenue (million), by Import Market Analysis (Value & Volume) 2025 & 2033
- Figure 7: North America Molluscicides Industry Revenue Share (%), by Import Market Analysis (Value & Volume) 2025 & 2033
- Figure 8: North America Molluscicides Industry Revenue (million), by Export Market Analysis (Value & Volume) 2025 & 2033
- Figure 9: North America Molluscicides Industry Revenue Share (%), by Export Market Analysis (Value & Volume) 2025 & 2033
- Figure 10: North America Molluscicides Industry Revenue (million), by Price Trend Analysis 2025 & 2033
- Figure 11: North America Molluscicides Industry Revenue Share (%), by Price Trend Analysis 2025 & 2033
- Figure 12: North America Molluscicides Industry Revenue (million), by Country 2025 & 2033
- Figure 13: North America Molluscicides Industry Revenue Share (%), by Country 2025 & 2033
- Figure 14: South America Molluscicides Industry Revenue (million), by Production Analysis 2025 & 2033
- Figure 15: South America Molluscicides Industry Revenue Share (%), by Production Analysis 2025 & 2033
- Figure 16: South America Molluscicides Industry Revenue (million), by Consumption Analysis 2025 & 2033
- Figure 17: South America Molluscicides Industry Revenue Share (%), by Consumption Analysis 2025 & 2033
- Figure 18: South America Molluscicides Industry Revenue (million), by Import Market Analysis (Value & Volume) 2025 & 2033
- Figure 19: South America Molluscicides Industry Revenue Share (%), by Import Market Analysis (Value & Volume) 2025 & 2033
- Figure 20: South America Molluscicides Industry Revenue (million), by Export Market Analysis (Value & Volume) 2025 & 2033
- Figure 21: South America Molluscicides Industry Revenue Share (%), by Export Market Analysis (Value & Volume) 2025 & 2033
- Figure 22: South America Molluscicides Industry Revenue (million), by Price Trend Analysis 2025 & 2033
- Figure 23: South America Molluscicides Industry Revenue Share (%), by Price Trend Analysis 2025 & 2033
- Figure 24: South America Molluscicides Industry Revenue (million), by Country 2025 & 2033
- Figure 25: South America Molluscicides Industry Revenue Share (%), by Country 2025 & 2033
- Figure 26: Europe Molluscicides Industry Revenue (million), by Production Analysis 2025 & 2033
- Figure 27: Europe Molluscicides Industry Revenue Share (%), by Production Analysis 2025 & 2033
- Figure 28: Europe Molluscicides Industry Revenue (million), by Consumption Analysis 2025 & 2033
- Figure 29: Europe Molluscicides Industry Revenue Share (%), by Consumption Analysis 2025 & 2033
- Figure 30: Europe Molluscicides Industry Revenue (million), by Import Market Analysis (Value & Volume) 2025 & 2033
- Figure 31: Europe Molluscicides Industry Revenue Share (%), by Import Market Analysis (Value & Volume) 2025 & 2033
- Figure 32: Europe Molluscicides Industry Revenue (million), by Export Market Analysis (Value & Volume) 2025 & 2033
- Figure 33: Europe Molluscicides Industry Revenue Share (%), by Export Market Analysis (Value & Volume) 2025 & 2033
- Figure 34: Europe Molluscicides Industry Revenue (million), by Price Trend Analysis 2025 & 2033
- Figure 35: Europe Molluscicides Industry Revenue Share (%), by Price Trend Analysis 2025 & 2033
- Figure 36: Europe Molluscicides Industry Revenue (million), by Country 2025 & 2033
- Figure 37: Europe Molluscicides Industry Revenue Share (%), by Country 2025 & 2033
- Figure 38: Middle East & Africa Molluscicides Industry Revenue (million), by Production Analysis 2025 & 2033
- Figure 39: Middle East & Africa Molluscicides Industry Revenue Share (%), by Production Analysis 2025 & 2033
- Figure 40: Middle East & Africa Molluscicides Industry Revenue (million), by Consumption Analysis 2025 & 2033
- Figure 41: Middle East & Africa Molluscicides Industry Revenue Share (%), by Consumption Analysis 2025 & 2033
- Figure 42: Middle East & Africa Molluscicides Industry Revenue (million), by Import Market Analysis (Value & Volume) 2025 & 2033
- Figure 43: Middle East & Africa Molluscicides Industry Revenue Share (%), by Import Market Analysis (Value & Volume) 2025 & 2033
- Figure 44: Middle East & Africa Molluscicides Industry Revenue (million), by Export Market Analysis (Value & Volume) 2025 & 2033
- Figure 45: Middle East & Africa Molluscicides Industry Revenue Share (%), by Export Market Analysis (Value & Volume) 2025 & 2033
- Figure 46: Middle East & Africa Molluscicides Industry Revenue (million), by Price Trend Analysis 2025 & 2033
- Figure 47: Middle East & Africa Molluscicides Industry Revenue Share (%), by Price Trend Analysis 2025 & 2033
- Figure 48: Middle East & Africa Molluscicides Industry Revenue (million), by Country 2025 & 2033
- Figure 49: Middle East & Africa Molluscicides Industry Revenue Share (%), by Country 2025 & 2033
- Figure 50: Asia Pacific Molluscicides Industry Revenue (million), by Production Analysis 2025 & 2033
- Figure 51: Asia Pacific Molluscicides Industry Revenue Share (%), by Production Analysis 2025 & 2033
- Figure 52: Asia Pacific Molluscicides Industry Revenue (million), by Consumption Analysis 2025 & 2033
- Figure 53: Asia Pacific Molluscicides Industry Revenue Share (%), by Consumption Analysis 2025 & 2033
- Figure 54: Asia Pacific Molluscicides Industry Revenue (million), by Import Market Analysis (Value & Volume) 2025 & 2033
- Figure 55: Asia Pacific Molluscicides Industry Revenue Share (%), by Import Market Analysis (Value & Volume) 2025 & 2033
- Figure 56: Asia Pacific Molluscicides Industry Revenue (million), by Export Market Analysis (Value & Volume) 2025 & 2033
- Figure 57: Asia Pacific Molluscicides Industry Revenue Share (%), by Export Market Analysis (Value & Volume) 2025 & 2033
- Figure 58: Asia Pacific Molluscicides Industry Revenue (million), by Price Trend Analysis 2025 & 2033
- Figure 59: Asia Pacific Molluscicides Industry Revenue Share (%), by Price Trend Analysis 2025 & 2033
- Figure 60: Asia Pacific Molluscicides Industry Revenue (million), by Country 2025 & 2033
- Figure 61: Asia Pacific Molluscicides Industry Revenue Share (%), by Country 2025 & 2033
List of Tables
- Table 1: Global Molluscicides Industry Revenue million Forecast, by Production Analysis 2020 & 2033
- Table 2: Global Molluscicides Industry Revenue million Forecast, by Consumption Analysis 2020 & 2033
- Table 3: Global Molluscicides Industry Revenue million Forecast, by Import Market Analysis (Value & Volume) 2020 & 2033
- Table 4: Global Molluscicides Industry Revenue million Forecast, by Export Market Analysis (Value & Volume) 2020 & 2033
- Table 5: Global Molluscicides Industry Revenue million Forecast, by Price Trend Analysis 2020 & 2033
- Table 6: Global Molluscicides Industry Revenue million Forecast, by Region 2020 & 2033
- Table 7: Global Molluscicides Industry Revenue million Forecast, by Production Analysis 2020 & 2033
- Table 8: Global Molluscicides Industry Revenue million Forecast, by Consumption Analysis 2020 & 2033
- Table 9: Global Molluscicides Industry Revenue million Forecast, by Import Market Analysis (Value & Volume) 2020 & 2033
- Table 10: Global Molluscicides Industry Revenue million Forecast, by Export Market Analysis (Value & Volume) 2020 & 2033
- Table 11: Global Molluscicides Industry Revenue million Forecast, by Price Trend Analysis 2020 & 2033
- Table 12: Global Molluscicides Industry Revenue million Forecast, by Country 2020 & 2033
- Table 13: United States Molluscicides Industry Revenue (million) Forecast, by Application 2020 & 2033
- Table 14: Canada Molluscicides Industry Revenue (million) Forecast, by Application 2020 & 2033
- Table 15: Mexico Molluscicides Industry Revenue (million) Forecast, by Application 2020 & 2033
- Table 16: Global Molluscicides Industry Revenue million Forecast, by Production Analysis 2020 & 2033
- Table 17: Global Molluscicides Industry Revenue million Forecast, by Consumption Analysis 2020 & 2033
- Table 18: Global Molluscicides Industry Revenue million Forecast, by Import Market Analysis (Value & Volume) 2020 & 2033
- Table 19: Global Molluscicides Industry Revenue million Forecast, by Export Market Analysis (Value & Volume) 2020 & 2033
- Table 20: Global Molluscicides Industry Revenue million Forecast, by Price Trend Analysis 2020 & 2033
- Table 21: Global Molluscicides Industry Revenue million Forecast, by Country 2020 & 2033
- Table 22: Brazil Molluscicides Industry Revenue (million) Forecast, by Application 2020 & 2033
- Table 23: Argentina Molluscicides Industry Revenue (million) Forecast, by Application 2020 & 2033
- Table 24: Rest of South America Molluscicides Industry Revenue (million) Forecast, by Application 2020 & 2033
- Table 25: Global Molluscicides Industry Revenue million Forecast, by Production Analysis 2020 & 2033
- Table 26: Global Molluscicides Industry Revenue million Forecast, by Consumption Analysis 2020 & 2033
- Table 27: Global Molluscicides Industry Revenue million Forecast, by Import Market Analysis (Value & Volume) 2020 & 2033
- Table 28: Global Molluscicides Industry Revenue million Forecast, by Export Market Analysis (Value & Volume) 2020 & 2033
- Table 29: Global Molluscicides Industry Revenue million Forecast, by Price Trend Analysis 2020 & 2033
- Table 30: Global Molluscicides Industry Revenue million Forecast, by Country 2020 & 2033
- Table 31: United Kingdom Molluscicides Industry Revenue (million) Forecast, by Application 2020 & 2033
- Table 32: Germany Molluscicides Industry Revenue (million) Forecast, by Application 2020 & 2033
- Table 33: France Molluscicides Industry Revenue (million) Forecast, by Application 2020 & 2033
- Table 34: Italy Molluscicides Industry Revenue (million) Forecast, by Application 2020 & 2033
- Table 35: Spain Molluscicides Industry Revenue (million) Forecast, by Application 2020 & 2033
- Table 36: Russia Molluscicides Industry Revenue (million) Forecast, by Application 2020 & 2033
- Table 37: Benelux Molluscicides Industry Revenue (million) Forecast, by Application 2020 & 2033
- Table 38: Nordics Molluscicides Industry Revenue (million) Forecast, by Application 2020 & 2033
- Table 39: Rest of Europe Molluscicides Industry Revenue (million) Forecast, by Application 2020 & 2033
- Table 40: Global Molluscicides Industry Revenue million Forecast, by Production Analysis 2020 & 2033
- Table 41: Global Molluscicides Industry Revenue million Forecast, by Consumption Analysis 2020 & 2033
- Table 42: Global Molluscicides Industry Revenue million Forecast, by Import Market Analysis (Value & Volume) 2020 & 2033
- Table 43: Global Molluscicides Industry Revenue million Forecast, by Export Market Analysis (Value & Volume) 2020 & 2033
- Table 44: Global Molluscicides Industry Revenue million Forecast, by Price Trend Analysis 2020 & 2033
- Table 45: Global Molluscicides Industry Revenue million Forecast, by Country 2020 & 2033
- Table 46: Turkey Molluscicides Industry Revenue (million) Forecast, by Application 2020 & 2033
- Table 47: Israel Molluscicides Industry Revenue (million) Forecast, by Application 2020 & 2033
- Table 48: GCC Molluscicides Industry Revenue (million) Forecast, by Application 2020 & 2033
- Table 49: North Africa Molluscicides Industry Revenue (million) Forecast, by Application 2020 & 2033
- Table 50: South Africa Molluscicides Industry Revenue (million) Forecast, by Application 2020 & 2033
- Table 51: Rest of Middle East & Africa Molluscicides Industry Revenue (million) Forecast, by Application 2020 & 2033
- Table 52: Global Molluscicides Industry Revenue million Forecast, by Production Analysis 2020 & 2033
- Table 53: Global Molluscicides Industry Revenue million Forecast, by Consumption Analysis 2020 & 2033
- Table 54: Global Molluscicides Industry Revenue million Forecast, by Import Market Analysis (Value & Volume) 2020 & 2033
- Table 55: Global Molluscicides Industry Revenue million Forecast, by Export Market Analysis (Value & Volume) 2020 & 2033
- Table 56: Global Molluscicides Industry Revenue million Forecast, by Price Trend Analysis 2020 & 2033
- Table 57: Global Molluscicides Industry Revenue million Forecast, by Country 2020 & 2033
- Table 58: China Molluscicides Industry Revenue (million) Forecast, by Application 2020 & 2033
- Table 59: India Molluscicides Industry Revenue (million) Forecast, by Application 2020 & 2033
- Table 60: Japan Molluscicides Industry Revenue (million) Forecast, by Application 2020 & 2033
- Table 61: South Korea Molluscicides Industry Revenue (million) Forecast, by Application 2020 & 2033
- Table 62: ASEAN Molluscicides Industry Revenue (million) Forecast, by Application 2020 & 2033
- Table 63: Oceania Molluscicides Industry Revenue (million) Forecast, by Application 2020 & 2033
- Table 64: Rest of Asia Pacific Molluscicides Industry Revenue (million) Forecast, by Application 2020 & 2033
Frequently Asked Questions
1. What is the projected Compound Annual Growth Rate (CAGR) of the Molluscicides Industry?
The projected CAGR is approximately 9.67%.
2. Which companies are prominent players in the Molluscicides Industry?
Key companies in the market include American Vanguard Corporation, PI Industries, Arxada, Liphatech Inc, W Neudorff GmbH K, Mitsui & Co Ltd (Certis Belchim), UPL Limited, Nufarm Ltd.
3. What are the main segments of the Molluscicides Industry?
The market segments include Production Analysis, Consumption Analysis, Import Market Analysis (Value & Volume), Export Market Analysis (Value & Volume), Price Trend Analysis.
4. Can you provide details about the market size?
The market size is estimated to be USD 837.82 million as of 2022.
5. What are some drivers contributing to market growth?
Seed Treatment As A Solution To Enhance Yield; Growing Awareness For Seed Treatment Among The Farmers; Rising Trend Of Organic Farming.
6. What are the notable trends driving market growth?
South America dominated the global molluscicide market.
7. Are there any restraints impacting market growth?
Limitations Across Farm-Level Seed Treatment; Rising Environmental Concerns.
8. Can you provide examples of recent developments in the market?
November 2022: Certis Belchim BV acquired the assets of Henry Manufacturing Limited in New Zealand. This includes its portfolio and pipeline of potassium fatty-acid salts, which have various applications in crop protection.March 2022: A new company called Certis Belchim BV was formed by Mitsui & Co. Ltd by merging its recently acquired Belchim Crop Protection and its European subsidiary Certis Europe. This was done in accordance with the terms of a definitive agreement.June 2021: Belchim Crop Protection was fully acquired by Mitsui & Co. Ltd after purchasing the remaining 32% of shares owned by Belchim Management NV/SA. Mitsui now holds a 62% stake in Belchim Crop Protection alongside ISK and Mitsui Chemicals Agro. This acquisition allows Mitsui to focus on establishing a sustainable crop protection company in Europe.
9. What pricing options are available for accessing the report?
Pricing options include single-user, multi-user, and enterprise licenses priced at USD 3800, USD 4500, and USD 5800 respectively.
10. Is the market size provided in terms of value or volume?
The market size is provided in terms of value, measured in million.
11. Are there any specific market keywords associated with the report?
Yes, the market keyword associated with the report is "Molluscicides Industry," which aids in identifying and referencing the specific market segment covered.
12. How do I determine which pricing option suits my needs best?
The pricing options vary based on user requirements and access needs. Individual users may opt for single-user licenses, while businesses requiring broader access may choose multi-user or enterprise licenses for cost-effective access to the report.
13. Are there any additional resources or data provided in the Molluscicides Industry report?
While the report offers comprehensive insights, it's advisable to review the specific contents or supplementary materials provided to ascertain if additional resources or data are available.
14. How can I stay updated on further developments or reports in the Molluscicides Industry?
To stay informed about further developments, trends, and reports in the Molluscicides Industry, consider subscribing to industry newsletters, following relevant companies and organizations, or regularly checking reputable industry news sources and publications.
Methodology
Step 1 - Identification of Relevant Samples Size from Population Database


Step 2 - Approaches for Defining Global Market Size (Value, Volume* & Price*)

Note*: In applicable scenarios
Step 3 - Data Sources
Primary Research
- Web Analytics
- Survey Reports
- Research Institute
- Latest Research Reports
- Opinion Leaders
Secondary Research
- Annual Reports
- White Paper
- Latest Press Release
- Industry Association
- Paid Database
- Investor Presentations

Step 4 - Data Triangulation
Involves using different sources of information in order to increase the validity of a study
These sources are likely to be stakeholders in a program - participants, other researchers, program staff, other community members, and so on.
Then we put all data in single framework & apply various statistical tools to find out the dynamic on the market.
During the analysis stage, feedback from the stakeholder groups would be compared to determine areas of agreement as well as areas of divergence