

Key Insights
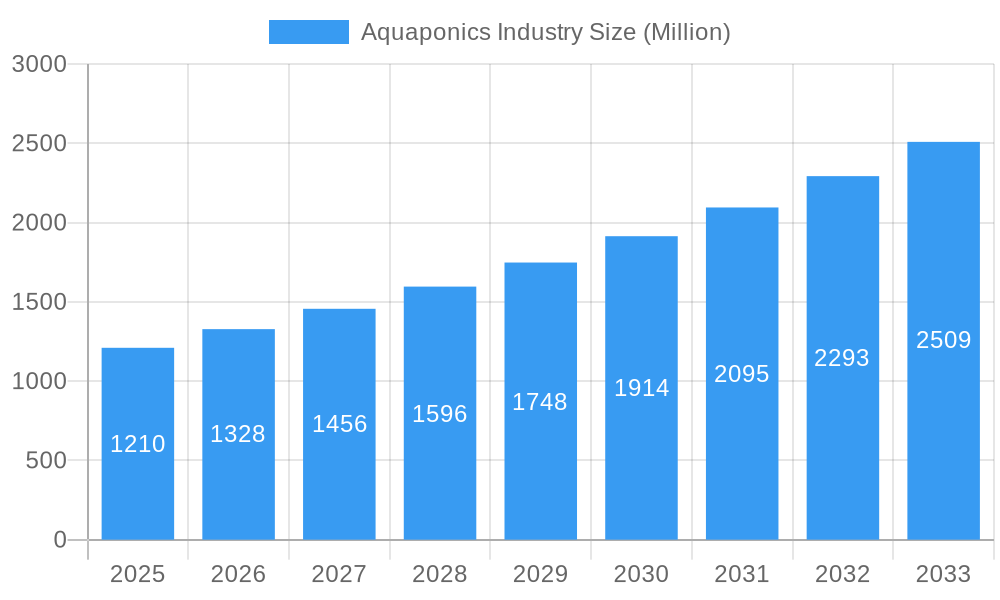
The global aquaponics market, valued at $1.21 billion in 2025, is projected to experience robust growth, exhibiting a compound annual growth rate (CAGR) of 9.60% from 2025 to 2033. This expansion is fueled by several key factors. Increasing consumer demand for sustainably produced, high-quality food is a significant driver. Aquaponics offers a solution by combining aquaculture (fish farming) and hydroponics (soilless plant cultivation) in a closed-loop system, minimizing water usage and reducing reliance on chemical fertilizers and pesticides. Growing concerns about food security and the environmental impact of conventional farming methods further bolster the market's appeal. Technological advancements, including automation and sophisticated water management systems, are also contributing to increased efficiency and scalability within the industry. The market segmentation reveals a diverse landscape, with various ebb and flow systems (NFT, DWC), facility types (greenhouses, vertical farms), and fish species being cultivated. The geographical distribution showcases strong growth potential across regions, notably in North America and Asia Pacific, driven by favorable government policies promoting sustainable agriculture and rising disposable incomes. However, challenges remain, including the high initial investment costs associated with setting up aquaponics systems and the need for specialized expertise in both aquaculture and hydroponics. Nevertheless, ongoing innovation and increasing consumer awareness are expected to overcome these hurdles, leading to continued market expansion in the coming years.
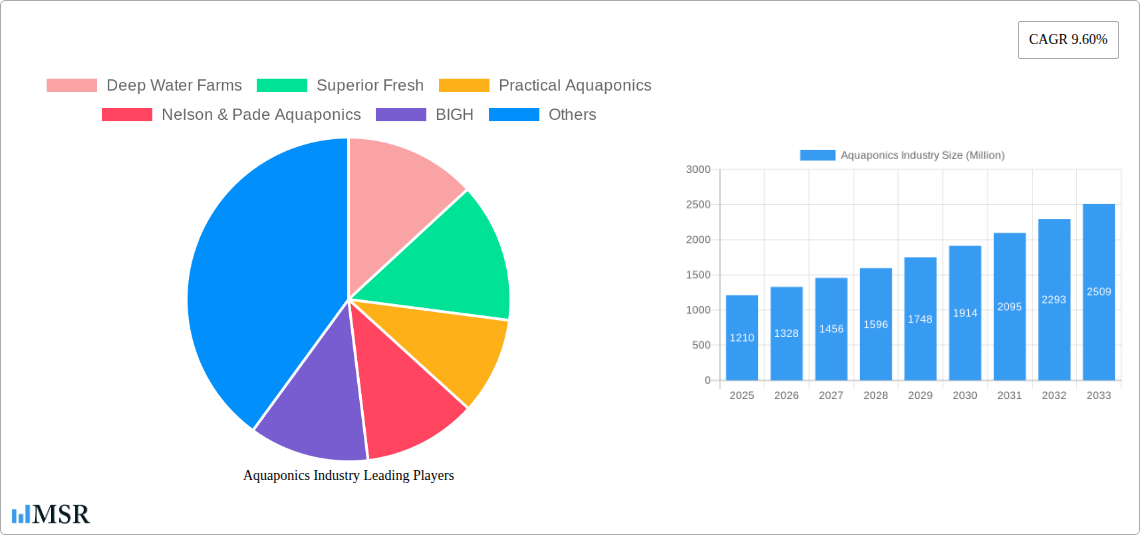
Aquaponics Industry Market Size (In Billion)
The competitive landscape is characterized by a mix of established players and emerging companies. Established players like Pentair Aquatic Eco-System Inc (PAES) leverage their existing expertise in aquaculture technology, while smaller companies such as Deep Water Farms and Superior Fresh are focusing on niche markets and innovative solutions. The industry is witnessing a rise in vertical farming initiatives that aim to maximize space utilization and production efficiency, particularly in urban areas. Further research into optimizing different growing systems (media-filled beds, etc.) and fish species will contribute to enhancing productivity and profitability, while addressing regional specific needs and environmental conditions. Future growth will likely be driven by successful partnerships between technology providers, aquaponics farms, and retailers, creating robust supply chains that enhance product accessibility and consumer awareness. Government incentives, educational programs focused on aquaponics techniques, and consumer education campaigns will also play a critical role in shaping the long-term trajectory of this burgeoning market.
Aquaponics Industry Company Market Share
Aquaponics Industry: A Comprehensive Market Report (2019-2033)
This comprehensive report provides an in-depth analysis of the global aquaponics industry, projecting a market value exceeding $XX Million by 2033. The study covers the period 2019-2033, with a base year of 2025 and a forecast period of 2025-2033. It offers actionable insights for industry stakeholders, investors, and entrepreneurs seeking to navigate this rapidly evolving sector. Key segments analyzed include Ebb and Flow, NFT, DWC systems across various facility types (poly/glass greenhouses, indoor vertical farms), fish types (tilapia, catfish, carp, trout, etc.), and growing media. Leading players like Deep Water Farms, Superior Fresh, and Pentair Aquatic Eco-System Inc. are profiled, highlighting their market share and strategies.
Aquaponics Industry Market Concentration & Dynamics
The global aquaponics market exhibits a moderately concentrated landscape, with a few large players holding significant market share alongside numerous smaller, regional operators. Deep Water Farms and Superior Fresh are estimated to collectively control approximately xx% of the market in 2025. The industry is characterized by a dynamic innovation ecosystem, with ongoing developments in automation, water management, and integrated systems. Regulatory frameworks vary significantly across regions, impacting market entry and operational costs. Substitute products, such as conventional agriculture, pose a competitive challenge, particularly in terms of price. However, growing consumer demand for sustainable and locally sourced food is a major tailwind. The historical period (2019-2024) witnessed approximately xx M&A deals, indicating industry consolidation. This trend is expected to continue through 2033, driving further market concentration.
- Market Share (2025): Deep Water Farms (xx%), Superior Fresh (xx%), Others (xx%)
- M&A Deal Count (2019-2024): xx
- Key Regulatory Factors: Vary by region, impacting operational costs and market entry.
Aquaponics Industry Insights & Trends
The global aquaponics market is experiencing robust growth, driven by increasing consumer awareness of sustainable food production, coupled with rising demand for fresh produce and high-quality fish. The market size was valued at $XX Million in 2025 and is projected to reach $XX Million by 2033, exhibiting a CAGR of xx%. Technological advancements in automation, precision control systems, and data analytics are streamlining operations and enhancing efficiency. Changing consumer preferences toward healthy, eco-friendly food options significantly influence market expansion. The shift towards urban farming and vertical agriculture is creating new opportunities for aquaponics, particularly in densely populated areas. The increasing adoption of sustainable practices across the food industry further fuels market growth. The adoption of innovative technologies, such as AI-powered monitoring systems and automation solutions, is also a crucial factor driving market expansion.
Key Markets & Segments Leading Aquaponics Industry
The North American region currently dominates the global aquaponics market, driven by strong consumer demand for sustainable food and the presence of established players like Deep Water Farms and Superior Fresh. Within segments, the Ebb and Flow system holds the largest market share due to its relative simplicity and cost-effectiveness. Tilapia is the most commonly cultivated fish species, given its fast growth rate and suitability for aquaponics. Poly greenhouses are the prevalent facility type, owing to their cost-effectiveness and scalability.
Key Growth Drivers:
- Strong consumer demand for sustainable food: Growing awareness of environmental and health concerns.
- Technological advancements: Automation, data analytics, and precision control systems.
- Government support and subsidies: Incentives for sustainable agriculture.
- Increasing urbanization: Growing demand for local food sources in urban areas.
Dominance Analysis:
The North American market's dominance is attributed to robust consumer demand, technological infrastructure, and well-established players. The Ebb and Flow system's popularity stems from ease of operation and scalability. Tilapia’s preference is due to its rapid growth and adaptability.
Aquaponics Industry Product Developments
Recent years have witnessed significant product innovations, including automated feeding and water management systems, advanced sensors for monitoring water quality and fish health, and integrated software platforms for data analysis and process optimization. These advancements enhance efficiency, reduce operational costs, and improve overall productivity. The development of modular and scalable systems is making aquaponics accessible to a wider range of users, from small-scale home growers to large-scale commercial operations. The integration of renewable energy sources, such as solar power, is further enhancing the sustainability of aquaponic systems.
Challenges in the Aquaponics Industry Market
Several factors hinder aquaponics market expansion, including the high initial investment costs associated with setting up systems, the need for specialized knowledge and expertise for successful operation, and the potential for disease outbreaks impacting fish and plant health. Supply chain disruptions related to equipment and consumables can also significantly impact operations. Furthermore, competition from established agricultural practices poses a challenge, particularly in terms of price competitiveness. These factors combined may be holding back the market growth by xx% annually.
Forces Driving Aquaponics Industry Growth
Technological advancements like AI-powered monitoring, automation, and precise environmental control systems enhance efficiency and profitability, driving growth. Favorable government policies and subsidies encourage adoption, while the rising demand for sustainable and locally sourced food fuels market expansion. Moreover, the increasing adoption of vertical farming techniques allows for efficient space utilization and increased production capacity in urban areas.
Long-Term Growth Catalysts
Long-term growth hinges on ongoing technological innovation, strategic partnerships between technology providers and aquaponics operators, and expansion into new geographic markets, particularly in developing countries with growing populations and limited agricultural resources. The development of resilient, disease-resistant fish strains will also play a crucial role in minimizing risk and enhancing productivity. Investments in research and development to further optimize systems and reduce production costs are essential.
Emerging Opportunities in Aquaponics Industry
Emerging opportunities lie in integrating aquaponics with other sustainable food production methods, such as vertical farming and hydroponics, to create truly integrated food systems. The development of specialized aquaponic systems for specific crops and fish species presents exciting growth potential. Furthermore, exploring new markets in developing nations with water scarcity and food security challenges can significantly contribute to market expansion. There is potential to explore novel applications, such as creating closed-loop systems for space exploration.
Leading Players in the Aquaponics Industry Sector
- Deep Water Farms
- Superior Fresh
- Practical Aquaponics
- Nelson & Pade Aquaponics
- BIGH
- ECF Farm Berli
- Garden City Aquaponics Inc
- Aquaponics USA
- Madhavi Farms
- Ouroboros Farms
- Pentair Aquatic Eco-System Inc (PAES)
Key Milestones in Aquaponics Industry Industry
- 2020: Introduction of AI-powered monitoring systems by several key players.
- 2022: Significant investment in research and development focusing on disease resistance in fish.
- 2023: Several large-scale commercial aquaponics facilities are established.
- 2024: A major merger between two key players consolidated market share.
Strategic Outlook for Aquaponics Industry Market
The aquaponics market presents significant future potential, driven by the convergence of technological innovation, growing consumer demand, and increasing government support for sustainable food production. Strategic opportunities exist in developing efficient, cost-effective systems, expanding into new markets, and forming strategic partnerships to accelerate growth and scale. Focus on research and development, particularly in areas like disease resistance and water management, will be crucial for long-term success. Companies that successfully integrate technology, sustainability, and scalability will be best positioned for market leadership.
Aquaponics Industry Segmentation
- 1. Production Analysis
- 2. Consumption Analysis
- 3. Import Market Analysis (Value & Volume)
- 4. Export Market Analysis (Value & Volume)
- 5. Price Trend Analysis
Aquaponics Industry Segmentation By Geography
-
1. North America
- 1.1. United States
- 1.2. Canada
- 1.3. Mexico
-
2. South America
- 2.1. Brazil
- 2.2. Argentina
- 2.3. Rest of South America
-
3. Europe
- 3.1. United Kingdom
- 3.2. Germany
- 3.3. France
- 3.4. Italy
- 3.5. Spain
- 3.6. Russia
- 3.7. Benelux
- 3.8. Nordics
- 3.9. Rest of Europe
-
4. Middle East & Africa
- 4.1. Turkey
- 4.2. Israel
- 4.3. GCC
- 4.4. North Africa
- 4.5. South Africa
- 4.6. Rest of Middle East & Africa
-
5. Asia Pacific
- 5.1. China
- 5.2. India
- 5.3. Japan
- 5.4. South Korea
- 5.5. ASEAN
- 5.6. Oceania
- 5.7. Rest of Asia Pacific
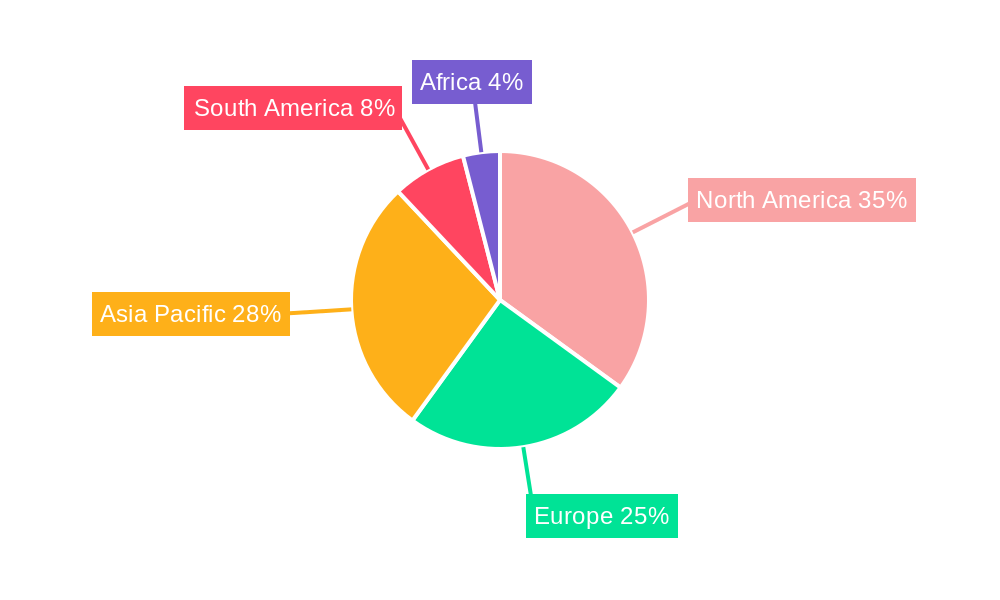
Aquaponics Industry Regional Market Share
Geographic Coverage of Aquaponics Industry
Aquaponics Industry REPORT HIGHLIGHTS
| Aspects | Details |
|---|---|
| Study Period | 2020-2034 |
| Base Year | 2025 |
| Estimated Year | 2026 |
| Forecast Period | 2026-2034 |
| Historical Period | 2020-2025 |
| Growth Rate | CAGR of 9.60% from 2020-2034 |
| Segmentation |
|
Table of Contents
- 1. Introduction
- 1.1. Research Scope
- 1.2. Market Segmentation
- 1.3. Research Objective
- 1.4. Definitions and Assumptions
- 2. Executive Summary
- 2.1. Market Snapshot
- 3. Market Dynamics
- 3.1. Market Drivers
- 3.2. Market Restrains
- 3.3. Market Trends
- 3.4. Market Opportunities
- 4. Market Factor Analysis
- 4.1. Porters Five Forces
- 4.1.1. Bargaining Power of Suppliers
- 4.1.2. Bargaining Power of Buyers
- 4.1.3. Threat of New Entrants
- 4.1.4. Threat of Substitutes
- 4.1.5. Competitive Rivalry
- 4.2. PESTEL analysis
- 4.3. BCG Analysis
- 4.3.1. Stars (High Growth, High Market Share)
- 4.3.2. Cash Cows (Low Growth, High Market Share)
- 4.3.3. Question Mark (High Growth, Low Market Share)
- 4.3.4. Dogs (Low Growth, Low Market Share)
- 4.4. Ansoff Matrix Analysis
- 4.5. Supply Chain Analysis
- 4.6. Regulatory Landscape
- 4.7. Current Market Potential and Opportunity Assessment (TAM–SAM–SOM Framework)
- 4.8. MSR Analyst Note
- 4.1. Porters Five Forces
- 5. Market Analysis, Insights and Forecast 2021-2033
- 5.1. Market Analysis, Insights and Forecast - by Production Analysis
- 5.2. Market Analysis, Insights and Forecast - by Consumption Analysis
- 5.3. Market Analysis, Insights and Forecast - by Import Market Analysis (Value & Volume)
- 5.4. Market Analysis, Insights and Forecast - by Export Market Analysis (Value & Volume)
- 5.5. Market Analysis, Insights and Forecast - by Price Trend Analysis
- 5.6. Market Analysis, Insights and Forecast - by Region
- 5.6.1. North America
- 5.6.2. South America
- 5.6.3. Europe
- 5.6.4. Middle East & Africa
- 5.6.5. Asia Pacific
- 6. Global Aquaponics Industry Analysis, Insights and Forecast, 2021-2033
- 6.1. Market Analysis, Insights and Forecast - by Production Analysis
- 6.2. Market Analysis, Insights and Forecast - by Consumption Analysis
- 6.3. Market Analysis, Insights and Forecast - by Import Market Analysis (Value & Volume)
- 6.4. Market Analysis, Insights and Forecast - by Export Market Analysis (Value & Volume)
- 6.5. Market Analysis, Insights and Forecast - by Price Trend Analysis
- 7. North America Aquaponics Industry Analysis, Insights and Forecast, 2020-2032
- 7.1. Market Analysis, Insights and Forecast - by Production Analysis
- 7.2. Market Analysis, Insights and Forecast - by Consumption Analysis
- 7.3. Market Analysis, Insights and Forecast - by Import Market Analysis (Value & Volume)
- 7.4. Market Analysis, Insights and Forecast - by Export Market Analysis (Value & Volume)
- 7.5. Market Analysis, Insights and Forecast - by Price Trend Analysis
- 8. South America Aquaponics Industry Analysis, Insights and Forecast, 2020-2032
- 8.1. Market Analysis, Insights and Forecast - by Production Analysis
- 8.2. Market Analysis, Insights and Forecast - by Consumption Analysis
- 8.3. Market Analysis, Insights and Forecast - by Import Market Analysis (Value & Volume)
- 8.4. Market Analysis, Insights and Forecast - by Export Market Analysis (Value & Volume)
- 8.5. Market Analysis, Insights and Forecast - by Price Trend Analysis
- 9. Europe Aquaponics Industry Analysis, Insights and Forecast, 2020-2032
- 9.1. Market Analysis, Insights and Forecast - by Production Analysis
- 9.2. Market Analysis, Insights and Forecast - by Consumption Analysis
- 9.3. Market Analysis, Insights and Forecast - by Import Market Analysis (Value & Volume)
- 9.4. Market Analysis, Insights and Forecast - by Export Market Analysis (Value & Volume)
- 9.5. Market Analysis, Insights and Forecast - by Price Trend Analysis
- 10. Middle East & Africa Aquaponics Industry Analysis, Insights and Forecast, 2020-2032
- 10.1. Market Analysis, Insights and Forecast - by Production Analysis
- 10.2. Market Analysis, Insights and Forecast - by Consumption Analysis
- 10.3. Market Analysis, Insights and Forecast - by Import Market Analysis (Value & Volume)
- 10.4. Market Analysis, Insights and Forecast - by Export Market Analysis (Value & Volume)
- 10.5. Market Analysis, Insights and Forecast - by Price Trend Analysis
- 11. Asia Pacific Aquaponics Industry Analysis, Insights and Forecast, 2020-2032
- 11.1. Market Analysis, Insights and Forecast - by Production Analysis
- 11.2. Market Analysis, Insights and Forecast - by Consumption Analysis
- 11.3. Market Analysis, Insights and Forecast - by Import Market Analysis (Value & Volume)
- 11.4. Market Analysis, Insights and Forecast - by Export Market Analysis (Value & Volume)
- 11.5. Market Analysis, Insights and Forecast - by Price Trend Analysis
- 12. Competitive Analysis
- 12.1. Company Profiles
- 12.1.1 Deep Water Farms
- 12.1.1.1. Company Overview
- 12.1.1.2. Products
- 12.1.1.3. Company Financials
- 12.1.1.4. SWOT Analysis
- 12.1.2 Superior Fresh
- 12.1.2.1. Company Overview
- 12.1.2.2. Products
- 12.1.2.3. Company Financials
- 12.1.2.4. SWOT Analysis
- 12.1.3 Practical Aquaponics
- 12.1.3.1. Company Overview
- 12.1.3.2. Products
- 12.1.3.3. Company Financials
- 12.1.3.4. SWOT Analysis
- 12.1.4 Nelson & Pade Aquaponics
- 12.1.4.1. Company Overview
- 12.1.4.2. Products
- 12.1.4.3. Company Financials
- 12.1.4.4. SWOT Analysis
- 12.1.5 BIGH
- 12.1.5.1. Company Overview
- 12.1.5.2. Products
- 12.1.5.3. Company Financials
- 12.1.5.4. SWOT Analysis
- 12.1.6 ECF Farm Berli
- 12.1.6.1. Company Overview
- 12.1.6.2. Products
- 12.1.6.3. Company Financials
- 12.1.6.4. SWOT Analysis
- 12.1.7 Garden City Aquaponics Inc
- 12.1.7.1. Company Overview
- 12.1.7.2. Products
- 12.1.7.3. Company Financials
- 12.1.7.4. SWOT Analysis
- 12.1.8 Aquaponics USA
- 12.1.8.1. Company Overview
- 12.1.8.2. Products
- 12.1.8.3. Company Financials
- 12.1.8.4. SWOT Analysis
- 12.1.9 Madhavi Farms
- 12.1.9.1. Company Overview
- 12.1.9.2. Products
- 12.1.9.3. Company Financials
- 12.1.9.4. SWOT Analysis
- 12.1.10 Ouroboros Farms
- 12.1.10.1. Company Overview
- 12.1.10.2. Products
- 12.1.10.3. Company Financials
- 12.1.10.4. SWOT Analysis
- 12.1.11 Pentair Aquatic Eco-System Inc (PAES)
- 12.1.11.1. Company Overview
- 12.1.11.2. Products
- 12.1.11.3. Company Financials
- 12.1.11.4. SWOT Analysis
- 12.1.1 Deep Water Farms
- 12.2. Market Entropy
- 12.2.1 Company's Key Areas Served
- 12.2.2 Recent Developments
- 12.3. Company Market Share Analysis 2025
- 12.3.1 Top 5 Companies Market Share Analysis
- 12.3.2 Top 3 Companies Market Share Analysis
- 12.4. List of Potential Customers
- 13. Research Methodology
List of Figures
- Figure 1: Global Aquaponics Industry Revenue Breakdown (Million, %) by Region 2025 & 2033
- Figure 2: North America Aquaponics Industry Revenue (Million), by Production Analysis 2025 & 2033
- Figure 3: North America Aquaponics Industry Revenue Share (%), by Production Analysis 2025 & 2033
- Figure 4: North America Aquaponics Industry Revenue (Million), by Consumption Analysis 2025 & 2033
- Figure 5: North America Aquaponics Industry Revenue Share (%), by Consumption Analysis 2025 & 2033
- Figure 6: North America Aquaponics Industry Revenue (Million), by Import Market Analysis (Value & Volume) 2025 & 2033
- Figure 7: North America Aquaponics Industry Revenue Share (%), by Import Market Analysis (Value & Volume) 2025 & 2033
- Figure 8: North America Aquaponics Industry Revenue (Million), by Export Market Analysis (Value & Volume) 2025 & 2033
- Figure 9: North America Aquaponics Industry Revenue Share (%), by Export Market Analysis (Value & Volume) 2025 & 2033
- Figure 10: North America Aquaponics Industry Revenue (Million), by Price Trend Analysis 2025 & 2033
- Figure 11: North America Aquaponics Industry Revenue Share (%), by Price Trend Analysis 2025 & 2033
- Figure 12: North America Aquaponics Industry Revenue (Million), by Country 2025 & 2033
- Figure 13: North America Aquaponics Industry Revenue Share (%), by Country 2025 & 2033
- Figure 14: South America Aquaponics Industry Revenue (Million), by Production Analysis 2025 & 2033
- Figure 15: South America Aquaponics Industry Revenue Share (%), by Production Analysis 2025 & 2033
- Figure 16: South America Aquaponics Industry Revenue (Million), by Consumption Analysis 2025 & 2033
- Figure 17: South America Aquaponics Industry Revenue Share (%), by Consumption Analysis 2025 & 2033
- Figure 18: South America Aquaponics Industry Revenue (Million), by Import Market Analysis (Value & Volume) 2025 & 2033
- Figure 19: South America Aquaponics Industry Revenue Share (%), by Import Market Analysis (Value & Volume) 2025 & 2033
- Figure 20: South America Aquaponics Industry Revenue (Million), by Export Market Analysis (Value & Volume) 2025 & 2033
- Figure 21: South America Aquaponics Industry Revenue Share (%), by Export Market Analysis (Value & Volume) 2025 & 2033
- Figure 22: South America Aquaponics Industry Revenue (Million), by Price Trend Analysis 2025 & 2033
- Figure 23: South America Aquaponics Industry Revenue Share (%), by Price Trend Analysis 2025 & 2033
- Figure 24: South America Aquaponics Industry Revenue (Million), by Country 2025 & 2033
- Figure 25: South America Aquaponics Industry Revenue Share (%), by Country 2025 & 2033
- Figure 26: Europe Aquaponics Industry Revenue (Million), by Production Analysis 2025 & 2033
- Figure 27: Europe Aquaponics Industry Revenue Share (%), by Production Analysis 2025 & 2033
- Figure 28: Europe Aquaponics Industry Revenue (Million), by Consumption Analysis 2025 & 2033
- Figure 29: Europe Aquaponics Industry Revenue Share (%), by Consumption Analysis 2025 & 2033
- Figure 30: Europe Aquaponics Industry Revenue (Million), by Import Market Analysis (Value & Volume) 2025 & 2033
- Figure 31: Europe Aquaponics Industry Revenue Share (%), by Import Market Analysis (Value & Volume) 2025 & 2033
- Figure 32: Europe Aquaponics Industry Revenue (Million), by Export Market Analysis (Value & Volume) 2025 & 2033
- Figure 33: Europe Aquaponics Industry Revenue Share (%), by Export Market Analysis (Value & Volume) 2025 & 2033
- Figure 34: Europe Aquaponics Industry Revenue (Million), by Price Trend Analysis 2025 & 2033
- Figure 35: Europe Aquaponics Industry Revenue Share (%), by Price Trend Analysis 2025 & 2033
- Figure 36: Europe Aquaponics Industry Revenue (Million), by Country 2025 & 2033
- Figure 37: Europe Aquaponics Industry Revenue Share (%), by Country 2025 & 2033
- Figure 38: Middle East & Africa Aquaponics Industry Revenue (Million), by Production Analysis 2025 & 2033
- Figure 39: Middle East & Africa Aquaponics Industry Revenue Share (%), by Production Analysis 2025 & 2033
- Figure 40: Middle East & Africa Aquaponics Industry Revenue (Million), by Consumption Analysis 2025 & 2033
- Figure 41: Middle East & Africa Aquaponics Industry Revenue Share (%), by Consumption Analysis 2025 & 2033
- Figure 42: Middle East & Africa Aquaponics Industry Revenue (Million), by Import Market Analysis (Value & Volume) 2025 & 2033
- Figure 43: Middle East & Africa Aquaponics Industry Revenue Share (%), by Import Market Analysis (Value & Volume) 2025 & 2033
- Figure 44: Middle East & Africa Aquaponics Industry Revenue (Million), by Export Market Analysis (Value & Volume) 2025 & 2033
- Figure 45: Middle East & Africa Aquaponics Industry Revenue Share (%), by Export Market Analysis (Value & Volume) 2025 & 2033
- Figure 46: Middle East & Africa Aquaponics Industry Revenue (Million), by Price Trend Analysis 2025 & 2033
- Figure 47: Middle East & Africa Aquaponics Industry Revenue Share (%), by Price Trend Analysis 2025 & 2033
- Figure 48: Middle East & Africa Aquaponics Industry Revenue (Million), by Country 2025 & 2033
- Figure 49: Middle East & Africa Aquaponics Industry Revenue Share (%), by Country 2025 & 2033
- Figure 50: Asia Pacific Aquaponics Industry Revenue (Million), by Production Analysis 2025 & 2033
- Figure 51: Asia Pacific Aquaponics Industry Revenue Share (%), by Production Analysis 2025 & 2033
- Figure 52: Asia Pacific Aquaponics Industry Revenue (Million), by Consumption Analysis 2025 & 2033
- Figure 53: Asia Pacific Aquaponics Industry Revenue Share (%), by Consumption Analysis 2025 & 2033
- Figure 54: Asia Pacific Aquaponics Industry Revenue (Million), by Import Market Analysis (Value & Volume) 2025 & 2033
- Figure 55: Asia Pacific Aquaponics Industry Revenue Share (%), by Import Market Analysis (Value & Volume) 2025 & 2033
- Figure 56: Asia Pacific Aquaponics Industry Revenue (Million), by Export Market Analysis (Value & Volume) 2025 & 2033
- Figure 57: Asia Pacific Aquaponics Industry Revenue Share (%), by Export Market Analysis (Value & Volume) 2025 & 2033
- Figure 58: Asia Pacific Aquaponics Industry Revenue (Million), by Price Trend Analysis 2025 & 2033
- Figure 59: Asia Pacific Aquaponics Industry Revenue Share (%), by Price Trend Analysis 2025 & 2033
- Figure 60: Asia Pacific Aquaponics Industry Revenue (Million), by Country 2025 & 2033
- Figure 61: Asia Pacific Aquaponics Industry Revenue Share (%), by Country 2025 & 2033
List of Tables
- Table 1: Global Aquaponics Industry Revenue Million Forecast, by Production Analysis 2020 & 2033
- Table 2: Global Aquaponics Industry Revenue Million Forecast, by Consumption Analysis 2020 & 2033
- Table 3: Global Aquaponics Industry Revenue Million Forecast, by Import Market Analysis (Value & Volume) 2020 & 2033
- Table 4: Global Aquaponics Industry Revenue Million Forecast, by Export Market Analysis (Value & Volume) 2020 & 2033
- Table 5: Global Aquaponics Industry Revenue Million Forecast, by Price Trend Analysis 2020 & 2033
- Table 6: Global Aquaponics Industry Revenue Million Forecast, by Region 2020 & 2033
- Table 7: Global Aquaponics Industry Revenue Million Forecast, by Production Analysis 2020 & 2033
- Table 8: Global Aquaponics Industry Revenue Million Forecast, by Consumption Analysis 2020 & 2033
- Table 9: Global Aquaponics Industry Revenue Million Forecast, by Import Market Analysis (Value & Volume) 2020 & 2033
- Table 10: Global Aquaponics Industry Revenue Million Forecast, by Export Market Analysis (Value & Volume) 2020 & 2033
- Table 11: Global Aquaponics Industry Revenue Million Forecast, by Price Trend Analysis 2020 & 2033
- Table 12: Global Aquaponics Industry Revenue Million Forecast, by Country 2020 & 2033
- Table 13: United States Aquaponics Industry Revenue (Million) Forecast, by Application 2020 & 2033
- Table 14: Canada Aquaponics Industry Revenue (Million) Forecast, by Application 2020 & 2033
- Table 15: Mexico Aquaponics Industry Revenue (Million) Forecast, by Application 2020 & 2033
- Table 16: Global Aquaponics Industry Revenue Million Forecast, by Production Analysis 2020 & 2033
- Table 17: Global Aquaponics Industry Revenue Million Forecast, by Consumption Analysis 2020 & 2033
- Table 18: Global Aquaponics Industry Revenue Million Forecast, by Import Market Analysis (Value & Volume) 2020 & 2033
- Table 19: Global Aquaponics Industry Revenue Million Forecast, by Export Market Analysis (Value & Volume) 2020 & 2033
- Table 20: Global Aquaponics Industry Revenue Million Forecast, by Price Trend Analysis 2020 & 2033
- Table 21: Global Aquaponics Industry Revenue Million Forecast, by Country 2020 & 2033
- Table 22: Brazil Aquaponics Industry Revenue (Million) Forecast, by Application 2020 & 2033
- Table 23: Argentina Aquaponics Industry Revenue (Million) Forecast, by Application 2020 & 2033
- Table 24: Rest of South America Aquaponics Industry Revenue (Million) Forecast, by Application 2020 & 2033
- Table 25: Global Aquaponics Industry Revenue Million Forecast, by Production Analysis 2020 & 2033
- Table 26: Global Aquaponics Industry Revenue Million Forecast, by Consumption Analysis 2020 & 2033
- Table 27: Global Aquaponics Industry Revenue Million Forecast, by Import Market Analysis (Value & Volume) 2020 & 2033
- Table 28: Global Aquaponics Industry Revenue Million Forecast, by Export Market Analysis (Value & Volume) 2020 & 2033
- Table 29: Global Aquaponics Industry Revenue Million Forecast, by Price Trend Analysis 2020 & 2033
- Table 30: Global Aquaponics Industry Revenue Million Forecast, by Country 2020 & 2033
- Table 31: United Kingdom Aquaponics Industry Revenue (Million) Forecast, by Application 2020 & 2033
- Table 32: Germany Aquaponics Industry Revenue (Million) Forecast, by Application 2020 & 2033
- Table 33: France Aquaponics Industry Revenue (Million) Forecast, by Application 2020 & 2033
- Table 34: Italy Aquaponics Industry Revenue (Million) Forecast, by Application 2020 & 2033
- Table 35: Spain Aquaponics Industry Revenue (Million) Forecast, by Application 2020 & 2033
- Table 36: Russia Aquaponics Industry Revenue (Million) Forecast, by Application 2020 & 2033
- Table 37: Benelux Aquaponics Industry Revenue (Million) Forecast, by Application 2020 & 2033
- Table 38: Nordics Aquaponics Industry Revenue (Million) Forecast, by Application 2020 & 2033
- Table 39: Rest of Europe Aquaponics Industry Revenue (Million) Forecast, by Application 2020 & 2033
- Table 40: Global Aquaponics Industry Revenue Million Forecast, by Production Analysis 2020 & 2033
- Table 41: Global Aquaponics Industry Revenue Million Forecast, by Consumption Analysis 2020 & 2033
- Table 42: Global Aquaponics Industry Revenue Million Forecast, by Import Market Analysis (Value & Volume) 2020 & 2033
- Table 43: Global Aquaponics Industry Revenue Million Forecast, by Export Market Analysis (Value & Volume) 2020 & 2033
- Table 44: Global Aquaponics Industry Revenue Million Forecast, by Price Trend Analysis 2020 & 2033
- Table 45: Global Aquaponics Industry Revenue Million Forecast, by Country 2020 & 2033
- Table 46: Turkey Aquaponics Industry Revenue (Million) Forecast, by Application 2020 & 2033
- Table 47: Israel Aquaponics Industry Revenue (Million) Forecast, by Application 2020 & 2033
- Table 48: GCC Aquaponics Industry Revenue (Million) Forecast, by Application 2020 & 2033
- Table 49: North Africa Aquaponics Industry Revenue (Million) Forecast, by Application 2020 & 2033
- Table 50: South Africa Aquaponics Industry Revenue (Million) Forecast, by Application 2020 & 2033
- Table 51: Rest of Middle East & Africa Aquaponics Industry Revenue (Million) Forecast, by Application 2020 & 2033
- Table 52: Global Aquaponics Industry Revenue Million Forecast, by Production Analysis 2020 & 2033
- Table 53: Global Aquaponics Industry Revenue Million Forecast, by Consumption Analysis 2020 & 2033
- Table 54: Global Aquaponics Industry Revenue Million Forecast, by Import Market Analysis (Value & Volume) 2020 & 2033
- Table 55: Global Aquaponics Industry Revenue Million Forecast, by Export Market Analysis (Value & Volume) 2020 & 2033
- Table 56: Global Aquaponics Industry Revenue Million Forecast, by Price Trend Analysis 2020 & 2033
- Table 57: Global Aquaponics Industry Revenue Million Forecast, by Country 2020 & 2033
- Table 58: China Aquaponics Industry Revenue (Million) Forecast, by Application 2020 & 2033
- Table 59: India Aquaponics Industry Revenue (Million) Forecast, by Application 2020 & 2033
- Table 60: Japan Aquaponics Industry Revenue (Million) Forecast, by Application 2020 & 2033
- Table 61: South Korea Aquaponics Industry Revenue (Million) Forecast, by Application 2020 & 2033
- Table 62: ASEAN Aquaponics Industry Revenue (Million) Forecast, by Application 2020 & 2033
- Table 63: Oceania Aquaponics Industry Revenue (Million) Forecast, by Application 2020 & 2033
- Table 64: Rest of Asia Pacific Aquaponics Industry Revenue (Million) Forecast, by Application 2020 & 2033
Frequently Asked Questions
1. What is the projected Compound Annual Growth Rate (CAGR) of the Aquaponics Industry?
The projected CAGR is approximately 9.60%.
2. Which companies are prominent players in the Aquaponics Industry?
Key companies in the market include Deep Water Farms, Superior Fresh, Practical Aquaponics, Nelson & Pade Aquaponics, BIGH, ECF Farm Berli, Garden City Aquaponics Inc, Aquaponics USA, Madhavi Farms, Ouroboros Farms, Pentair Aquatic Eco-System Inc (PAES).
3. What are the main segments of the Aquaponics Industry?
The market segments include Production Analysis, Consumption Analysis, Import Market Analysis (Value & Volume), Export Market Analysis (Value & Volume), Price Trend Analysis.
4. Can you provide details about the market size?
The market size is estimated to be USD 1.21 Million as of 2022.
5. What are some drivers contributing to market growth?
High Cost of Farm Labors; Increasing Consumption of Grain Crops.
6. What are the notable trends driving market growth?
Substantial Demand for Organic Produce Driving the Market.
7. Are there any restraints impacting market growth?
High Cost of Combine Harvesters; Small and Fragmented Land Holdings.
8. Can you provide examples of recent developments in the market?
N/A
9. What pricing options are available for accessing the report?
Pricing options include single-user, multi-user, and enterprise licenses priced at USD 4750, USD 5250, and USD 8750 respectively.
10. Is the market size provided in terms of value or volume?
The market size is provided in terms of value, measured in Million.
11. Are there any specific market keywords associated with the report?
Yes, the market keyword associated with the report is "Aquaponics Industry," which aids in identifying and referencing the specific market segment covered.
12. How do I determine which pricing option suits my needs best?
The pricing options vary based on user requirements and access needs. Individual users may opt for single-user licenses, while businesses requiring broader access may choose multi-user or enterprise licenses for cost-effective access to the report.
13. Are there any additional resources or data provided in the Aquaponics Industry report?
While the report offers comprehensive insights, it's advisable to review the specific contents or supplementary materials provided to ascertain if additional resources or data are available.
14. How can I stay updated on further developments or reports in the Aquaponics Industry?
To stay informed about further developments, trends, and reports in the Aquaponics Industry, consider subscribing to industry newsletters, following relevant companies and organizations, or regularly checking reputable industry news sources and publications.
Methodology
Step 1 - Identification of Relevant Samples Size from Population Database


Step 2 - Approaches for Defining Global Market Size (Value, Volume* & Price*)

Note*: In applicable scenarios
Step 3 - Data Sources
Primary Research
- Web Analytics
- Survey Reports
- Research Institute
- Latest Research Reports
- Opinion Leaders
Secondary Research
- Annual Reports
- White Paper
- Latest Press Release
- Industry Association
- Paid Database
- Investor Presentations

Step 4 - Data Triangulation
Involves using different sources of information in order to increase the validity of a study
These sources are likely to be stakeholders in a program - participants, other researchers, program staff, other community members, and so on.
Then we put all data in single framework & apply various statistical tools to find out the dynamic on the market.
During the analysis stage, feedback from the stakeholder groups would be compared to determine areas of agreement as well as areas of divergence