

Key Insights
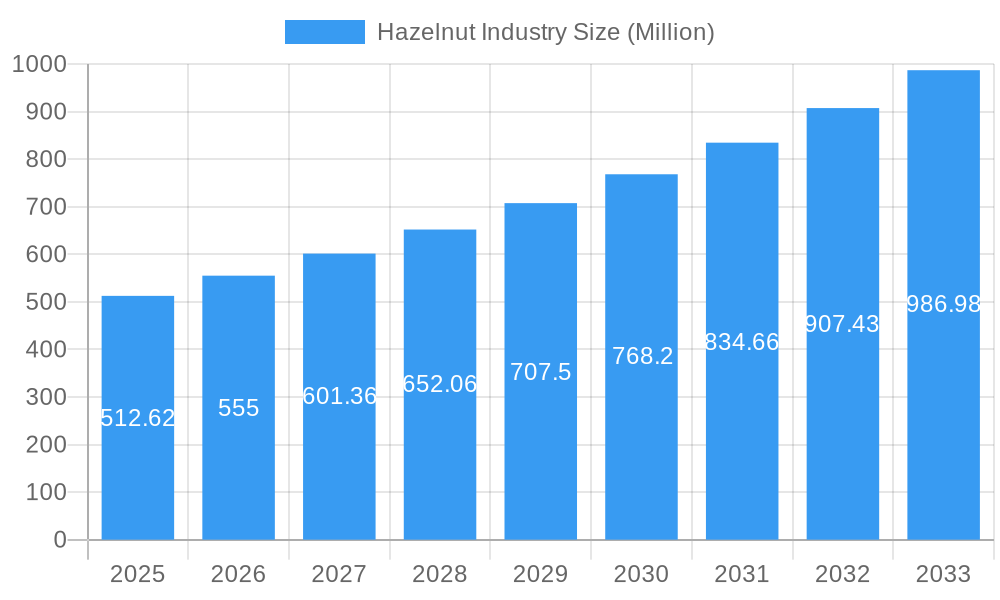
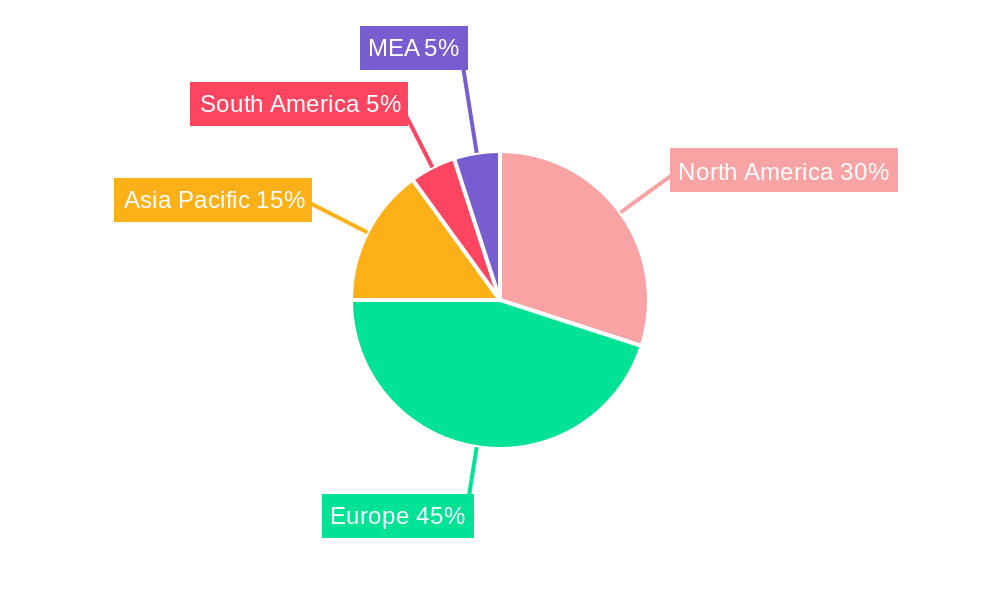
The global hazelnut market, valued at $512.62 million in 2025, is projected to experience robust growth, driven by increasing consumer demand for nutritious and versatile snacks and ingredients. The Compound Annual Growth Rate (CAGR) of 8.10% from 2025 to 2033 indicates a significant expansion of the market over the forecast period. Key drivers include the rising popularity of hazelnut-based confectionery, bakery products, and beverages, fueled by growing consumer awareness of the health benefits associated with hazelnuts, such as their rich source of antioxidants and healthy fats. Furthermore, the increasing adoption of hazelnuts in various food applications, like spreads and nut butters, is further contributing to market growth. While challenges such as price volatility and the impact of climate change on hazelnut production remain, the market is expected to overcome these hurdles due to continuous innovation in processing and cultivation techniques. The market segmentation reveals the dominance of roasted hazelnuts within the product type category, indicating a strong consumer preference for ready-to-eat options. Geographically, North America and Europe currently hold significant market shares, with strong growth potential anticipated in the Asia-Pacific region due to rising disposable incomes and changing dietary habits. Major players like Ferrero, Mondelez International, and Barry Callebaut are strategically investing in R&D and expanding their product portfolios to capitalize on these market trends.
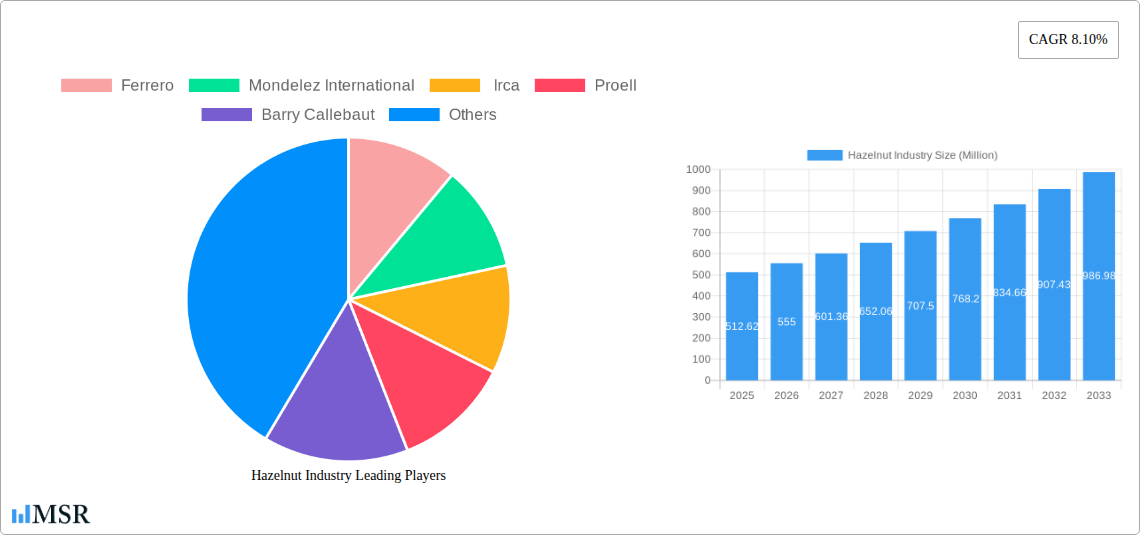
Hazelnut Industry Market Size (In Million)
The projected growth in the hazelnut market is also influenced by evolving consumer preferences towards clean-label products and the increasing demand for sustainable and ethically sourced ingredients. The confectionery sector represents a significant application segment, leveraging the unique flavor and texture profile of hazelnuts to create popular chocolate spreads and other confectionery items. The bakery industry also utilizes hazelnuts extensively, incorporating them into pastries, cakes, and other baked goods. The "other" application segment encompasses diverse uses, such as in cosmetics and pharmaceuticals, highlighting the versatility of this nut. To maintain growth trajectory, companies are focusing on product diversification, exploring innovative hazelnut-based products, and adopting sustainable practices across their supply chains. Competitive advantages will be driven by efficient sourcing, processing, and distribution networks, enabling businesses to deliver high-quality products at competitive prices. The continued focus on product innovation, addressing consumer health concerns and preferences, and responding to market trends will be crucial for market success.
Hazelnut Industry Company Market Share
Unlock the Potential of the Multi-Million Dollar Hazelnut Industry: A Comprehensive Market Report (2019-2033)
This comprehensive report delivers in-depth analysis of the global hazelnut industry, projecting a market value exceeding xx Million by 2033. The study period covers 2019-2033, with a base year of 2025 and a forecast period of 2025-2033. We dissect market dynamics, pinpoint key growth drivers, and identify lucrative opportunities for stakeholders in this rapidly evolving sector. This report is essential for investors, manufacturers (including Ferrero, Mondelez International, Irca, Proell, and Barry Callebaut), and industry professionals seeking a competitive edge.
Hazelnut Industry Market Concentration & Dynamics
The global hazelnut market demonstrates a moderately concentrated structure, with key players like Ferrero and Mondelez International holding significant market share. The exact percentage is estimated at xx% combined in 2025, reflecting their extensive distribution networks and established brand recognition. Innovation within the industry is driven primarily by advancements in processing techniques, leading to improved product quality and shelf life. Regulatory frameworks concerning food safety and labeling significantly impact market operations. Substitute products, such as almonds and cashews, exert competitive pressure, demanding continuous innovation and value proposition refinement. End-user trends, particularly towards healthier snacking options and premium quality ingredients, are shaping product development. M&A activity in the sector has been relatively moderate during the historical period (2019-2024) with approximately xx deals recorded, signifying consolidation within the industry.
Hazelnut Industry Insights & Trends
The global hazelnut market is experiencing robust growth, with the market size estimated at xx Million in 2025 and projected to reach xx Million by 2033, exhibiting a CAGR of xx%. This expansion is propelled by several factors, including rising consumer demand for healthy and nutritious snacks, increased adoption of hazelnuts in confectionery and bakery products, and expanding applications in the food and beverage sector. Technological advancements in hazelnut processing and farming techniques are contributing to improved efficiency and productivity. Evolving consumer preferences towards sustainable and ethically sourced ingredients also present growth opportunities. However, factors like fluctuating hazelnut prices and climatic changes pose challenges to market stability.
Key Markets & Segments Leading Hazelnut Industry
The European Union, particularly Italy and Turkey, dominate the global hazelnut market, accounting for a combined market share of xx% in 2025. This dominance stems from favorable climatic conditions and established hazelnut cultivation practices.
Key Drivers for Dominance:
- Favorable Climate: Mediterranean climate ideal for hazelnut cultivation.
- Established Infrastructure: Robust agricultural infrastructure and processing facilities.
- Government Support: Agricultural policies supporting hazelnut production.
- Historical Expertise: Centuries-long experience in hazelnut farming and processing.
Segment Analysis:
Within product types, roasted hazelnuts and hazelnut paste are the largest segments in 2025, fueled by their versatile applications in various food products. In terms of application, confectionery dominates, accounting for xx% of total consumption, followed by the bakery segment. Growth in these sectors is anticipated to drive overall market expansion.
Hazelnut Industry Product Developments
Recent product innovations include the development of new hazelnut-based products with added functionalities, such as enhanced nutritional value or improved flavor profiles. Technological advancements in extraction processes have led to improved yields and higher quality hazelnut oil. The emphasis on creating convenient and ready-to-consume hazelnut products drives innovation. These developments aim to meet evolving consumer preferences and create a competitive edge for industry players.
Challenges in the Hazelnut Industry Market
The hazelnut industry faces significant challenges, including fluctuating hazelnut prices due to climatic variations and supply chain disruptions, impacting overall market profitability. Stringent regulatory requirements regarding food safety and labeling increase operational costs. Intense competition from substitute products and the rise of private labels further pressure profitability. These factors can limit overall market expansion unless effectively addressed.
Forces Driving Hazelnut Industry Growth
Technological advancements in cultivation and processing techniques boost efficiency and quality. Growing consumer awareness of the nutritional benefits of hazelnuts and their versatile application in food products are driving demand. Government initiatives supporting sustainable hazelnut farming practices contribute to industry growth. Expansion into new markets, particularly in Asia and North America, offer further growth potential.
Challenges in the Hazelnut Industry Market
Long-term growth depends on technological breakthroughs in disease resistance and sustainable farming. Strategic partnerships between producers, processors, and retailers can improve supply chain resilience. Market expansion through product diversification and increased penetration in new markets are crucial for sustained growth.
Emerging Opportunities in Hazelnut Industry
The rise of functional foods and nut-based beverages presents significant opportunities. Increased demand for sustainable and ethically sourced hazelnuts creates a niche market. Exploring new applications in health and wellness products can further expand the market potential. Innovations in packaging technology for improved shelf life and convenience are also promising avenues.
Leading Players in the Hazelnut Industry Sector
- Ferrero
- Mondelez International
- Irca
- Proell
- Barry Callebaut
Key Milestones in Hazelnut Industry Industry
- 2020: Launch of a new hazelnut spread with reduced sugar content by Ferrero.
- 2021: Acquisition of a smaller hazelnut processing company by Barry Callebaut, expanding its market reach.
- 2022: Implementation of new sustainable farming practices by a major hazelnut producer in Turkey.
- 2023: Introduction of innovative hazelnut-based ingredient solutions for the food and beverage sector by Irca.
- 2024: Significant investment in hazelnut processing technology by Proell, aimed at improving efficiency and quality.
Strategic Outlook for Hazelnut Industry Market
The hazelnut industry is poised for continued growth driven by increasing consumer demand, technological advancements, and expanding applications. Strategic investments in research and development, sustainable farming practices, and innovative product development are crucial. Exploring emerging markets and expanding product portfolios will be critical for securing a competitive advantage and maximizing future market potential.
Hazelnut Industry Segmentation
- 1. Production Analysis
- 2. Consumption Analysis
- 3. Import Market Analysis (Value & Volume)
- 4. Export Market Analysis (Value & Volume)
- 5. Price Trend Analysis
Hazelnut Industry Segmentation By Geography
-
1. North America
- 1.1. United States
- 1.2. Canada
- 1.3. Mexico
-
2. Europe
- 2.1. Germany
- 2.2. United Kingdom
- 2.3. France
- 2.4. Italy
- 2.5. Austria
- 2.6. Netherlands
- 2.7. Spain
-
3. Asia Pacific
- 3.1. China
- 3.2. Australia
- 3.3. India
- 3.4. Japan
-
4. South America
- 4.1. Brazil
- 4.2. Argentina
-
5. Middle East and Africa
- 5.1. Turkey
- 5.2. South Africa
Hazelnut Industry Regional Market Share
Geographic Coverage of Hazelnut Industry
Hazelnut Industry REPORT HIGHLIGHTS
| Aspects | Details |
|---|---|
| Study Period | 2020-2034 |
| Base Year | 2025 |
| Estimated Year | 2026 |
| Forecast Period | 2026-2034 |
| Historical Period | 2020-2025 |
| Growth Rate | CAGR of 8.10% from 2020-2034 |
| Segmentation |
|
Table of Contents
- 1. Introduction
- 1.1. Research Scope
- 1.2. Market Segmentation
- 1.3. Research Objective
- 1.4. Definitions and Assumptions
- 2. Executive Summary
- 2.1. Market Snapshot
- 3. Market Dynamics
- 3.1. Market Drivers
- 3.2. Market Restrains
- 3.3. Market Trends
- 3.4. Market Opportunities
- 4. Market Factor Analysis
- 4.1. Porters Five Forces
- 4.1.1. Bargaining Power of Suppliers
- 4.1.2. Bargaining Power of Buyers
- 4.1.3. Threat of New Entrants
- 4.1.4. Threat of Substitutes
- 4.1.5. Competitive Rivalry
- 4.2. PESTEL analysis
- 4.3. BCG Analysis
- 4.3.1. Stars (High Growth, High Market Share)
- 4.3.2. Cash Cows (Low Growth, High Market Share)
- 4.3.3. Question Mark (High Growth, Low Market Share)
- 4.3.4. Dogs (Low Growth, Low Market Share)
- 4.4. Ansoff Matrix Analysis
- 4.5. Supply Chain Analysis
- 4.6. Regulatory Landscape
- 4.7. Current Market Potential and Opportunity Assessment (TAM–SAM–SOM Framework)
- 4.8. MSR Analyst Note
- 4.1. Porters Five Forces
- 5. Market Analysis, Insights and Forecast 2021-2033
- 5.1. Market Analysis, Insights and Forecast - by Production Analysis
- 5.2. Market Analysis, Insights and Forecast - by Consumption Analysis
- 5.3. Market Analysis, Insights and Forecast - by Import Market Analysis (Value & Volume)
- 5.4. Market Analysis, Insights and Forecast - by Export Market Analysis (Value & Volume)
- 5.5. Market Analysis, Insights and Forecast - by Price Trend Analysis
- 5.6. Market Analysis, Insights and Forecast - by Region
- 5.6.1. North America
- 5.6.2. Europe
- 5.6.3. Asia Pacific
- 5.6.4. South America
- 5.6.5. Middle East and Africa
- 6. Global Hazelnut Industry Analysis, Insights and Forecast, 2021-2033
- 6.1. Market Analysis, Insights and Forecast - by Production Analysis
- 6.2. Market Analysis, Insights and Forecast - by Consumption Analysis
- 6.3. Market Analysis, Insights and Forecast - by Import Market Analysis (Value & Volume)
- 6.4. Market Analysis, Insights and Forecast - by Export Market Analysis (Value & Volume)
- 6.5. Market Analysis, Insights and Forecast - by Price Trend Analysis
- 7. North America Hazelnut Industry Analysis, Insights and Forecast, 2020-2032
- 7.1. Market Analysis, Insights and Forecast - by Production Analysis
- 7.2. Market Analysis, Insights and Forecast - by Consumption Analysis
- 7.3. Market Analysis, Insights and Forecast - by Import Market Analysis (Value & Volume)
- 7.4. Market Analysis, Insights and Forecast - by Export Market Analysis (Value & Volume)
- 7.5. Market Analysis, Insights and Forecast - by Price Trend Analysis
- 8. Europe Hazelnut Industry Analysis, Insights and Forecast, 2020-2032
- 8.1. Market Analysis, Insights and Forecast - by Production Analysis
- 8.2. Market Analysis, Insights and Forecast - by Consumption Analysis
- 8.3. Market Analysis, Insights and Forecast - by Import Market Analysis (Value & Volume)
- 8.4. Market Analysis, Insights and Forecast - by Export Market Analysis (Value & Volume)
- 8.5. Market Analysis, Insights and Forecast - by Price Trend Analysis
- 9. Asia Pacific Hazelnut Industry Analysis, Insights and Forecast, 2020-2032
- 9.1. Market Analysis, Insights and Forecast - by Production Analysis
- 9.2. Market Analysis, Insights and Forecast - by Consumption Analysis
- 9.3. Market Analysis, Insights and Forecast - by Import Market Analysis (Value & Volume)
- 9.4. Market Analysis, Insights and Forecast - by Export Market Analysis (Value & Volume)
- 9.5. Market Analysis, Insights and Forecast - by Price Trend Analysis
- 10. South America Hazelnut Industry Analysis, Insights and Forecast, 2020-2032
- 10.1. Market Analysis, Insights and Forecast - by Production Analysis
- 10.2. Market Analysis, Insights and Forecast - by Consumption Analysis
- 10.3. Market Analysis, Insights and Forecast - by Import Market Analysis (Value & Volume)
- 10.4. Market Analysis, Insights and Forecast - by Export Market Analysis (Value & Volume)
- 10.5. Market Analysis, Insights and Forecast - by Price Trend Analysis
- 11. Middle East and Africa Hazelnut Industry Analysis, Insights and Forecast, 2020-2032
- 11.1. Market Analysis, Insights and Forecast - by Production Analysis
- 11.2. Market Analysis, Insights and Forecast - by Consumption Analysis
- 11.3. Market Analysis, Insights and Forecast - by Import Market Analysis (Value & Volume)
- 11.4. Market Analysis, Insights and Forecast - by Export Market Analysis (Value & Volume)
- 11.5. Market Analysis, Insights and Forecast - by Price Trend Analysis
- 12. Competitive Analysis
- 12.1. Company Profiles
- 12.1.1 Ferrero
- 12.1.1.1. Company Overview
- 12.1.1.2. Products
- 12.1.1.3. Company Financials
- 12.1.1.4. SWOT Analysis
- 12.1.2 Mondelez International
- 12.1.2.1. Company Overview
- 12.1.2.2. Products
- 12.1.2.3. Company Financials
- 12.1.2.4. SWOT Analysis
- 12.1.3 Irca
- 12.1.3.1. Company Overview
- 12.1.3.2. Products
- 12.1.3.3. Company Financials
- 12.1.3.4. SWOT Analysis
- 12.1.4 Proell
- 12.1.4.1. Company Overview
- 12.1.4.2. Products
- 12.1.4.3. Company Financials
- 12.1.4.4. SWOT Analysis
- 12.1.5 Barry Callebaut
- 12.1.5.1. Company Overview
- 12.1.5.2. Products
- 12.1.5.3. Company Financials
- 12.1.5.4. SWOT Analysis
- 12.1.1 Ferrero
- 12.2. Market Entropy
- 12.2.1 Company's Key Areas Served
- 12.2.2 Recent Developments
- 12.3. Company Market Share Analysis 2025
- 12.3.1 Top 5 Companies Market Share Analysis
- 12.3.2 Top 3 Companies Market Share Analysis
- 12.4. List of Potential Customers
- 13. Research Methodology
List of Figures
- Figure 1: Global Hazelnut Industry Revenue Breakdown (Million, %) by Region 2025 & 2033
- Figure 2: North America Hazelnut Industry Revenue (Million), by Production Analysis 2025 & 2033
- Figure 3: North America Hazelnut Industry Revenue Share (%), by Production Analysis 2025 & 2033
- Figure 4: North America Hazelnut Industry Revenue (Million), by Consumption Analysis 2025 & 2033
- Figure 5: North America Hazelnut Industry Revenue Share (%), by Consumption Analysis 2025 & 2033
- Figure 6: North America Hazelnut Industry Revenue (Million), by Import Market Analysis (Value & Volume) 2025 & 2033
- Figure 7: North America Hazelnut Industry Revenue Share (%), by Import Market Analysis (Value & Volume) 2025 & 2033
- Figure 8: North America Hazelnut Industry Revenue (Million), by Export Market Analysis (Value & Volume) 2025 & 2033
- Figure 9: North America Hazelnut Industry Revenue Share (%), by Export Market Analysis (Value & Volume) 2025 & 2033
- Figure 10: North America Hazelnut Industry Revenue (Million), by Price Trend Analysis 2025 & 2033
- Figure 11: North America Hazelnut Industry Revenue Share (%), by Price Trend Analysis 2025 & 2033
- Figure 12: North America Hazelnut Industry Revenue (Million), by Country 2025 & 2033
- Figure 13: North America Hazelnut Industry Revenue Share (%), by Country 2025 & 2033
- Figure 14: Europe Hazelnut Industry Revenue (Million), by Production Analysis 2025 & 2033
- Figure 15: Europe Hazelnut Industry Revenue Share (%), by Production Analysis 2025 & 2033
- Figure 16: Europe Hazelnut Industry Revenue (Million), by Consumption Analysis 2025 & 2033
- Figure 17: Europe Hazelnut Industry Revenue Share (%), by Consumption Analysis 2025 & 2033
- Figure 18: Europe Hazelnut Industry Revenue (Million), by Import Market Analysis (Value & Volume) 2025 & 2033
- Figure 19: Europe Hazelnut Industry Revenue Share (%), by Import Market Analysis (Value & Volume) 2025 & 2033
- Figure 20: Europe Hazelnut Industry Revenue (Million), by Export Market Analysis (Value & Volume) 2025 & 2033
- Figure 21: Europe Hazelnut Industry Revenue Share (%), by Export Market Analysis (Value & Volume) 2025 & 2033
- Figure 22: Europe Hazelnut Industry Revenue (Million), by Price Trend Analysis 2025 & 2033
- Figure 23: Europe Hazelnut Industry Revenue Share (%), by Price Trend Analysis 2025 & 2033
- Figure 24: Europe Hazelnut Industry Revenue (Million), by Country 2025 & 2033
- Figure 25: Europe Hazelnut Industry Revenue Share (%), by Country 2025 & 2033
- Figure 26: Asia Pacific Hazelnut Industry Revenue (Million), by Production Analysis 2025 & 2033
- Figure 27: Asia Pacific Hazelnut Industry Revenue Share (%), by Production Analysis 2025 & 2033
- Figure 28: Asia Pacific Hazelnut Industry Revenue (Million), by Consumption Analysis 2025 & 2033
- Figure 29: Asia Pacific Hazelnut Industry Revenue Share (%), by Consumption Analysis 2025 & 2033
- Figure 30: Asia Pacific Hazelnut Industry Revenue (Million), by Import Market Analysis (Value & Volume) 2025 & 2033
- Figure 31: Asia Pacific Hazelnut Industry Revenue Share (%), by Import Market Analysis (Value & Volume) 2025 & 2033
- Figure 32: Asia Pacific Hazelnut Industry Revenue (Million), by Export Market Analysis (Value & Volume) 2025 & 2033
- Figure 33: Asia Pacific Hazelnut Industry Revenue Share (%), by Export Market Analysis (Value & Volume) 2025 & 2033
- Figure 34: Asia Pacific Hazelnut Industry Revenue (Million), by Price Trend Analysis 2025 & 2033
- Figure 35: Asia Pacific Hazelnut Industry Revenue Share (%), by Price Trend Analysis 2025 & 2033
- Figure 36: Asia Pacific Hazelnut Industry Revenue (Million), by Country 2025 & 2033
- Figure 37: Asia Pacific Hazelnut Industry Revenue Share (%), by Country 2025 & 2033
- Figure 38: South America Hazelnut Industry Revenue (Million), by Production Analysis 2025 & 2033
- Figure 39: South America Hazelnut Industry Revenue Share (%), by Production Analysis 2025 & 2033
- Figure 40: South America Hazelnut Industry Revenue (Million), by Consumption Analysis 2025 & 2033
- Figure 41: South America Hazelnut Industry Revenue Share (%), by Consumption Analysis 2025 & 2033
- Figure 42: South America Hazelnut Industry Revenue (Million), by Import Market Analysis (Value & Volume) 2025 & 2033
- Figure 43: South America Hazelnut Industry Revenue Share (%), by Import Market Analysis (Value & Volume) 2025 & 2033
- Figure 44: South America Hazelnut Industry Revenue (Million), by Export Market Analysis (Value & Volume) 2025 & 2033
- Figure 45: South America Hazelnut Industry Revenue Share (%), by Export Market Analysis (Value & Volume) 2025 & 2033
- Figure 46: South America Hazelnut Industry Revenue (Million), by Price Trend Analysis 2025 & 2033
- Figure 47: South America Hazelnut Industry Revenue Share (%), by Price Trend Analysis 2025 & 2033
- Figure 48: South America Hazelnut Industry Revenue (Million), by Country 2025 & 2033
- Figure 49: South America Hazelnut Industry Revenue Share (%), by Country 2025 & 2033
- Figure 50: Middle East and Africa Hazelnut Industry Revenue (Million), by Production Analysis 2025 & 2033
- Figure 51: Middle East and Africa Hazelnut Industry Revenue Share (%), by Production Analysis 2025 & 2033
- Figure 52: Middle East and Africa Hazelnut Industry Revenue (Million), by Consumption Analysis 2025 & 2033
- Figure 53: Middle East and Africa Hazelnut Industry Revenue Share (%), by Consumption Analysis 2025 & 2033
- Figure 54: Middle East and Africa Hazelnut Industry Revenue (Million), by Import Market Analysis (Value & Volume) 2025 & 2033
- Figure 55: Middle East and Africa Hazelnut Industry Revenue Share (%), by Import Market Analysis (Value & Volume) 2025 & 2033
- Figure 56: Middle East and Africa Hazelnut Industry Revenue (Million), by Export Market Analysis (Value & Volume) 2025 & 2033
- Figure 57: Middle East and Africa Hazelnut Industry Revenue Share (%), by Export Market Analysis (Value & Volume) 2025 & 2033
- Figure 58: Middle East and Africa Hazelnut Industry Revenue (Million), by Price Trend Analysis 2025 & 2033
- Figure 59: Middle East and Africa Hazelnut Industry Revenue Share (%), by Price Trend Analysis 2025 & 2033
- Figure 60: Middle East and Africa Hazelnut Industry Revenue (Million), by Country 2025 & 2033
- Figure 61: Middle East and Africa Hazelnut Industry Revenue Share (%), by Country 2025 & 2033
List of Tables
- Table 1: Global Hazelnut Industry Revenue Million Forecast, by Production Analysis 2020 & 2033
- Table 2: Global Hazelnut Industry Revenue Million Forecast, by Consumption Analysis 2020 & 2033
- Table 3: Global Hazelnut Industry Revenue Million Forecast, by Import Market Analysis (Value & Volume) 2020 & 2033
- Table 4: Global Hazelnut Industry Revenue Million Forecast, by Export Market Analysis (Value & Volume) 2020 & 2033
- Table 5: Global Hazelnut Industry Revenue Million Forecast, by Price Trend Analysis 2020 & 2033
- Table 6: Global Hazelnut Industry Revenue Million Forecast, by Region 2020 & 2033
- Table 7: Global Hazelnut Industry Revenue Million Forecast, by Production Analysis 2020 & 2033
- Table 8: Global Hazelnut Industry Revenue Million Forecast, by Consumption Analysis 2020 & 2033
- Table 9: Global Hazelnut Industry Revenue Million Forecast, by Import Market Analysis (Value & Volume) 2020 & 2033
- Table 10: Global Hazelnut Industry Revenue Million Forecast, by Export Market Analysis (Value & Volume) 2020 & 2033
- Table 11: Global Hazelnut Industry Revenue Million Forecast, by Price Trend Analysis 2020 & 2033
- Table 12: Global Hazelnut Industry Revenue Million Forecast, by Country 2020 & 2033
- Table 13: United States Hazelnut Industry Revenue (Million) Forecast, by Application 2020 & 2033
- Table 14: Canada Hazelnut Industry Revenue (Million) Forecast, by Application 2020 & 2033
- Table 15: Mexico Hazelnut Industry Revenue (Million) Forecast, by Application 2020 & 2033
- Table 16: Global Hazelnut Industry Revenue Million Forecast, by Production Analysis 2020 & 2033
- Table 17: Global Hazelnut Industry Revenue Million Forecast, by Consumption Analysis 2020 & 2033
- Table 18: Global Hazelnut Industry Revenue Million Forecast, by Import Market Analysis (Value & Volume) 2020 & 2033
- Table 19: Global Hazelnut Industry Revenue Million Forecast, by Export Market Analysis (Value & Volume) 2020 & 2033
- Table 20: Global Hazelnut Industry Revenue Million Forecast, by Price Trend Analysis 2020 & 2033
- Table 21: Global Hazelnut Industry Revenue Million Forecast, by Country 2020 & 2033
- Table 22: Germany Hazelnut Industry Revenue (Million) Forecast, by Application 2020 & 2033
- Table 23: United Kingdom Hazelnut Industry Revenue (Million) Forecast, by Application 2020 & 2033
- Table 24: France Hazelnut Industry Revenue (Million) Forecast, by Application 2020 & 2033
- Table 25: Italy Hazelnut Industry Revenue (Million) Forecast, by Application 2020 & 2033
- Table 26: Austria Hazelnut Industry Revenue (Million) Forecast, by Application 2020 & 2033
- Table 27: Netherlands Hazelnut Industry Revenue (Million) Forecast, by Application 2020 & 2033
- Table 28: Spain Hazelnut Industry Revenue (Million) Forecast, by Application 2020 & 2033
- Table 29: Global Hazelnut Industry Revenue Million Forecast, by Production Analysis 2020 & 2033
- Table 30: Global Hazelnut Industry Revenue Million Forecast, by Consumption Analysis 2020 & 2033
- Table 31: Global Hazelnut Industry Revenue Million Forecast, by Import Market Analysis (Value & Volume) 2020 & 2033
- Table 32: Global Hazelnut Industry Revenue Million Forecast, by Export Market Analysis (Value & Volume) 2020 & 2033
- Table 33: Global Hazelnut Industry Revenue Million Forecast, by Price Trend Analysis 2020 & 2033
- Table 34: Global Hazelnut Industry Revenue Million Forecast, by Country 2020 & 2033
- Table 35: China Hazelnut Industry Revenue (Million) Forecast, by Application 2020 & 2033
- Table 36: Australia Hazelnut Industry Revenue (Million) Forecast, by Application 2020 & 2033
- Table 37: India Hazelnut Industry Revenue (Million) Forecast, by Application 2020 & 2033
- Table 38: Japan Hazelnut Industry Revenue (Million) Forecast, by Application 2020 & 2033
- Table 39: Global Hazelnut Industry Revenue Million Forecast, by Production Analysis 2020 & 2033
- Table 40: Global Hazelnut Industry Revenue Million Forecast, by Consumption Analysis 2020 & 2033
- Table 41: Global Hazelnut Industry Revenue Million Forecast, by Import Market Analysis (Value & Volume) 2020 & 2033
- Table 42: Global Hazelnut Industry Revenue Million Forecast, by Export Market Analysis (Value & Volume) 2020 & 2033
- Table 43: Global Hazelnut Industry Revenue Million Forecast, by Price Trend Analysis 2020 & 2033
- Table 44: Global Hazelnut Industry Revenue Million Forecast, by Country 2020 & 2033
- Table 45: Brazil Hazelnut Industry Revenue (Million) Forecast, by Application 2020 & 2033
- Table 46: Argentina Hazelnut Industry Revenue (Million) Forecast, by Application 2020 & 2033
- Table 47: Global Hazelnut Industry Revenue Million Forecast, by Production Analysis 2020 & 2033
- Table 48: Global Hazelnut Industry Revenue Million Forecast, by Consumption Analysis 2020 & 2033
- Table 49: Global Hazelnut Industry Revenue Million Forecast, by Import Market Analysis (Value & Volume) 2020 & 2033
- Table 50: Global Hazelnut Industry Revenue Million Forecast, by Export Market Analysis (Value & Volume) 2020 & 2033
- Table 51: Global Hazelnut Industry Revenue Million Forecast, by Price Trend Analysis 2020 & 2033
- Table 52: Global Hazelnut Industry Revenue Million Forecast, by Country 2020 & 2033
- Table 53: Turkey Hazelnut Industry Revenue (Million) Forecast, by Application 2020 & 2033
- Table 54: South Africa Hazelnut Industry Revenue (Million) Forecast, by Application 2020 & 2033
Frequently Asked Questions
1. What is the projected Compound Annual Growth Rate (CAGR) of the Hazelnut Industry?
The projected CAGR is approximately 8.10%.
2. Which companies are prominent players in the Hazelnut Industry?
Key companies in the market include Ferrero, Mondelez International, Irca, Proell, Barry Callebaut.
3. What are the main segments of the Hazelnut Industry?
The market segments include Production Analysis, Consumption Analysis, Import Market Analysis (Value & Volume), Export Market Analysis (Value & Volume), Price Trend Analysis.
4. Can you provide details about the market size?
The market size is estimated to be USD 512.62 Million as of 2022.
5. What are some drivers contributing to market growth?
Increasing Demand for Garlic Due to Various Uses in Industries; Rising Demad of Organic Garlic; Increasing Government Initiatives.
6. What are the notable trends driving market growth?
High Demand from the Chocolate Industry.
7. Are there any restraints impacting market growth?
Lack of Technical Knowledge of Farmers; Price Fluctuations.
8. Can you provide examples of recent developments in the market?
N/A
9. What pricing options are available for accessing the report?
Pricing options include single-user, multi-user, and enterprise licenses priced at USD 4750, USD 5250, and USD 8750 respectively.
10. Is the market size provided in terms of value or volume?
The market size is provided in terms of value, measured in Million.
11. Are there any specific market keywords associated with the report?
Yes, the market keyword associated with the report is "Hazelnut Industry," which aids in identifying and referencing the specific market segment covered.
12. How do I determine which pricing option suits my needs best?
The pricing options vary based on user requirements and access needs. Individual users may opt for single-user licenses, while businesses requiring broader access may choose multi-user or enterprise licenses for cost-effective access to the report.
13. Are there any additional resources or data provided in the Hazelnut Industry report?
While the report offers comprehensive insights, it's advisable to review the specific contents or supplementary materials provided to ascertain if additional resources or data are available.
14. How can I stay updated on further developments or reports in the Hazelnut Industry?
To stay informed about further developments, trends, and reports in the Hazelnut Industry, consider subscribing to industry newsletters, following relevant companies and organizations, or regularly checking reputable industry news sources and publications.
Methodology
Step 1 - Identification of Relevant Samples Size from Population Database


Step 2 - Approaches for Defining Global Market Size (Value, Volume* & Price*)

Note*: In applicable scenarios
Step 3 - Data Sources
Primary Research
- Web Analytics
- Survey Reports
- Research Institute
- Latest Research Reports
- Opinion Leaders
Secondary Research
- Annual Reports
- White Paper
- Latest Press Release
- Industry Association
- Paid Database
- Investor Presentations

Step 4 - Data Triangulation
Involves using different sources of information in order to increase the validity of a study
These sources are likely to be stakeholders in a program - participants, other researchers, program staff, other community members, and so on.
Then we put all data in single framework & apply various statistical tools to find out the dynamic on the market.
During the analysis stage, feedback from the stakeholder groups would be compared to determine areas of agreement as well as areas of divergence