

Key Insights
The global blood meal market, valued at approximately $1.29 billion in 2025, is projected to expand at a Compound Annual Growth Rate (CAGR) of 3.63% from 2025 to 2033. This expansion is fueled by a growing demand for sustainable and cost-effective animal feed ingredients, especially within the poultry and swine sectors. Derived from the meat processing industry, blood meal is a valuable protein and essential amino acid source for animal feed formulations. Its application as a natural pest deterrent and organic fertilizer also supports market growth. Key segments include porcine and poultry blood sources, with poultry and porcine feed applications leading. Aquaculture feed is also showing growth due to increased global aquaculture production. North America and Europe currently dominate the market, while the Asia-Pacific region is anticipated to experience substantial expansion driven by rising livestock populations and the demand for affordable protein sources in emerging economies.
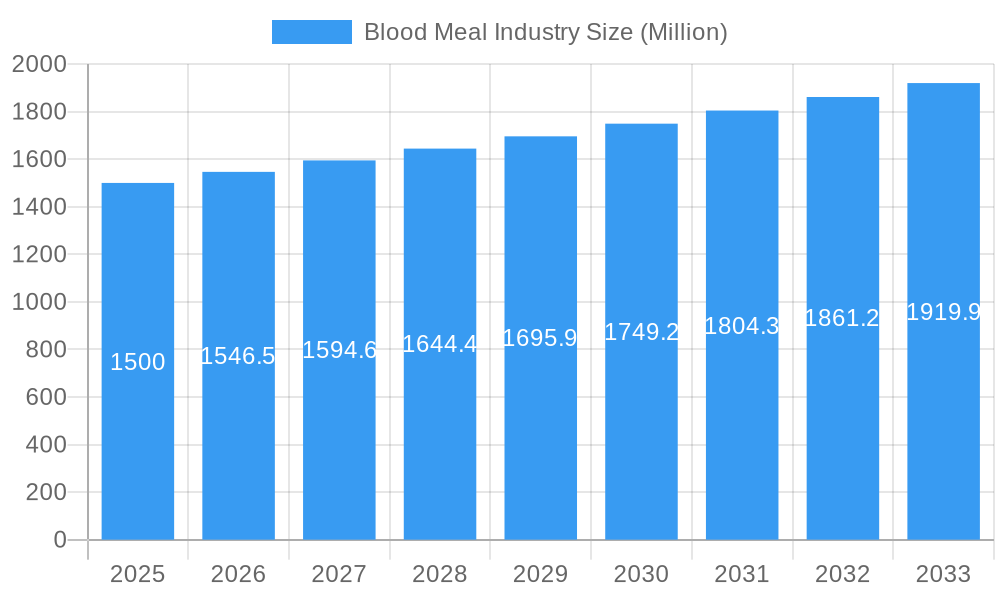
Blood Meal Industry Market Size (In Billion)
Potential challenges include stringent regulations for blood meal processing and supply chain vulnerabilities linked to the meat processing industry. Nevertheless, the increasing emphasis on sustainable agriculture and the rising need for protein-rich animal feed ingredients are expected to drive market growth. The competitive landscape features multinational corporations and regional players, fostering innovation. Future growth will likely be shaped by advancements in processing technologies, enhanced quality control, and diversification into new applications like biofuel production. Further research into the efficacy and sustainability of blood meal applications is crucial for realizing its full market potential. Significant regional variations are expected, with areas experiencing rapid population and livestock growth showing the most substantial expansion.
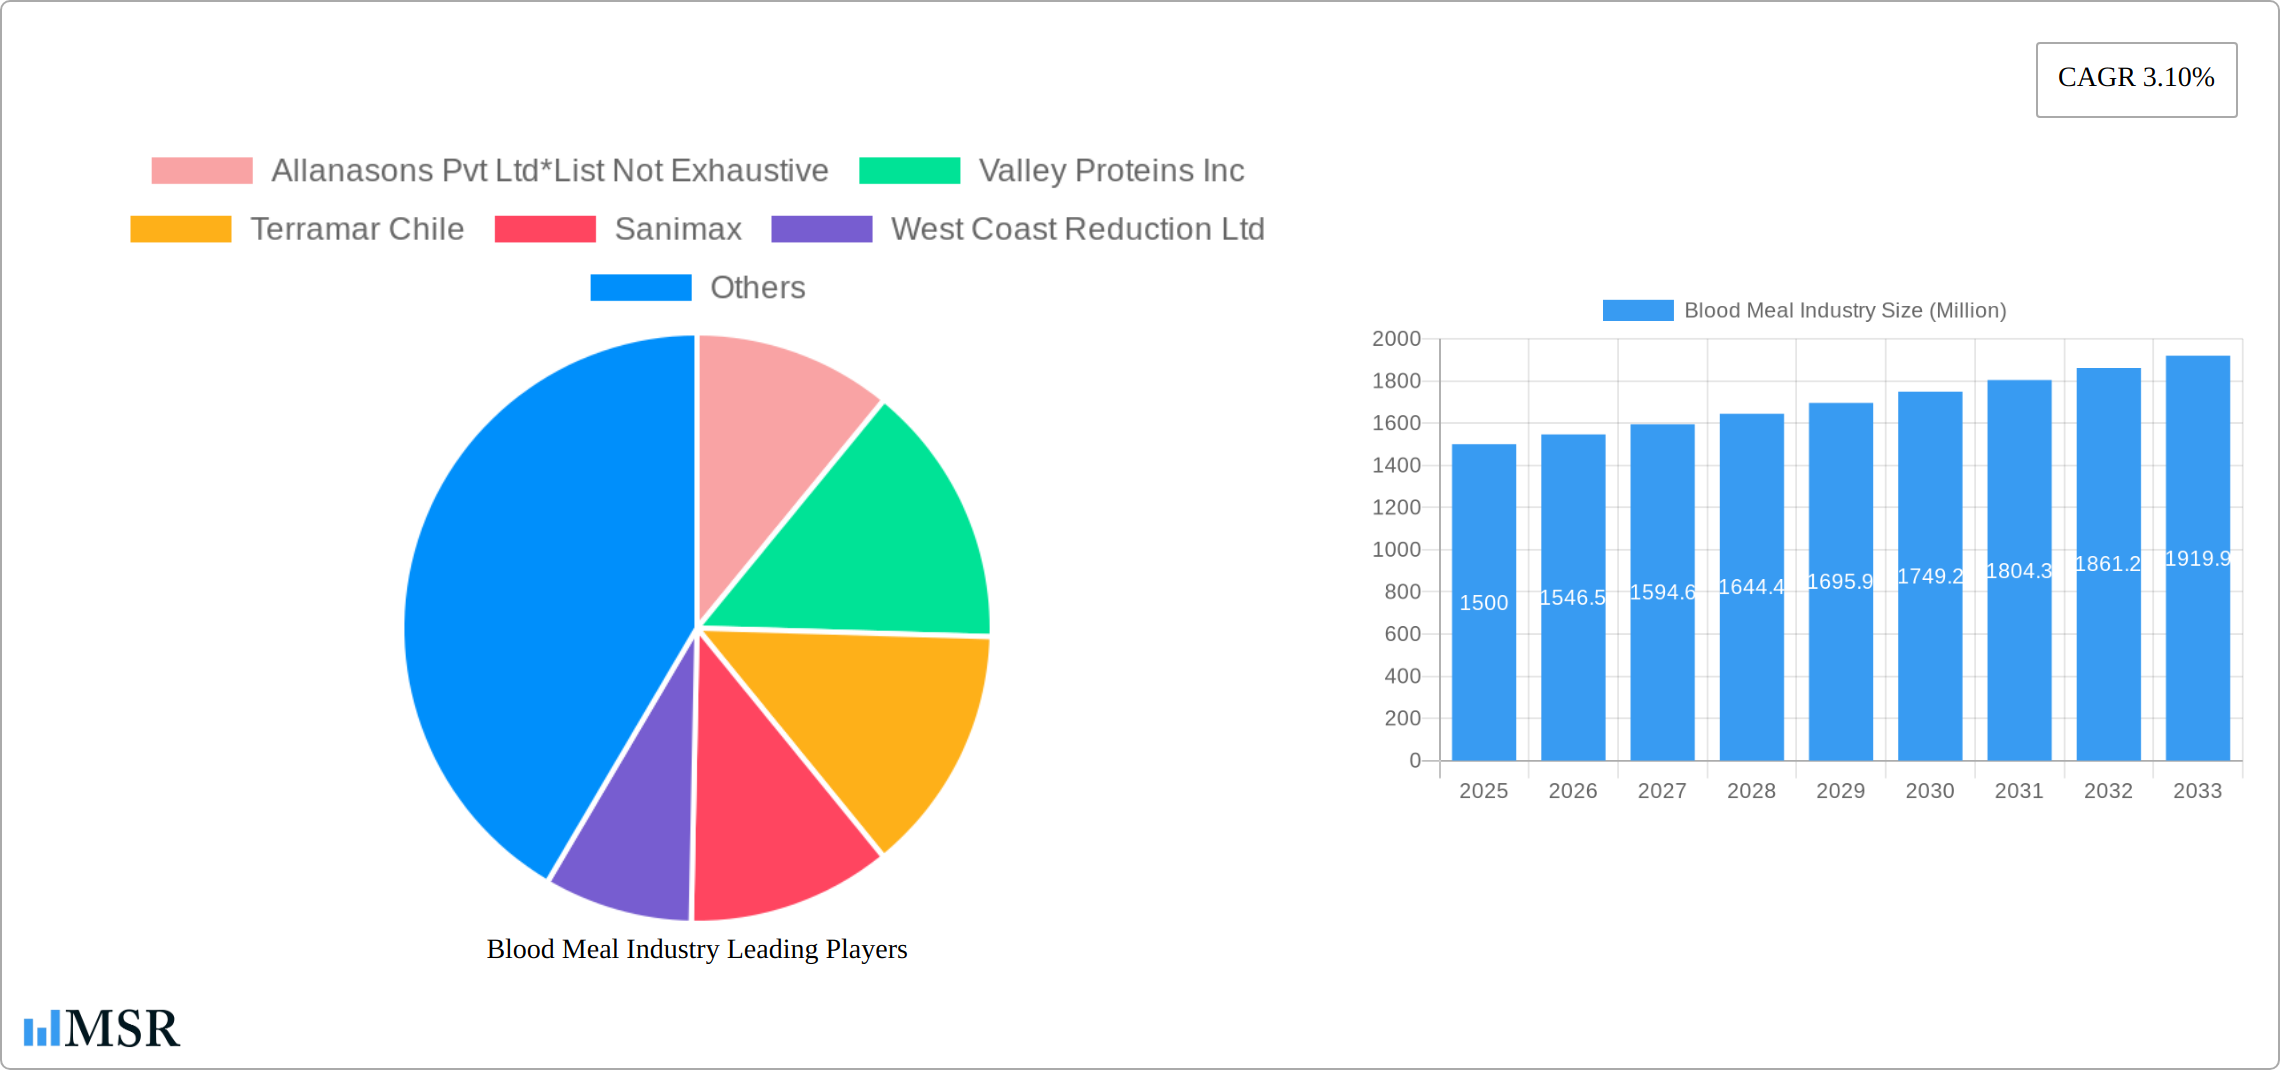
Blood Meal Industry Company Market Share
Blood Meal Industry Report: 2019-2033 Forecast
This comprehensive report provides an in-depth analysis of the global blood meal industry, offering invaluable insights for stakeholders across the value chain. The study period spans 2019-2033, with a base year of 2025 and a forecast period of 2025-2033. We delve into market dynamics, key segments (porcine, poultry, ruminant blood), applications (poultry, porcine, ruminant, aqua feed, fertilizer, pest deterrent), and the leading players shaping this crucial industry. The report projects a market size of xx Million USD by 2033, with a CAGR of xx% during the forecast period.
Blood Meal Industry Market Concentration & Dynamics
The global blood meal market demonstrates a moderately concentrated structure, with several key players holding significant market share. Leading companies such as Darling Ingredients, Valley Proteins Inc., and Sanimax collectively control an estimated xx% of the market (2025). The industry is characterized by a dynamic landscape of innovation, with ongoing research and development efforts focused on enhancing blood meal quality, broadening its applications, and improving sustainability practices. This includes exploring environmentally friendly processing methods and reducing the carbon footprint of production.
Regional variations in regulatory frameworks governing blood meal production and use significantly influence market dynamics. Stringent regulations concerning animal feed safety and environmental protection present both challenges and opportunities for industry participants. Companies must navigate these regulations while also competing with substitute products like soybean meal and other protein sources, particularly in specific applications. The increasing scrutiny on sustainable sourcing and ethical practices further shapes the competitive landscape.
End-user trends, particularly within the animal feed sector, are pivotal drivers of market growth. The rising demand for sustainable and cost-effective animal feed ingredients is boosting the adoption of blood meal. Consolidation and expansion strategies are evident through substantial mergers and acquisitions (M&A) activity. Between 2019 and 2024, approximately xx M&A deals were recorded, reflecting a trend towards industry consolidation and growth.
- Market Concentration: Moderately concentrated, with top 3 players holding xx% market share (2025).
- Innovation: Focus on quality improvement, application expansion, sustainability, and environmentally friendly processing.
- Regulatory Framework: Varies regionally, impacting market access and production costs; necessitates compliance and adaptation.
- Substitute Products: Competition from soybean meal and other protein sources; necessitates differentiation strategies.
- End-User Trends: Growing demand for sustainable and affordable animal feed; necessitates meeting consumer expectations.
- M&A Activity: Significant consolidation and expansion via xx M&A deals (2019-2024); indicative of industry growth and competitiveness.
Blood Meal Industry Industry Insights & Trends
The global blood meal market is experiencing robust growth, driven by several factors. The rising global population and increasing demand for animal protein are key drivers of demand for animal feed, including blood meal. Technological advancements in blood meal processing and the development of innovative applications are further contributing to market expansion. The rising awareness of sustainability and the need for environmentally friendly agricultural practices are also positively impacting the adoption of blood meal as a natural fertilizer and pest deterrent. The market size was valued at xx Million USD in 2024 and is projected to reach xx Million USD by 2033. Changes in consumer behaviour, including a growing preference for sustainable and ethically sourced products, also influence the market.
Key Markets & Segments Leading Blood Meal Industry
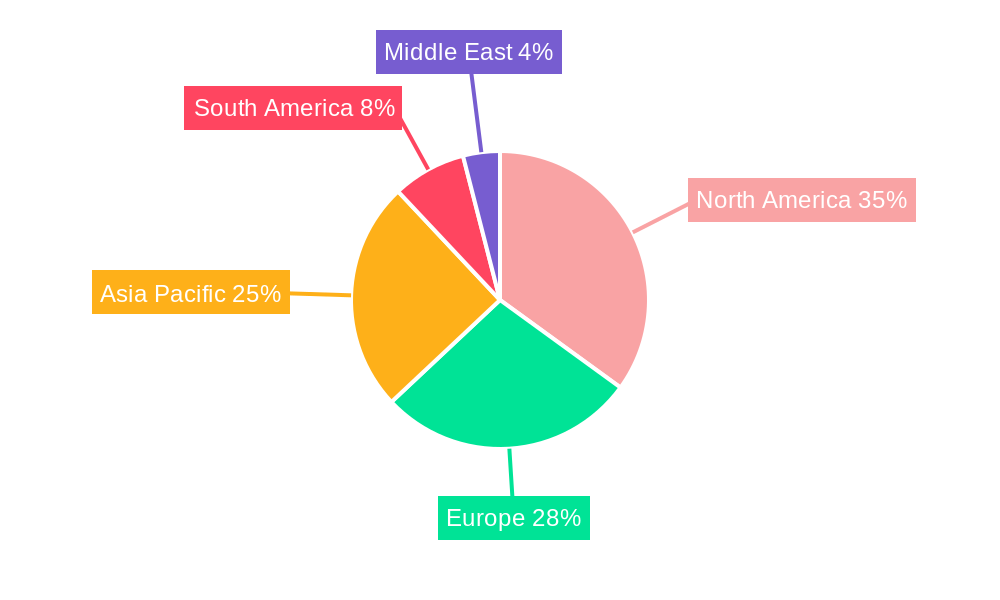
The global blood meal market displays geographical diversity, with a notable presence in North America, Europe, and the Asia-Pacific region. North America currently holds the largest market share, driven by robust livestock production and significant demand for animal feed. Poultry blood is the primary source material, followed by porcine and ruminant blood. Poultry feed is the leading application segment, reflecting the substantial global poultry farming industry.
- Dominant Region: North America
- Dominant Source: Poultry Blood
- Dominant Application: Poultry Feed
Key Drivers:
- North America: Large livestock population, strong demand for animal feed, established infrastructure, and readily available raw materials.
- Poultry Blood: Cost-effectiveness, readily available supply from the poultry processing industry, and efficient processing techniques.
- Poultry Feed: High demand driven by global poultry production expansion, and the nutritional benefits of blood meal for poultry.
Blood Meal Industry Product Developments
Recent product innovations include the development of enhanced blood meal formulations with improved nutritional profiles and digestibility. These advancements cater to the growing demand for high-quality animal feed ingredients. Technological advancements in blood meal processing, such as improved drying and sterilization techniques, enhance product quality and safety. This focus on innovation contributes to a competitive edge for leading players in the market.
Challenges in the Blood Meal Industry Market
The blood meal industry faces several challenges, including regulatory hurdles regarding the sourcing and processing of animal by-products. Supply chain disruptions, particularly related to the availability of raw materials, can affect production and pricing. Competition from substitute protein sources, such as soybean meal, also puts pressure on the market. These factors can collectively impact industry profitability and growth, possibly reducing the projected market value by xx Million USD by 2033.
Forces Driving Blood Meal Industry Growth
Several factors are fueling the growth of the blood meal industry. Technological advancements in processing and formulation are enhancing product quality and expanding applications. The rising demand for sustainable and cost-effective animal feed ingredients is creating opportunities for blood meal as a nutrient-rich alternative. Favorable government policies and initiatives promoting sustainable agriculture further contribute to market expansion.
Long-Term Growth Catalysts in the Blood Meal Industry
Long-term growth in the blood meal industry will be driven by strategic partnerships between producers and animal feed manufacturers. Innovations in processing technology will create higher-value products with enhanced functionality. Expansion into new geographical markets, particularly in developing economies with growing livestock populations, will unlock considerable growth potential.
Emerging Opportunities in Blood Meal Industry
Emerging opportunities for growth include the increasing utilization of blood meal in organic farming as a natural fertilizer, capitalizing on the growing demand for organic produce. The expansion of the aquafeed sector presents a significant growth opportunity for blood meal as a sustainable and cost-effective protein source for aquaculture. The development of specialized blood meal formulations tailored to specific animal species will further enhance market penetration and cater to diverse nutritional needs.
Leading Players in the Blood Meal Industry Sector
- Allanasons Pvt Ltd
- Valley Proteins Inc
- Terramar Chile
- Sanimax
- West Coast Reduction Ltd
- Darling Ingredients
- Boyer Valley Company LLC
- Agro-industrial Complex Backa Topola LTD
- The Fetrell Company
Key Milestones in Blood Meal Industry Industry
- May 2022: Darling Ingredients acquired Fasa Group for USD 560 Million, expanding its global presence and product offerings.
- January 2020: Darling Ingredients acquired 100% equity in EnviroFlight, boosting investment in sustainable feed proteins.
Strategic Outlook for Blood Meal Industry Market
The blood meal industry is poised for sustained growth, driven by increasing demand for animal feed, the widespread adoption of sustainable agricultural practices, and ongoing product innovations. Strategic partnerships, technological advancements, and expansion into new markets will be crucial for maximizing future market potential and capitalizing on emerging opportunities. The industry anticipates significant expansion in the coming years, surpassing the projected xx Million USD by 2033, fueled by both established and emerging applications.
Blood Meal Industry Segmentation
- 1. Production Analysis
- 2. Consumption Analysis
- 3. Import Market Analysis (Value & Volume)
- 4. Export Market Analysis (Value & Volume)
- 5. Price Trend Analysis
Blood Meal Industry Segmentation By Geography
-
1. North America
- 1.1. United States
- 1.2. Canada
- 1.3. Mexico
-
2. South America
- 2.1. Brazil
- 2.2. Argentina
- 2.3. Rest of South America
-
3. Europe
- 3.1. United Kingdom
- 3.2. Germany
- 3.3. France
- 3.4. Italy
- 3.5. Spain
- 3.6. Russia
- 3.7. Benelux
- 3.8. Nordics
- 3.9. Rest of Europe
-
4. Middle East & Africa
- 4.1. Turkey
- 4.2. Israel
- 4.3. GCC
- 4.4. North Africa
- 4.5. South Africa
- 4.6. Rest of Middle East & Africa
-
5. Asia Pacific
- 5.1. China
- 5.2. India
- 5.3. Japan
- 5.4. South Korea
- 5.5. ASEAN
- 5.6. Oceania
- 5.7. Rest of Asia Pacific
Blood Meal Industry Regional Market Share
Geographic Coverage of Blood Meal Industry
Blood Meal Industry REPORT HIGHLIGHTS
| Aspects | Details |
|---|---|
| Study Period | 2020-2034 |
| Base Year | 2025 |
| Estimated Year | 2026 |
| Forecast Period | 2026-2034 |
| Historical Period | 2020-2025 |
| Growth Rate | CAGR of 3.63% from 2020-2034 |
| Segmentation |
|
Table of Contents
- 1. Introduction
- 1.1. Research Scope
- 1.2. Market Segmentation
- 1.3. Research Objective
- 1.4. Definitions and Assumptions
- 2. Executive Summary
- 2.1. Market Snapshot
- 3. Market Dynamics
- 3.1. Market Drivers
- 3.2. Market Restrains
- 3.3. Market Trends
- 3.4. Market Opportunities
- 4. Market Factor Analysis
- 4.1. Porters Five Forces
- 4.1.1. Bargaining Power of Suppliers
- 4.1.2. Bargaining Power of Buyers
- 4.1.3. Threat of New Entrants
- 4.1.4. Threat of Substitutes
- 4.1.5. Competitive Rivalry
- 4.2. PESTEL analysis
- 4.3. BCG Analysis
- 4.3.1. Stars (High Growth, High Market Share)
- 4.3.2. Cash Cows (Low Growth, High Market Share)
- 4.3.3. Question Mark (High Growth, Low Market Share)
- 4.3.4. Dogs (Low Growth, Low Market Share)
- 4.4. Ansoff Matrix Analysis
- 4.5. Supply Chain Analysis
- 4.6. Regulatory Landscape
- 4.7. Current Market Potential and Opportunity Assessment (TAM–SAM–SOM Framework)
- 4.8. MSR Analyst Note
- 4.1. Porters Five Forces
- 5. Market Analysis, Insights and Forecast 2021-2033
- 5.1. Market Analysis, Insights and Forecast - by Production Analysis
- 5.2. Market Analysis, Insights and Forecast - by Consumption Analysis
- 5.3. Market Analysis, Insights and Forecast - by Import Market Analysis (Value & Volume)
- 5.4. Market Analysis, Insights and Forecast - by Export Market Analysis (Value & Volume)
- 5.5. Market Analysis, Insights and Forecast - by Price Trend Analysis
- 5.6. Market Analysis, Insights and Forecast - by Region
- 5.6.1. North America
- 5.6.2. South America
- 5.6.3. Europe
- 5.6.4. Middle East & Africa
- 5.6.5. Asia Pacific
- 6. Global Blood Meal Industry Analysis, Insights and Forecast, 2021-2033
- 6.1. Market Analysis, Insights and Forecast - by Production Analysis
- 6.2. Market Analysis, Insights and Forecast - by Consumption Analysis
- 6.3. Market Analysis, Insights and Forecast - by Import Market Analysis (Value & Volume)
- 6.4. Market Analysis, Insights and Forecast - by Export Market Analysis (Value & Volume)
- 6.5. Market Analysis, Insights and Forecast - by Price Trend Analysis
- 7. North America Blood Meal Industry Analysis, Insights and Forecast, 2020-2032
- 7.1. Market Analysis, Insights and Forecast - by Production Analysis
- 7.2. Market Analysis, Insights and Forecast - by Consumption Analysis
- 7.3. Market Analysis, Insights and Forecast - by Import Market Analysis (Value & Volume)
- 7.4. Market Analysis, Insights and Forecast - by Export Market Analysis (Value & Volume)
- 7.5. Market Analysis, Insights and Forecast - by Price Trend Analysis
- 8. South America Blood Meal Industry Analysis, Insights and Forecast, 2020-2032
- 8.1. Market Analysis, Insights and Forecast - by Production Analysis
- 8.2. Market Analysis, Insights and Forecast - by Consumption Analysis
- 8.3. Market Analysis, Insights and Forecast - by Import Market Analysis (Value & Volume)
- 8.4. Market Analysis, Insights and Forecast - by Export Market Analysis (Value & Volume)
- 8.5. Market Analysis, Insights and Forecast - by Price Trend Analysis
- 9. Europe Blood Meal Industry Analysis, Insights and Forecast, 2020-2032
- 9.1. Market Analysis, Insights and Forecast - by Production Analysis
- 9.2. Market Analysis, Insights and Forecast - by Consumption Analysis
- 9.3. Market Analysis, Insights and Forecast - by Import Market Analysis (Value & Volume)
- 9.4. Market Analysis, Insights and Forecast - by Export Market Analysis (Value & Volume)
- 9.5. Market Analysis, Insights and Forecast - by Price Trend Analysis
- 10. Middle East & Africa Blood Meal Industry Analysis, Insights and Forecast, 2020-2032
- 10.1. Market Analysis, Insights and Forecast - by Production Analysis
- 10.2. Market Analysis, Insights and Forecast - by Consumption Analysis
- 10.3. Market Analysis, Insights and Forecast - by Import Market Analysis (Value & Volume)
- 10.4. Market Analysis, Insights and Forecast - by Export Market Analysis (Value & Volume)
- 10.5. Market Analysis, Insights and Forecast - by Price Trend Analysis
- 11. Asia Pacific Blood Meal Industry Analysis, Insights and Forecast, 2020-2032
- 11.1. Market Analysis, Insights and Forecast - by Production Analysis
- 11.2. Market Analysis, Insights and Forecast - by Consumption Analysis
- 11.3. Market Analysis, Insights and Forecast - by Import Market Analysis (Value & Volume)
- 11.4. Market Analysis, Insights and Forecast - by Export Market Analysis (Value & Volume)
- 11.5. Market Analysis, Insights and Forecast - by Price Trend Analysis
- 12. Competitive Analysis
- 12.1. Company Profiles
- 12.1.1 Allanasons Pvt Ltd*List Not Exhaustive
- 12.1.1.1. Company Overview
- 12.1.1.2. Products
- 12.1.1.3. Company Financials
- 12.1.1.4. SWOT Analysis
- 12.1.2 Valley Proteins Inc
- 12.1.2.1. Company Overview
- 12.1.2.2. Products
- 12.1.2.3. Company Financials
- 12.1.2.4. SWOT Analysis
- 12.1.3 Terramar Chile
- 12.1.3.1. Company Overview
- 12.1.3.2. Products
- 12.1.3.3. Company Financials
- 12.1.3.4. SWOT Analysis
- 12.1.4 Sanimax
- 12.1.4.1. Company Overview
- 12.1.4.2. Products
- 12.1.4.3. Company Financials
- 12.1.4.4. SWOT Analysis
- 12.1.5 West Coast Reduction Ltd
- 12.1.5.1. Company Overview
- 12.1.5.2. Products
- 12.1.5.3. Company Financials
- 12.1.5.4. SWOT Analysis
- 12.1.6 Darling Ingredients
- 12.1.6.1. Company Overview
- 12.1.6.2. Products
- 12.1.6.3. Company Financials
- 12.1.6.4. SWOT Analysis
- 12.1.7 Boyer Valley Company LLC
- 12.1.7.1. Company Overview
- 12.1.7.2. Products
- 12.1.7.3. Company Financials
- 12.1.7.4. SWOT Analysis
- 12.1.8 Agro-industrial Complex Backa Topola LTD
- 12.1.8.1. Company Overview
- 12.1.8.2. Products
- 12.1.8.3. Company Financials
- 12.1.8.4. SWOT Analysis
- 12.1.9 The Fetrell Company
- 12.1.9.1. Company Overview
- 12.1.9.2. Products
- 12.1.9.3. Company Financials
- 12.1.9.4. SWOT Analysis
- 12.1.1 Allanasons Pvt Ltd*List Not Exhaustive
- 12.2. Market Entropy
- 12.2.1 Company's Key Areas Served
- 12.2.2 Recent Developments
- 12.3. Company Market Share Analysis 2025
- 12.3.1 Top 5 Companies Market Share Analysis
- 12.3.2 Top 3 Companies Market Share Analysis
- 12.4. List of Potential Customers
- 13. Research Methodology
List of Figures
- Figure 1: Global Blood Meal Industry Revenue Breakdown (billion, %) by Region 2025 & 2033
- Figure 2: North America Blood Meal Industry Revenue (billion), by Production Analysis 2025 & 2033
- Figure 3: North America Blood Meal Industry Revenue Share (%), by Production Analysis 2025 & 2033
- Figure 4: North America Blood Meal Industry Revenue (billion), by Consumption Analysis 2025 & 2033
- Figure 5: North America Blood Meal Industry Revenue Share (%), by Consumption Analysis 2025 & 2033
- Figure 6: North America Blood Meal Industry Revenue (billion), by Import Market Analysis (Value & Volume) 2025 & 2033
- Figure 7: North America Blood Meal Industry Revenue Share (%), by Import Market Analysis (Value & Volume) 2025 & 2033
- Figure 8: North America Blood Meal Industry Revenue (billion), by Export Market Analysis (Value & Volume) 2025 & 2033
- Figure 9: North America Blood Meal Industry Revenue Share (%), by Export Market Analysis (Value & Volume) 2025 & 2033
- Figure 10: North America Blood Meal Industry Revenue (billion), by Price Trend Analysis 2025 & 2033
- Figure 11: North America Blood Meal Industry Revenue Share (%), by Price Trend Analysis 2025 & 2033
- Figure 12: North America Blood Meal Industry Revenue (billion), by Country 2025 & 2033
- Figure 13: North America Blood Meal Industry Revenue Share (%), by Country 2025 & 2033
- Figure 14: South America Blood Meal Industry Revenue (billion), by Production Analysis 2025 & 2033
- Figure 15: South America Blood Meal Industry Revenue Share (%), by Production Analysis 2025 & 2033
- Figure 16: South America Blood Meal Industry Revenue (billion), by Consumption Analysis 2025 & 2033
- Figure 17: South America Blood Meal Industry Revenue Share (%), by Consumption Analysis 2025 & 2033
- Figure 18: South America Blood Meal Industry Revenue (billion), by Import Market Analysis (Value & Volume) 2025 & 2033
- Figure 19: South America Blood Meal Industry Revenue Share (%), by Import Market Analysis (Value & Volume) 2025 & 2033
- Figure 20: South America Blood Meal Industry Revenue (billion), by Export Market Analysis (Value & Volume) 2025 & 2033
- Figure 21: South America Blood Meal Industry Revenue Share (%), by Export Market Analysis (Value & Volume) 2025 & 2033
- Figure 22: South America Blood Meal Industry Revenue (billion), by Price Trend Analysis 2025 & 2033
- Figure 23: South America Blood Meal Industry Revenue Share (%), by Price Trend Analysis 2025 & 2033
- Figure 24: South America Blood Meal Industry Revenue (billion), by Country 2025 & 2033
- Figure 25: South America Blood Meal Industry Revenue Share (%), by Country 2025 & 2033
- Figure 26: Europe Blood Meal Industry Revenue (billion), by Production Analysis 2025 & 2033
- Figure 27: Europe Blood Meal Industry Revenue Share (%), by Production Analysis 2025 & 2033
- Figure 28: Europe Blood Meal Industry Revenue (billion), by Consumption Analysis 2025 & 2033
- Figure 29: Europe Blood Meal Industry Revenue Share (%), by Consumption Analysis 2025 & 2033
- Figure 30: Europe Blood Meal Industry Revenue (billion), by Import Market Analysis (Value & Volume) 2025 & 2033
- Figure 31: Europe Blood Meal Industry Revenue Share (%), by Import Market Analysis (Value & Volume) 2025 & 2033
- Figure 32: Europe Blood Meal Industry Revenue (billion), by Export Market Analysis (Value & Volume) 2025 & 2033
- Figure 33: Europe Blood Meal Industry Revenue Share (%), by Export Market Analysis (Value & Volume) 2025 & 2033
- Figure 34: Europe Blood Meal Industry Revenue (billion), by Price Trend Analysis 2025 & 2033
- Figure 35: Europe Blood Meal Industry Revenue Share (%), by Price Trend Analysis 2025 & 2033
- Figure 36: Europe Blood Meal Industry Revenue (billion), by Country 2025 & 2033
- Figure 37: Europe Blood Meal Industry Revenue Share (%), by Country 2025 & 2033
- Figure 38: Middle East & Africa Blood Meal Industry Revenue (billion), by Production Analysis 2025 & 2033
- Figure 39: Middle East & Africa Blood Meal Industry Revenue Share (%), by Production Analysis 2025 & 2033
- Figure 40: Middle East & Africa Blood Meal Industry Revenue (billion), by Consumption Analysis 2025 & 2033
- Figure 41: Middle East & Africa Blood Meal Industry Revenue Share (%), by Consumption Analysis 2025 & 2033
- Figure 42: Middle East & Africa Blood Meal Industry Revenue (billion), by Import Market Analysis (Value & Volume) 2025 & 2033
- Figure 43: Middle East & Africa Blood Meal Industry Revenue Share (%), by Import Market Analysis (Value & Volume) 2025 & 2033
- Figure 44: Middle East & Africa Blood Meal Industry Revenue (billion), by Export Market Analysis (Value & Volume) 2025 & 2033
- Figure 45: Middle East & Africa Blood Meal Industry Revenue Share (%), by Export Market Analysis (Value & Volume) 2025 & 2033
- Figure 46: Middle East & Africa Blood Meal Industry Revenue (billion), by Price Trend Analysis 2025 & 2033
- Figure 47: Middle East & Africa Blood Meal Industry Revenue Share (%), by Price Trend Analysis 2025 & 2033
- Figure 48: Middle East & Africa Blood Meal Industry Revenue (billion), by Country 2025 & 2033
- Figure 49: Middle East & Africa Blood Meal Industry Revenue Share (%), by Country 2025 & 2033
- Figure 50: Asia Pacific Blood Meal Industry Revenue (billion), by Production Analysis 2025 & 2033
- Figure 51: Asia Pacific Blood Meal Industry Revenue Share (%), by Production Analysis 2025 & 2033
- Figure 52: Asia Pacific Blood Meal Industry Revenue (billion), by Consumption Analysis 2025 & 2033
- Figure 53: Asia Pacific Blood Meal Industry Revenue Share (%), by Consumption Analysis 2025 & 2033
- Figure 54: Asia Pacific Blood Meal Industry Revenue (billion), by Import Market Analysis (Value & Volume) 2025 & 2033
- Figure 55: Asia Pacific Blood Meal Industry Revenue Share (%), by Import Market Analysis (Value & Volume) 2025 & 2033
- Figure 56: Asia Pacific Blood Meal Industry Revenue (billion), by Export Market Analysis (Value & Volume) 2025 & 2033
- Figure 57: Asia Pacific Blood Meal Industry Revenue Share (%), by Export Market Analysis (Value & Volume) 2025 & 2033
- Figure 58: Asia Pacific Blood Meal Industry Revenue (billion), by Price Trend Analysis 2025 & 2033
- Figure 59: Asia Pacific Blood Meal Industry Revenue Share (%), by Price Trend Analysis 2025 & 2033
- Figure 60: Asia Pacific Blood Meal Industry Revenue (billion), by Country 2025 & 2033
- Figure 61: Asia Pacific Blood Meal Industry Revenue Share (%), by Country 2025 & 2033
List of Tables
- Table 1: Global Blood Meal Industry Revenue billion Forecast, by Production Analysis 2020 & 2033
- Table 2: Global Blood Meal Industry Revenue billion Forecast, by Consumption Analysis 2020 & 2033
- Table 3: Global Blood Meal Industry Revenue billion Forecast, by Import Market Analysis (Value & Volume) 2020 & 2033
- Table 4: Global Blood Meal Industry Revenue billion Forecast, by Export Market Analysis (Value & Volume) 2020 & 2033
- Table 5: Global Blood Meal Industry Revenue billion Forecast, by Price Trend Analysis 2020 & 2033
- Table 6: Global Blood Meal Industry Revenue billion Forecast, by Region 2020 & 2033
- Table 7: Global Blood Meal Industry Revenue billion Forecast, by Production Analysis 2020 & 2033
- Table 8: Global Blood Meal Industry Revenue billion Forecast, by Consumption Analysis 2020 & 2033
- Table 9: Global Blood Meal Industry Revenue billion Forecast, by Import Market Analysis (Value & Volume) 2020 & 2033
- Table 10: Global Blood Meal Industry Revenue billion Forecast, by Export Market Analysis (Value & Volume) 2020 & 2033
- Table 11: Global Blood Meal Industry Revenue billion Forecast, by Price Trend Analysis 2020 & 2033
- Table 12: Global Blood Meal Industry Revenue billion Forecast, by Country 2020 & 2033
- Table 13: United States Blood Meal Industry Revenue (billion) Forecast, by Application 2020 & 2033
- Table 14: Canada Blood Meal Industry Revenue (billion) Forecast, by Application 2020 & 2033
- Table 15: Mexico Blood Meal Industry Revenue (billion) Forecast, by Application 2020 & 2033
- Table 16: Global Blood Meal Industry Revenue billion Forecast, by Production Analysis 2020 & 2033
- Table 17: Global Blood Meal Industry Revenue billion Forecast, by Consumption Analysis 2020 & 2033
- Table 18: Global Blood Meal Industry Revenue billion Forecast, by Import Market Analysis (Value & Volume) 2020 & 2033
- Table 19: Global Blood Meal Industry Revenue billion Forecast, by Export Market Analysis (Value & Volume) 2020 & 2033
- Table 20: Global Blood Meal Industry Revenue billion Forecast, by Price Trend Analysis 2020 & 2033
- Table 21: Global Blood Meal Industry Revenue billion Forecast, by Country 2020 & 2033
- Table 22: Brazil Blood Meal Industry Revenue (billion) Forecast, by Application 2020 & 2033
- Table 23: Argentina Blood Meal Industry Revenue (billion) Forecast, by Application 2020 & 2033
- Table 24: Rest of South America Blood Meal Industry Revenue (billion) Forecast, by Application 2020 & 2033
- Table 25: Global Blood Meal Industry Revenue billion Forecast, by Production Analysis 2020 & 2033
- Table 26: Global Blood Meal Industry Revenue billion Forecast, by Consumption Analysis 2020 & 2033
- Table 27: Global Blood Meal Industry Revenue billion Forecast, by Import Market Analysis (Value & Volume) 2020 & 2033
- Table 28: Global Blood Meal Industry Revenue billion Forecast, by Export Market Analysis (Value & Volume) 2020 & 2033
- Table 29: Global Blood Meal Industry Revenue billion Forecast, by Price Trend Analysis 2020 & 2033
- Table 30: Global Blood Meal Industry Revenue billion Forecast, by Country 2020 & 2033
- Table 31: United Kingdom Blood Meal Industry Revenue (billion) Forecast, by Application 2020 & 2033
- Table 32: Germany Blood Meal Industry Revenue (billion) Forecast, by Application 2020 & 2033
- Table 33: France Blood Meal Industry Revenue (billion) Forecast, by Application 2020 & 2033
- Table 34: Italy Blood Meal Industry Revenue (billion) Forecast, by Application 2020 & 2033
- Table 35: Spain Blood Meal Industry Revenue (billion) Forecast, by Application 2020 & 2033
- Table 36: Russia Blood Meal Industry Revenue (billion) Forecast, by Application 2020 & 2033
- Table 37: Benelux Blood Meal Industry Revenue (billion) Forecast, by Application 2020 & 2033
- Table 38: Nordics Blood Meal Industry Revenue (billion) Forecast, by Application 2020 & 2033
- Table 39: Rest of Europe Blood Meal Industry Revenue (billion) Forecast, by Application 2020 & 2033
- Table 40: Global Blood Meal Industry Revenue billion Forecast, by Production Analysis 2020 & 2033
- Table 41: Global Blood Meal Industry Revenue billion Forecast, by Consumption Analysis 2020 & 2033
- Table 42: Global Blood Meal Industry Revenue billion Forecast, by Import Market Analysis (Value & Volume) 2020 & 2033
- Table 43: Global Blood Meal Industry Revenue billion Forecast, by Export Market Analysis (Value & Volume) 2020 & 2033
- Table 44: Global Blood Meal Industry Revenue billion Forecast, by Price Trend Analysis 2020 & 2033
- Table 45: Global Blood Meal Industry Revenue billion Forecast, by Country 2020 & 2033
- Table 46: Turkey Blood Meal Industry Revenue (billion) Forecast, by Application 2020 & 2033
- Table 47: Israel Blood Meal Industry Revenue (billion) Forecast, by Application 2020 & 2033
- Table 48: GCC Blood Meal Industry Revenue (billion) Forecast, by Application 2020 & 2033
- Table 49: North Africa Blood Meal Industry Revenue (billion) Forecast, by Application 2020 & 2033
- Table 50: South Africa Blood Meal Industry Revenue (billion) Forecast, by Application 2020 & 2033
- Table 51: Rest of Middle East & Africa Blood Meal Industry Revenue (billion) Forecast, by Application 2020 & 2033
- Table 52: Global Blood Meal Industry Revenue billion Forecast, by Production Analysis 2020 & 2033
- Table 53: Global Blood Meal Industry Revenue billion Forecast, by Consumption Analysis 2020 & 2033
- Table 54: Global Blood Meal Industry Revenue billion Forecast, by Import Market Analysis (Value & Volume) 2020 & 2033
- Table 55: Global Blood Meal Industry Revenue billion Forecast, by Export Market Analysis (Value & Volume) 2020 & 2033
- Table 56: Global Blood Meal Industry Revenue billion Forecast, by Price Trend Analysis 2020 & 2033
- Table 57: Global Blood Meal Industry Revenue billion Forecast, by Country 2020 & 2033
- Table 58: China Blood Meal Industry Revenue (billion) Forecast, by Application 2020 & 2033
- Table 59: India Blood Meal Industry Revenue (billion) Forecast, by Application 2020 & 2033
- Table 60: Japan Blood Meal Industry Revenue (billion) Forecast, by Application 2020 & 2033
- Table 61: South Korea Blood Meal Industry Revenue (billion) Forecast, by Application 2020 & 2033
- Table 62: ASEAN Blood Meal Industry Revenue (billion) Forecast, by Application 2020 & 2033
- Table 63: Oceania Blood Meal Industry Revenue (billion) Forecast, by Application 2020 & 2033
- Table 64: Rest of Asia Pacific Blood Meal Industry Revenue (billion) Forecast, by Application 2020 & 2033
Frequently Asked Questions
1. What is the projected Compound Annual Growth Rate (CAGR) of the Blood Meal Industry?
The projected CAGR is approximately 3.63%.
2. Which companies are prominent players in the Blood Meal Industry?
Key companies in the market include Allanasons Pvt Ltd*List Not Exhaustive, Valley Proteins Inc, Terramar Chile, Sanimax, West Coast Reduction Ltd, Darling Ingredients, Boyer Valley Company LLC, Agro-industrial Complex Backa Topola LTD, The Fetrell Company.
3. What are the main segments of the Blood Meal Industry?
The market segments include Production Analysis, Consumption Analysis, Import Market Analysis (Value & Volume), Export Market Analysis (Value & Volume), Price Trend Analysis.
4. Can you provide details about the market size?
The market size is estimated to be USD 1.29 billion as of 2022.
5. What are some drivers contributing to market growth?
Adoption of Organic and Eco-friendly Farming Practices; Declining Area of Arable Land and Rising Food Security Concerns.
6. What are the notable trends driving market growth?
Growing Demand for Animal Meat is creating Market Opportunities.
7. Are there any restraints impacting market growth?
High Demand for Conventional and Synthetic Products; Lack of Awareness and Other Factors Limiting the Adoption of Agricultural Inoculants.
8. Can you provide examples of recent developments in the market?
May 2022: Darling Ingredients acquired Fasa Group for USD 560 million to expand its geographical presence and new product offerings in the global blood meal market.
9. What pricing options are available for accessing the report?
Pricing options include single-user, multi-user, and enterprise licenses priced at USD 4750, USD 5250, and USD 8750 respectively.
10. Is the market size provided in terms of value or volume?
The market size is provided in terms of value, measured in billion.
11. Are there any specific market keywords associated with the report?
Yes, the market keyword associated with the report is "Blood Meal Industry," which aids in identifying and referencing the specific market segment covered.
12. How do I determine which pricing option suits my needs best?
The pricing options vary based on user requirements and access needs. Individual users may opt for single-user licenses, while businesses requiring broader access may choose multi-user or enterprise licenses for cost-effective access to the report.
13. Are there any additional resources or data provided in the Blood Meal Industry report?
While the report offers comprehensive insights, it's advisable to review the specific contents or supplementary materials provided to ascertain if additional resources or data are available.
14. How can I stay updated on further developments or reports in the Blood Meal Industry?
To stay informed about further developments, trends, and reports in the Blood Meal Industry, consider subscribing to industry newsletters, following relevant companies and organizations, or regularly checking reputable industry news sources and publications.
Methodology
Step 1 - Identification of Relevant Samples Size from Population Database


Step 2 - Approaches for Defining Global Market Size (Value, Volume* & Price*)

Note*: In applicable scenarios
Step 3 - Data Sources
Primary Research
- Web Analytics
- Survey Reports
- Research Institute
- Latest Research Reports
- Opinion Leaders
Secondary Research
- Annual Reports
- White Paper
- Latest Press Release
- Industry Association
- Paid Database
- Investor Presentations

Step 4 - Data Triangulation
Involves using different sources of information in order to increase the validity of a study
These sources are likely to be stakeholders in a program - participants, other researchers, program staff, other community members, and so on.
Then we put all data in single framework & apply various statistical tools to find out the dynamic on the market.
During the analysis stage, feedback from the stakeholder groups would be compared to determine areas of agreement as well as areas of divergence