

Key Insights
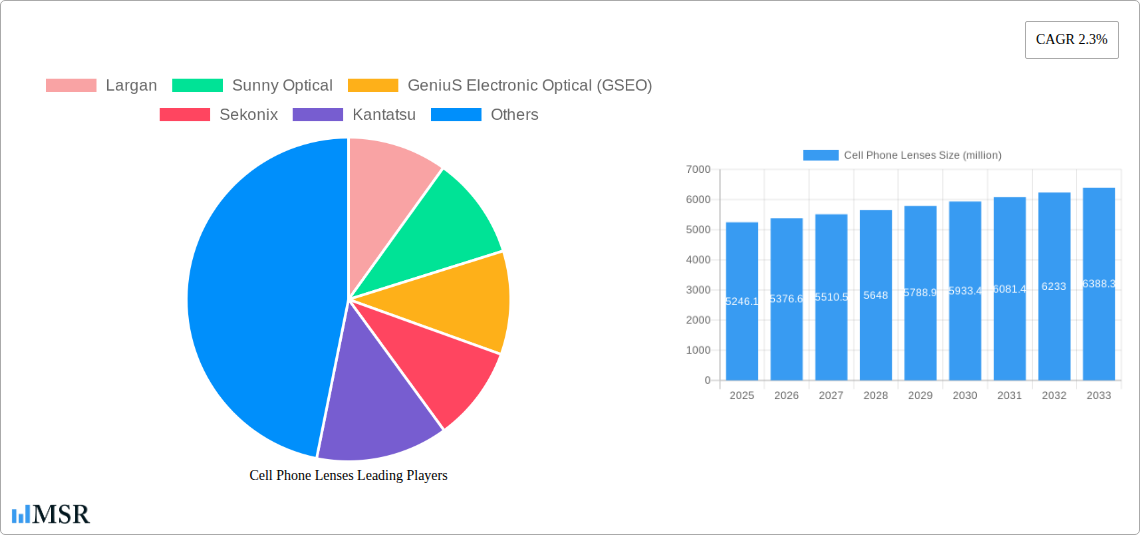
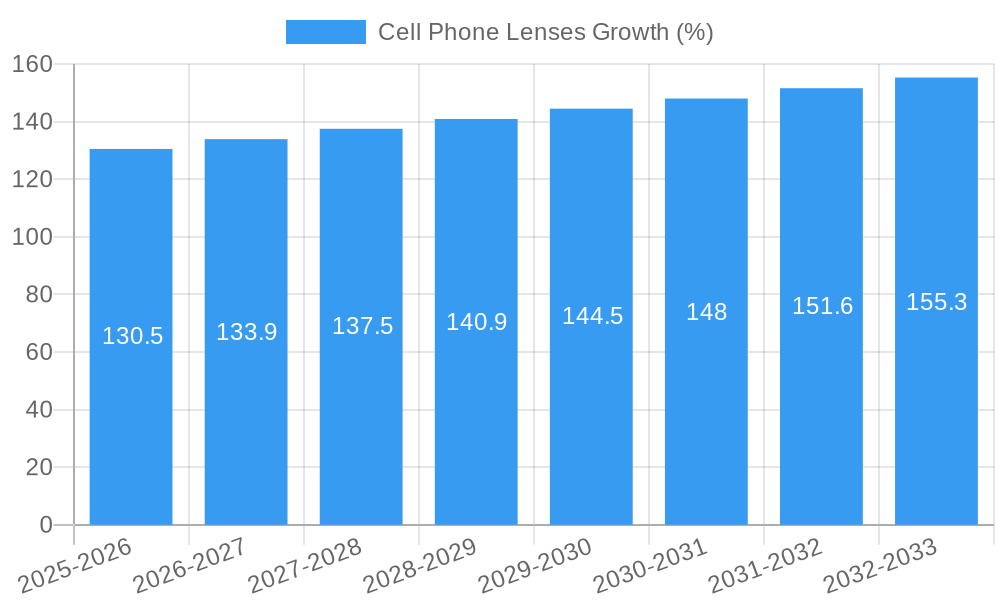
The global cell phone lens market, valued at $5246.1 million in 2025, is projected to experience steady growth, driven by several key factors. The increasing demand for high-resolution cameras in smartphones, fueled by consumer preference for superior image quality and advanced features like multi-lens systems and zoom capabilities, is a significant driver. Furthermore, continuous technological advancements in lens manufacturing, including the development of smaller, lighter, and more efficient lenses with improved optical performance, are contributing to market expansion. The rising adoption of augmented reality (AR) and virtual reality (VR) applications in mobile devices also necessitates sophisticated lens technology, further bolstering market growth. Competition among smartphone manufacturers to offer innovative camera features is also a crucial factor influencing demand. While the Compound Annual Growth Rate (CAGR) of 2.3% suggests a moderate expansion, this figure might underestimate the potential growth in specific segments, particularly those related to advanced lens technologies used in high-end smartphones. The market's relatively low CAGR could also be attributed to economic factors influencing consumer spending and the maturity of the smartphone market itself.
The market is segmented by lens type (wide-angle, telephoto, ultra-wide, macro, etc.), material, and application. Key players like Largan, Sunny Optical, and Genius Electronic Optical (GSEO) hold significant market share, driving innovation and competition. Regional variations in market growth will likely reflect differences in smartphone penetration rates and consumer spending patterns across various geographic areas. While the current analysis highlights a steady, albeit moderate, growth trajectory, future market dynamics could be influenced by emerging technologies like periscope lenses, improved sensor technology, and the evolving landscape of smartphone design and functionality. Furthermore, supply chain considerations and geopolitical factors could impact manufacturing costs and market accessibility. The forecast period (2025-2033) presents opportunities for companies to innovate and capitalize on the ongoing demand for high-quality mobile photography and advanced imaging capabilities.
Unlock the Potential: A Comprehensive Report on the Cell Phone Lenses Market (2019-2033)
This in-depth report provides a comprehensive analysis of the global cell phone lenses market, encompassing market size, growth drivers, key players, technological advancements, and future trends. The study period covers 2019-2033, with 2025 as the base and estimated year. This report is invaluable for industry stakeholders, investors, and anyone seeking a clear understanding of this dynamic market. The global market is projected to surpass $XX million by 2033, showcasing significant growth opportunities.
Cell Phone Lenses Market Concentration & Dynamics
This section analyzes the competitive landscape, encompassing market concentration, innovation, regulations, substitutes, end-user trends, and mergers & acquisitions (M&A) activities within the cell phone lenses market. The report details the market share held by leading players like Largan, Sunny Optical, and Genius Electronic Optical (GSEO), amongst others. We assess the impact of strategic alliances, technological disruptions, and regulatory changes on market dynamics.
- Market Concentration: The market exhibits a moderately concentrated structure, with the top five players holding approximately XX% of the global market share in 2025. This concentration is expected to [increase/decrease] slightly by 2033.
- Innovation Ecosystems: Significant R&D investments are driving innovation in areas such as multi-camera systems, periscope lenses, and advanced image stabilization technologies.
- Regulatory Frameworks: Government regulations regarding data privacy and environmental standards influence the manufacturing processes and product design of cell phone lenses.
- Substitute Products: The emergence of alternative imaging technologies could pose a challenge to traditional cell phone lenses, requiring constant innovation.
- End-User Trends: The increasing demand for high-quality smartphone cameras, particularly among younger demographics, fuels market growth.
- M&A Activities: The report tracks M&A activities, noting xx major deals during the historical period (2019-2024), highlighting a trend towards consolidation within the industry.
Cell Phone Lenses Industry Insights & Trends
This section dives deep into the factors driving market growth, technological disruptions, and shifting consumer preferences within the cell phone lens industry. The report analyses market size, compound annual growth rate (CAGR), and market segmentation, providing a detailed picture of this evolving landscape. The global market size reached approximately $XX million in 2025, exhibiting a CAGR of XX% during the historical period and projected to grow at XX% during the forecast period (2025-2033). Several key technological disruptions such as advancements in lens materials, manufacturing processes, and image processing technologies are extensively discussed, along with their impacts on market dynamics. Evolving consumer preferences for enhanced imaging capabilities in smartphones are analysed.
Key Markets & Segments Leading Cell Phone Lenses
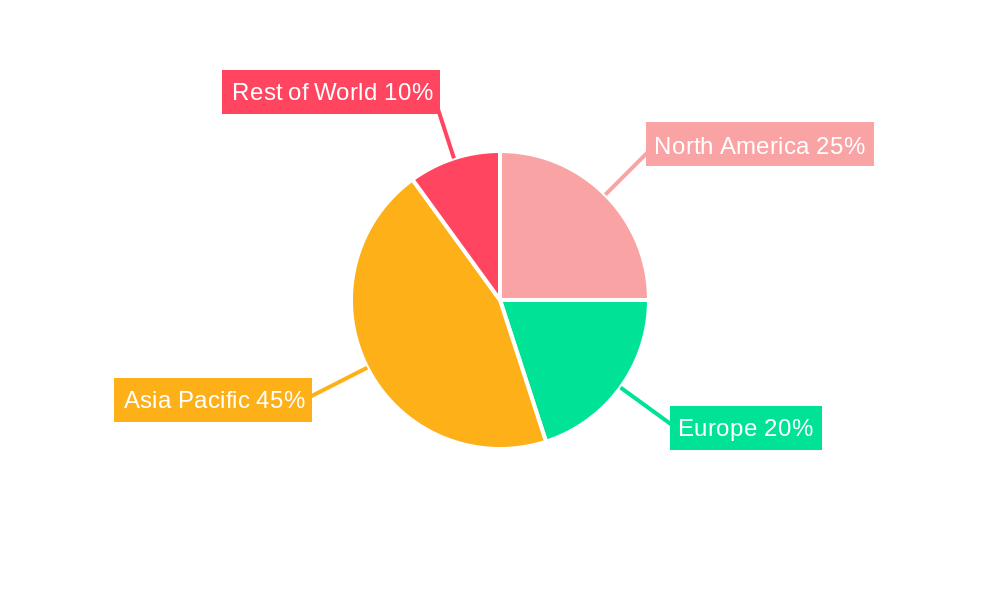
This section identifies the dominant regions, countries, and segments within the cell phone lenses market. Factors driving segment dominance are detailed using bullet points and paragraphs. Asia, specifically China, is expected to remain the leading market.
- Dominant Regions/Countries: Asia, particularly China, holds the largest market share due to its robust smartphone manufacturing industry and high consumer demand. North America and Europe follow as significant markets.
- Drivers of Dominance:
- Asia: Strong domestic smartphone production, high consumer adoption rate of smartphones with advanced camera features, a significant presence of major lens manufacturers, and favorable government policies.
- North America: High per capita disposable income, a strong demand for high-quality mobile photography, and the presence of key players in the value chain.
- Europe: Growing smartphone penetration, increasing adoption of high-end smartphones with advanced camera functionalities, and a well-established market for electronics.
Cell Phone Lenses Product Developments
This section summarizes recent product innovations and their impact on the market. Significant advancements in lens technology, such as the development of periscope lenses, and improvements in image stabilization are impacting market competitiveness. These developments are driving a shift towards higher resolution and improved image quality, thereby increasing market relevance.
Challenges in the Cell Phone Lenses Market
The cell phone lenses market faces challenges such as supply chain disruptions, intense competition among manufacturers, and stringent regulatory requirements impacting production costs and timelines. These factors pose significant hurdles to market expansion, potentially resulting in a xx% reduction in projected growth in certain scenarios.
Forces Driving Cell Phone Lenses Growth
Key growth drivers include the increasing demand for high-resolution smartphone cameras, technological advancements in lens design, and the expansion of the smartphone market. The rising adoption of 5G technology is also anticipated to further boost the demand for high-quality mobile photography, driving market growth.
Challenges in the Cell Phone Lenses Market (Long-Term Growth Catalysts)
Long-term growth is propelled by innovations such as liquid lenses, freeform lenses and advancements in AR/VR applications. Strategic partnerships and market expansions into developing economies will play a crucial role in shaping the industry's trajectory.
Emerging Opportunities in Cell Phone Lenses
Emerging opportunities lie in the development of augmented reality (AR) and virtual reality (VR) applications for smartphones, the integration of advanced sensor technologies into lenses, and the growth of the foldable smartphone market. These emerging trends will create new market segments and drive demand for specialized cell phone lenses.
Leading Players in the Cell Phone Lenses Sector
- Largan Precision Co., Ltd. (Largan)
- Sunny Optical Technology (Holdings) Co., Ltd. (Sunny Optical)
- GeniuS Electronic Optical (GSEO)
- Sekonix
- Kantatsu
- Kolen
- Cha Diostech
- Asia Optical
- Newmax
- Ability Opto-Electronics
- Kin
Key Milestones in Cell Phone Lenses Industry
- 2020: Introduction of the first commercially viable periscope lens for smartphones.
- 2022: Significant advancements in liquid lens technology.
- 2023: Major partnership between a lens manufacturer and a smartphone brand for the development of a new camera system. (Specific details would be added in the full report).
Strategic Outlook for Cell Phone Lenses Market
The future of the cell phone lenses market is promising, driven by continued technological innovation and the increasing demand for high-quality mobile photography. Strategic investments in R&D, strategic partnerships, and expansion into emerging markets will be crucial for success in this dynamic sector. The market is poised for sustained growth, with significant opportunities for companies that can adapt to evolving consumer preferences and technological advancements.
Cell Phone Lenses Segmentation
-
1. Application
- 1.1. Front Camera
- 1.2. Rear Camera
-
2. Types
- 2.1. Wide-angle Lens
- 2.2. Ultra-wide-angle Lens
- 2.3. Telephoto Lens
- 2.4. Macro Lens
- 2.5. Monochrome Lens
Cell Phone Lenses Segmentation By Geography
-
1. North America
- 1.1. United States
- 1.2. Canada
- 1.3. Mexico
-
2. South America
- 2.1. Brazil
- 2.2. Argentina
- 2.3. Rest of South America
-
3. Europe
- 3.1. United Kingdom
- 3.2. Germany
- 3.3. France
- 3.4. Italy
- 3.5. Spain
- 3.6. Russia
- 3.7. Benelux
- 3.8. Nordics
- 3.9. Rest of Europe
-
4. Middle East & Africa
- 4.1. Turkey
- 4.2. Israel
- 4.3. GCC
- 4.4. North Africa
- 4.5. South Africa
- 4.6. Rest of Middle East & Africa
-
5. Asia Pacific
- 5.1. China
- 5.2. India
- 5.3. Japan
- 5.4. South Korea
- 5.5. ASEAN
- 5.6. Oceania
- 5.7. Rest of Asia Pacific
Cell Phone Lenses REPORT HIGHLIGHTS
| Aspects | Details |
|---|---|
| Study Period | 2019-2033 |
| Base Year | 2024 |
| Estimated Year | 2025 |
| Forecast Period | 2025-2033 |
| Historical Period | 2019-2024 |
| Growth Rate | CAGR of 2.3% from 2019-2033 |
| Segmentation |
|
Table of Contents
- 1. Introduction
- 1.1. Research Scope
- 1.2. Market Segmentation
- 1.3. Research Methodology
- 1.4. Definitions and Assumptions
- 2. Executive Summary
- 2.1. Introduction
- 3. Market Dynamics
- 3.1. Introduction
- 3.2. Market Drivers
- 3.3. Market Restrains
- 3.4. Market Trends
- 4. Market Factor Analysis
- 4.1. Porters Five Forces
- 4.2. Supply/Value Chain
- 4.3. PESTEL analysis
- 4.4. Market Entropy
- 4.5. Patent/Trademark Analysis
- 5. Global Cell Phone Lenses Analysis, Insights and Forecast, 2019-2031
- 5.1. Market Analysis, Insights and Forecast - by Application
- 5.1.1. Front Camera
- 5.1.2. Rear Camera
- 5.2. Market Analysis, Insights and Forecast - by Types
- 5.2.1. Wide-angle Lens
- 5.2.2. Ultra-wide-angle Lens
- 5.2.3. Telephoto Lens
- 5.2.4. Macro Lens
- 5.2.5. Monochrome Lens
- 5.3. Market Analysis, Insights and Forecast - by Region
- 5.3.1. North America
- 5.3.2. South America
- 5.3.3. Europe
- 5.3.4. Middle East & Africa
- 5.3.5. Asia Pacific
- 5.1. Market Analysis, Insights and Forecast - by Application
- 6. North America Cell Phone Lenses Analysis, Insights and Forecast, 2019-2031
- 6.1. Market Analysis, Insights and Forecast - by Application
- 6.1.1. Front Camera
- 6.1.2. Rear Camera
- 6.2. Market Analysis, Insights and Forecast - by Types
- 6.2.1. Wide-angle Lens
- 6.2.2. Ultra-wide-angle Lens
- 6.2.3. Telephoto Lens
- 6.2.4. Macro Lens
- 6.2.5. Monochrome Lens
- 6.1. Market Analysis, Insights and Forecast - by Application
- 7. South America Cell Phone Lenses Analysis, Insights and Forecast, 2019-2031
- 7.1. Market Analysis, Insights and Forecast - by Application
- 7.1.1. Front Camera
- 7.1.2. Rear Camera
- 7.2. Market Analysis, Insights and Forecast - by Types
- 7.2.1. Wide-angle Lens
- 7.2.2. Ultra-wide-angle Lens
- 7.2.3. Telephoto Lens
- 7.2.4. Macro Lens
- 7.2.5. Monochrome Lens
- 7.1. Market Analysis, Insights and Forecast - by Application
- 8. Europe Cell Phone Lenses Analysis, Insights and Forecast, 2019-2031
- 8.1. Market Analysis, Insights and Forecast - by Application
- 8.1.1. Front Camera
- 8.1.2. Rear Camera
- 8.2. Market Analysis, Insights and Forecast - by Types
- 8.2.1. Wide-angle Lens
- 8.2.2. Ultra-wide-angle Lens
- 8.2.3. Telephoto Lens
- 8.2.4. Macro Lens
- 8.2.5. Monochrome Lens
- 8.1. Market Analysis, Insights and Forecast - by Application
- 9. Middle East & Africa Cell Phone Lenses Analysis, Insights and Forecast, 2019-2031
- 9.1. Market Analysis, Insights and Forecast - by Application
- 9.1.1. Front Camera
- 9.1.2. Rear Camera
- 9.2. Market Analysis, Insights and Forecast - by Types
- 9.2.1. Wide-angle Lens
- 9.2.2. Ultra-wide-angle Lens
- 9.2.3. Telephoto Lens
- 9.2.4. Macro Lens
- 9.2.5. Monochrome Lens
- 9.1. Market Analysis, Insights and Forecast - by Application
- 10. Asia Pacific Cell Phone Lenses Analysis, Insights and Forecast, 2019-2031
- 10.1. Market Analysis, Insights and Forecast - by Application
- 10.1.1. Front Camera
- 10.1.2. Rear Camera
- 10.2. Market Analysis, Insights and Forecast - by Types
- 10.2.1. Wide-angle Lens
- 10.2.2. Ultra-wide-angle Lens
- 10.2.3. Telephoto Lens
- 10.2.4. Macro Lens
- 10.2.5. Monochrome Lens
- 10.1. Market Analysis, Insights and Forecast - by Application
- 11. Competitive Analysis
- 11.1. Global Market Share Analysis 2024
- 11.2. Company Profiles
- 11.2.1 Largan
- 11.2.1.1. Overview
- 11.2.1.2. Products
- 11.2.1.3. SWOT Analysis
- 11.2.1.4. Recent Developments
- 11.2.1.5. Financials (Based on Availability)
- 11.2.2 Sunny Optical
- 11.2.2.1. Overview
- 11.2.2.2. Products
- 11.2.2.3. SWOT Analysis
- 11.2.2.4. Recent Developments
- 11.2.2.5. Financials (Based on Availability)
- 11.2.3 GeniuS Electronic Optical (GSEO)
- 11.2.3.1. Overview
- 11.2.3.2. Products
- 11.2.3.3. SWOT Analysis
- 11.2.3.4. Recent Developments
- 11.2.3.5. Financials (Based on Availability)
- 11.2.4 Sekonix
- 11.2.4.1. Overview
- 11.2.4.2. Products
- 11.2.4.3. SWOT Analysis
- 11.2.4.4. Recent Developments
- 11.2.4.5. Financials (Based on Availability)
- 11.2.5 Kantatsu
- 11.2.5.1. Overview
- 11.2.5.2. Products
- 11.2.5.3. SWOT Analysis
- 11.2.5.4. Recent Developments
- 11.2.5.5. Financials (Based on Availability)
- 11.2.6 Kolen
- 11.2.6.1. Overview
- 11.2.6.2. Products
- 11.2.6.3. SWOT Analysis
- 11.2.6.4. Recent Developments
- 11.2.6.5. Financials (Based on Availability)
- 11.2.7 Cha Diostech
- 11.2.7.1. Overview
- 11.2.7.2. Products
- 11.2.7.3. SWOT Analysis
- 11.2.7.4. Recent Developments
- 11.2.7.5. Financials (Based on Availability)
- 11.2.8 Asia Optical
- 11.2.8.1. Overview
- 11.2.8.2. Products
- 11.2.8.3. SWOT Analysis
- 11.2.8.4. Recent Developments
- 11.2.8.5. Financials (Based on Availability)
- 11.2.9 Newmax
- 11.2.9.1. Overview
- 11.2.9.2. Products
- 11.2.9.3. SWOT Analysis
- 11.2.9.4. Recent Developments
- 11.2.9.5. Financials (Based on Availability)
- 11.2.10 Ability Opto-Electronics
- 11.2.10.1. Overview
- 11.2.10.2. Products
- 11.2.10.3. SWOT Analysis
- 11.2.10.4. Recent Developments
- 11.2.10.5. Financials (Based on Availability)
- 11.2.11 Kin
- 11.2.11.1. Overview
- 11.2.11.2. Products
- 11.2.11.3. SWOT Analysis
- 11.2.11.4. Recent Developments
- 11.2.11.5. Financials (Based on Availability)
- 11.2.1 Largan
List of Figures
- Figure 1: Global Cell Phone Lenses Revenue Breakdown (million, %) by Region 2024 & 2032
- Figure 2: Global Cell Phone Lenses Volume Breakdown (K, %) by Region 2024 & 2032
- Figure 3: North America Cell Phone Lenses Revenue (million), by Application 2024 & 2032
- Figure 4: North America Cell Phone Lenses Volume (K), by Application 2024 & 2032
- Figure 5: North America Cell Phone Lenses Revenue Share (%), by Application 2024 & 2032
- Figure 6: North America Cell Phone Lenses Volume Share (%), by Application 2024 & 2032
- Figure 7: North America Cell Phone Lenses Revenue (million), by Types 2024 & 2032
- Figure 8: North America Cell Phone Lenses Volume (K), by Types 2024 & 2032
- Figure 9: North America Cell Phone Lenses Revenue Share (%), by Types 2024 & 2032
- Figure 10: North America Cell Phone Lenses Volume Share (%), by Types 2024 & 2032
- Figure 11: North America Cell Phone Lenses Revenue (million), by Country 2024 & 2032
- Figure 12: North America Cell Phone Lenses Volume (K), by Country 2024 & 2032
- Figure 13: North America Cell Phone Lenses Revenue Share (%), by Country 2024 & 2032
- Figure 14: North America Cell Phone Lenses Volume Share (%), by Country 2024 & 2032
- Figure 15: South America Cell Phone Lenses Revenue (million), by Application 2024 & 2032
- Figure 16: South America Cell Phone Lenses Volume (K), by Application 2024 & 2032
- Figure 17: South America Cell Phone Lenses Revenue Share (%), by Application 2024 & 2032
- Figure 18: South America Cell Phone Lenses Volume Share (%), by Application 2024 & 2032
- Figure 19: South America Cell Phone Lenses Revenue (million), by Types 2024 & 2032
- Figure 20: South America Cell Phone Lenses Volume (K), by Types 2024 & 2032
- Figure 21: South America Cell Phone Lenses Revenue Share (%), by Types 2024 & 2032
- Figure 22: South America Cell Phone Lenses Volume Share (%), by Types 2024 & 2032
- Figure 23: South America Cell Phone Lenses Revenue (million), by Country 2024 & 2032
- Figure 24: South America Cell Phone Lenses Volume (K), by Country 2024 & 2032
- Figure 25: South America Cell Phone Lenses Revenue Share (%), by Country 2024 & 2032
- Figure 26: South America Cell Phone Lenses Volume Share (%), by Country 2024 & 2032
- Figure 27: Europe Cell Phone Lenses Revenue (million), by Application 2024 & 2032
- Figure 28: Europe Cell Phone Lenses Volume (K), by Application 2024 & 2032
- Figure 29: Europe Cell Phone Lenses Revenue Share (%), by Application 2024 & 2032
- Figure 30: Europe Cell Phone Lenses Volume Share (%), by Application 2024 & 2032
- Figure 31: Europe Cell Phone Lenses Revenue (million), by Types 2024 & 2032
- Figure 32: Europe Cell Phone Lenses Volume (K), by Types 2024 & 2032
- Figure 33: Europe Cell Phone Lenses Revenue Share (%), by Types 2024 & 2032
- Figure 34: Europe Cell Phone Lenses Volume Share (%), by Types 2024 & 2032
- Figure 35: Europe Cell Phone Lenses Revenue (million), by Country 2024 & 2032
- Figure 36: Europe Cell Phone Lenses Volume (K), by Country 2024 & 2032
- Figure 37: Europe Cell Phone Lenses Revenue Share (%), by Country 2024 & 2032
- Figure 38: Europe Cell Phone Lenses Volume Share (%), by Country 2024 & 2032
- Figure 39: Middle East & Africa Cell Phone Lenses Revenue (million), by Application 2024 & 2032
- Figure 40: Middle East & Africa Cell Phone Lenses Volume (K), by Application 2024 & 2032
- Figure 41: Middle East & Africa Cell Phone Lenses Revenue Share (%), by Application 2024 & 2032
- Figure 42: Middle East & Africa Cell Phone Lenses Volume Share (%), by Application 2024 & 2032
- Figure 43: Middle East & Africa Cell Phone Lenses Revenue (million), by Types 2024 & 2032
- Figure 44: Middle East & Africa Cell Phone Lenses Volume (K), by Types 2024 & 2032
- Figure 45: Middle East & Africa Cell Phone Lenses Revenue Share (%), by Types 2024 & 2032
- Figure 46: Middle East & Africa Cell Phone Lenses Volume Share (%), by Types 2024 & 2032
- Figure 47: Middle East & Africa Cell Phone Lenses Revenue (million), by Country 2024 & 2032
- Figure 48: Middle East & Africa Cell Phone Lenses Volume (K), by Country 2024 & 2032
- Figure 49: Middle East & Africa Cell Phone Lenses Revenue Share (%), by Country 2024 & 2032
- Figure 50: Middle East & Africa Cell Phone Lenses Volume Share (%), by Country 2024 & 2032
- Figure 51: Asia Pacific Cell Phone Lenses Revenue (million), by Application 2024 & 2032
- Figure 52: Asia Pacific Cell Phone Lenses Volume (K), by Application 2024 & 2032
- Figure 53: Asia Pacific Cell Phone Lenses Revenue Share (%), by Application 2024 & 2032
- Figure 54: Asia Pacific Cell Phone Lenses Volume Share (%), by Application 2024 & 2032
- Figure 55: Asia Pacific Cell Phone Lenses Revenue (million), by Types 2024 & 2032
- Figure 56: Asia Pacific Cell Phone Lenses Volume (K), by Types 2024 & 2032
- Figure 57: Asia Pacific Cell Phone Lenses Revenue Share (%), by Types 2024 & 2032
- Figure 58: Asia Pacific Cell Phone Lenses Volume Share (%), by Types 2024 & 2032
- Figure 59: Asia Pacific Cell Phone Lenses Revenue (million), by Country 2024 & 2032
- Figure 60: Asia Pacific Cell Phone Lenses Volume (K), by Country 2024 & 2032
- Figure 61: Asia Pacific Cell Phone Lenses Revenue Share (%), by Country 2024 & 2032
- Figure 62: Asia Pacific Cell Phone Lenses Volume Share (%), by Country 2024 & 2032
List of Tables
- Table 1: Global Cell Phone Lenses Revenue million Forecast, by Region 2019 & 2032
- Table 2: Global Cell Phone Lenses Volume K Forecast, by Region 2019 & 2032
- Table 3: Global Cell Phone Lenses Revenue million Forecast, by Application 2019 & 2032
- Table 4: Global Cell Phone Lenses Volume K Forecast, by Application 2019 & 2032
- Table 5: Global Cell Phone Lenses Revenue million Forecast, by Types 2019 & 2032
- Table 6: Global Cell Phone Lenses Volume K Forecast, by Types 2019 & 2032
- Table 7: Global Cell Phone Lenses Revenue million Forecast, by Region 2019 & 2032
- Table 8: Global Cell Phone Lenses Volume K Forecast, by Region 2019 & 2032
- Table 9: Global Cell Phone Lenses Revenue million Forecast, by Application 2019 & 2032
- Table 10: Global Cell Phone Lenses Volume K Forecast, by Application 2019 & 2032
- Table 11: Global Cell Phone Lenses Revenue million Forecast, by Types 2019 & 2032
- Table 12: Global Cell Phone Lenses Volume K Forecast, by Types 2019 & 2032
- Table 13: Global Cell Phone Lenses Revenue million Forecast, by Country 2019 & 2032
- Table 14: Global Cell Phone Lenses Volume K Forecast, by Country 2019 & 2032
- Table 15: United States Cell Phone Lenses Revenue (million) Forecast, by Application 2019 & 2032
- Table 16: United States Cell Phone Lenses Volume (K) Forecast, by Application 2019 & 2032
- Table 17: Canada Cell Phone Lenses Revenue (million) Forecast, by Application 2019 & 2032
- Table 18: Canada Cell Phone Lenses Volume (K) Forecast, by Application 2019 & 2032
- Table 19: Mexico Cell Phone Lenses Revenue (million) Forecast, by Application 2019 & 2032
- Table 20: Mexico Cell Phone Lenses Volume (K) Forecast, by Application 2019 & 2032
- Table 21: Global Cell Phone Lenses Revenue million Forecast, by Application 2019 & 2032
- Table 22: Global Cell Phone Lenses Volume K Forecast, by Application 2019 & 2032
- Table 23: Global Cell Phone Lenses Revenue million Forecast, by Types 2019 & 2032
- Table 24: Global Cell Phone Lenses Volume K Forecast, by Types 2019 & 2032
- Table 25: Global Cell Phone Lenses Revenue million Forecast, by Country 2019 & 2032
- Table 26: Global Cell Phone Lenses Volume K Forecast, by Country 2019 & 2032
- Table 27: Brazil Cell Phone Lenses Revenue (million) Forecast, by Application 2019 & 2032
- Table 28: Brazil Cell Phone Lenses Volume (K) Forecast, by Application 2019 & 2032
- Table 29: Argentina Cell Phone Lenses Revenue (million) Forecast, by Application 2019 & 2032
- Table 30: Argentina Cell Phone Lenses Volume (K) Forecast, by Application 2019 & 2032
- Table 31: Rest of South America Cell Phone Lenses Revenue (million) Forecast, by Application 2019 & 2032
- Table 32: Rest of South America Cell Phone Lenses Volume (K) Forecast, by Application 2019 & 2032
- Table 33: Global Cell Phone Lenses Revenue million Forecast, by Application 2019 & 2032
- Table 34: Global Cell Phone Lenses Volume K Forecast, by Application 2019 & 2032
- Table 35: Global Cell Phone Lenses Revenue million Forecast, by Types 2019 & 2032
- Table 36: Global Cell Phone Lenses Volume K Forecast, by Types 2019 & 2032
- Table 37: Global Cell Phone Lenses Revenue million Forecast, by Country 2019 & 2032
- Table 38: Global Cell Phone Lenses Volume K Forecast, by Country 2019 & 2032
- Table 39: United Kingdom Cell Phone Lenses Revenue (million) Forecast, by Application 2019 & 2032
- Table 40: United Kingdom Cell Phone Lenses Volume (K) Forecast, by Application 2019 & 2032
- Table 41: Germany Cell Phone Lenses Revenue (million) Forecast, by Application 2019 & 2032
- Table 42: Germany Cell Phone Lenses Volume (K) Forecast, by Application 2019 & 2032
- Table 43: France Cell Phone Lenses Revenue (million) Forecast, by Application 2019 & 2032
- Table 44: France Cell Phone Lenses Volume (K) Forecast, by Application 2019 & 2032
- Table 45: Italy Cell Phone Lenses Revenue (million) Forecast, by Application 2019 & 2032
- Table 46: Italy Cell Phone Lenses Volume (K) Forecast, by Application 2019 & 2032
- Table 47: Spain Cell Phone Lenses Revenue (million) Forecast, by Application 2019 & 2032
- Table 48: Spain Cell Phone Lenses Volume (K) Forecast, by Application 2019 & 2032
- Table 49: Russia Cell Phone Lenses Revenue (million) Forecast, by Application 2019 & 2032
- Table 50: Russia Cell Phone Lenses Volume (K) Forecast, by Application 2019 & 2032
- Table 51: Benelux Cell Phone Lenses Revenue (million) Forecast, by Application 2019 & 2032
- Table 52: Benelux Cell Phone Lenses Volume (K) Forecast, by Application 2019 & 2032
- Table 53: Nordics Cell Phone Lenses Revenue (million) Forecast, by Application 2019 & 2032
- Table 54: Nordics Cell Phone Lenses Volume (K) Forecast, by Application 2019 & 2032
- Table 55: Rest of Europe Cell Phone Lenses Revenue (million) Forecast, by Application 2019 & 2032
- Table 56: Rest of Europe Cell Phone Lenses Volume (K) Forecast, by Application 2019 & 2032
- Table 57: Global Cell Phone Lenses Revenue million Forecast, by Application 2019 & 2032
- Table 58: Global Cell Phone Lenses Volume K Forecast, by Application 2019 & 2032
- Table 59: Global Cell Phone Lenses Revenue million Forecast, by Types 2019 & 2032
- Table 60: Global Cell Phone Lenses Volume K Forecast, by Types 2019 & 2032
- Table 61: Global Cell Phone Lenses Revenue million Forecast, by Country 2019 & 2032
- Table 62: Global Cell Phone Lenses Volume K Forecast, by Country 2019 & 2032
- Table 63: Turkey Cell Phone Lenses Revenue (million) Forecast, by Application 2019 & 2032
- Table 64: Turkey Cell Phone Lenses Volume (K) Forecast, by Application 2019 & 2032
- Table 65: Israel Cell Phone Lenses Revenue (million) Forecast, by Application 2019 & 2032
- Table 66: Israel Cell Phone Lenses Volume (K) Forecast, by Application 2019 & 2032
- Table 67: GCC Cell Phone Lenses Revenue (million) Forecast, by Application 2019 & 2032
- Table 68: GCC Cell Phone Lenses Volume (K) Forecast, by Application 2019 & 2032
- Table 69: North Africa Cell Phone Lenses Revenue (million) Forecast, by Application 2019 & 2032
- Table 70: North Africa Cell Phone Lenses Volume (K) Forecast, by Application 2019 & 2032
- Table 71: South Africa Cell Phone Lenses Revenue (million) Forecast, by Application 2019 & 2032
- Table 72: South Africa Cell Phone Lenses Volume (K) Forecast, by Application 2019 & 2032
- Table 73: Rest of Middle East & Africa Cell Phone Lenses Revenue (million) Forecast, by Application 2019 & 2032
- Table 74: Rest of Middle East & Africa Cell Phone Lenses Volume (K) Forecast, by Application 2019 & 2032
- Table 75: Global Cell Phone Lenses Revenue million Forecast, by Application 2019 & 2032
- Table 76: Global Cell Phone Lenses Volume K Forecast, by Application 2019 & 2032
- Table 77: Global Cell Phone Lenses Revenue million Forecast, by Types 2019 & 2032
- Table 78: Global Cell Phone Lenses Volume K Forecast, by Types 2019 & 2032
- Table 79: Global Cell Phone Lenses Revenue million Forecast, by Country 2019 & 2032
- Table 80: Global Cell Phone Lenses Volume K Forecast, by Country 2019 & 2032
- Table 81: China Cell Phone Lenses Revenue (million) Forecast, by Application 2019 & 2032
- Table 82: China Cell Phone Lenses Volume (K) Forecast, by Application 2019 & 2032
- Table 83: India Cell Phone Lenses Revenue (million) Forecast, by Application 2019 & 2032
- Table 84: India Cell Phone Lenses Volume (K) Forecast, by Application 2019 & 2032
- Table 85: Japan Cell Phone Lenses Revenue (million) Forecast, by Application 2019 & 2032
- Table 86: Japan Cell Phone Lenses Volume (K) Forecast, by Application 2019 & 2032
- Table 87: South Korea Cell Phone Lenses Revenue (million) Forecast, by Application 2019 & 2032
- Table 88: South Korea Cell Phone Lenses Volume (K) Forecast, by Application 2019 & 2032
- Table 89: ASEAN Cell Phone Lenses Revenue (million) Forecast, by Application 2019 & 2032
- Table 90: ASEAN Cell Phone Lenses Volume (K) Forecast, by Application 2019 & 2032
- Table 91: Oceania Cell Phone Lenses Revenue (million) Forecast, by Application 2019 & 2032
- Table 92: Oceania Cell Phone Lenses Volume (K) Forecast, by Application 2019 & 2032
- Table 93: Rest of Asia Pacific Cell Phone Lenses Revenue (million) Forecast, by Application 2019 & 2032
- Table 94: Rest of Asia Pacific Cell Phone Lenses Volume (K) Forecast, by Application 2019 & 2032
Frequently Asked Questions
1. What is the projected Compound Annual Growth Rate (CAGR) of the Cell Phone Lenses?
The projected CAGR is approximately 2.3%.
2. Which companies are prominent players in the Cell Phone Lenses?
Key companies in the market include Largan, Sunny Optical, GeniuS Electronic Optical (GSEO), Sekonix, Kantatsu, Kolen, Cha Diostech, Asia Optical, Newmax, Ability Opto-Electronics, Kin.
3. What are the main segments of the Cell Phone Lenses?
The market segments include Application, Types.
4. Can you provide details about the market size?
The market size is estimated to be USD 5246.1 million as of 2022.
5. What are some drivers contributing to market growth?
N/A
6. What are the notable trends driving market growth?
N/A
7. Are there any restraints impacting market growth?
N/A
8. Can you provide examples of recent developments in the market?
N/A
9. What pricing options are available for accessing the report?
Pricing options include single-user, multi-user, and enterprise licenses priced at USD 3350.00, USD 5025.00, and USD 6700.00 respectively.
10. Is the market size provided in terms of value or volume?
The market size is provided in terms of value, measured in million and volume, measured in K.
11. Are there any specific market keywords associated with the report?
Yes, the market keyword associated with the report is "Cell Phone Lenses," which aids in identifying and referencing the specific market segment covered.
12. How do I determine which pricing option suits my needs best?
The pricing options vary based on user requirements and access needs. Individual users may opt for single-user licenses, while businesses requiring broader access may choose multi-user or enterprise licenses for cost-effective access to the report.
13. Are there any additional resources or data provided in the Cell Phone Lenses report?
While the report offers comprehensive insights, it's advisable to review the specific contents or supplementary materials provided to ascertain if additional resources or data are available.
14. How can I stay updated on further developments or reports in the Cell Phone Lenses?
To stay informed about further developments, trends, and reports in the Cell Phone Lenses, consider subscribing to industry newsletters, following relevant companies and organizations, or regularly checking reputable industry news sources and publications.
Methodology
Step 1 - Identification of Relevant Samples Size from Population Database


Step 2 - Approaches for Defining Global Market Size (Value, Volume* & Price*)

Note*: In applicable scenarios
Step 3 - Data Sources
Primary Research
- Web Analytics
- Survey Reports
- Research Institute
- Latest Research Reports
- Opinion Leaders
Secondary Research
- Annual Reports
- White Paper
- Latest Press Release
- Industry Association
- Paid Database
- Investor Presentations

Step 4 - Data Triangulation
Involves using different sources of information in order to increase the validity of a study
These sources are likely to be stakeholders in a program - participants, other researchers, program staff, other community members, and so on.
Then we put all data in single framework & apply various statistical tools to find out the dynamic on the market.
During the analysis stage, feedback from the stakeholder groups would be compared to determine areas of agreement as well as areas of divergence
