

Key Insights
The global Christmas tree market, valued at $1.27 billion in the base year of 2024, is projected to achieve a robust Compound Annual Growth Rate (CAGR) of 4.63%. This growth is propelled by escalating global demand for oil and gas, necessitating advanced wellhead equipment. Technological innovations are enhancing operational safety and environmental sustainability through sophisticated tree designs. The expansion of offshore drilling, particularly in deepwater environments, is a significant driver, demanding specialized and durable Christmas tree systems. Furthermore, the oil and gas sector's embrace of automation and digitalization is spurring the adoption of smart Christmas trees with advanced monitoring and control features. The market is segmented by type (horizontal and vertical) and deployment location (onshore and offshore), with the offshore segment anticipated to lead growth due to complex deepwater exploration requirements. While fluctuating oil prices and environmental regulations present potential challenges, the fundamental need for reliable wellhead equipment ensures a positive market outlook.
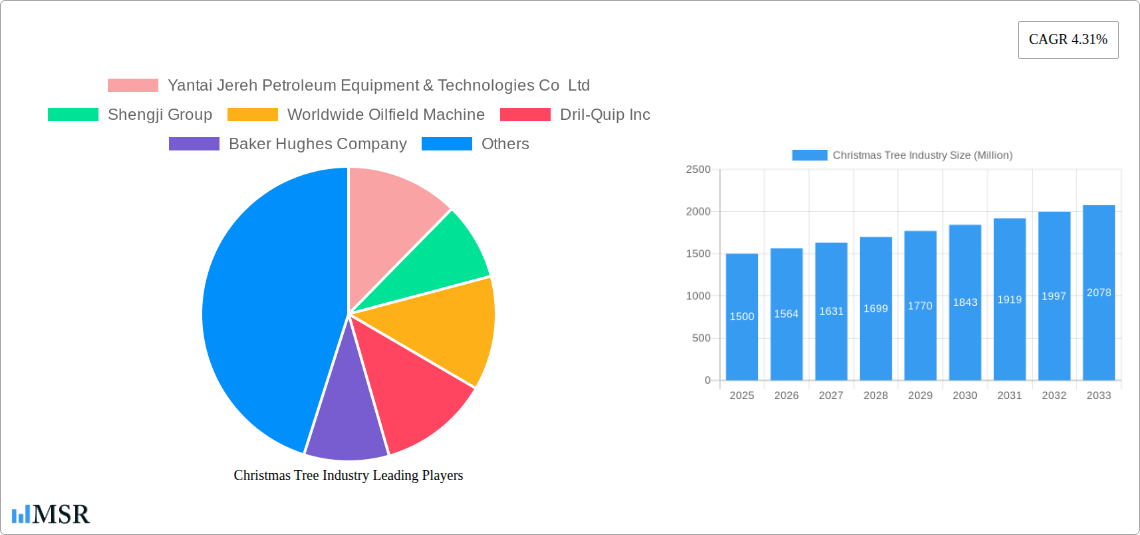
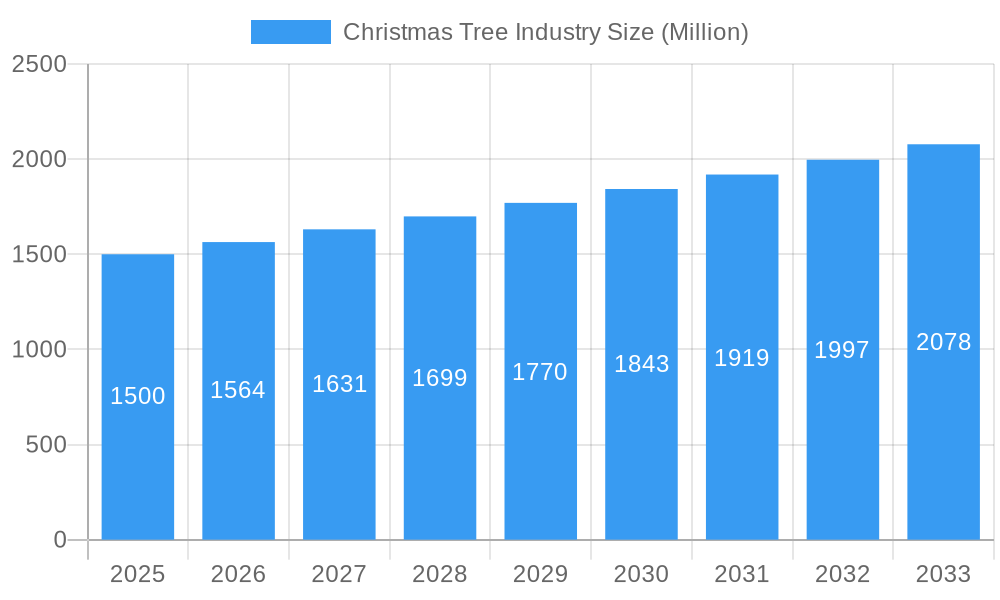
Christmas Tree Industry Market Size (In Billion)
Key market participants including Yantai Jereh, Shengji Group, Worldwide Oilfield Machine, Dril-Quip, Baker Hughes, Aker Solutions, INTERA, Schlumberger, and TechnipFMC are driving innovation through intensive research and development to enhance product offerings and expand market share. Intense competition fosters the development of highly specialized Christmas trees for diverse well conditions. Geographically, North America and the Middle East are expected to lead market dominance due to extensive oil and gas exploration, while Asia and Africa present emerging growth opportunities. The forecast period indicates sustained expansion, contingent on global energy demand and technological advancements.
Christmas Tree Industry Company Market Share
Christmas Tree Industry Market Report: 2019-2033 Forecast
This comprehensive report provides an in-depth analysis of the global Christmas Tree Industry market, projecting a robust growth trajectory driven by technological advancements and increasing offshore oil and gas exploration. Valued at $XX Million in 2025 (estimated), the market is poised to reach $XX Million by 2033, exhibiting a CAGR of XX% during the forecast period (2025-2033). This report covers the historical period (2019-2024), the base year (2025), and provides detailed forecasts through 2033. It's an essential resource for industry stakeholders, including major players like Yantai Jereh, Shengji Group, Worldwide Oilfield Machine, Dril-Quip Inc, Baker Hughes Company, Aker Solutions, INTERA Ltd, Schlumberger Limited, and TechnipFMC PLC, seeking strategic insights and investment opportunities in this dynamic market.
Christmas Tree Industry Market Concentration & Dynamics
The Christmas Tree Industry exhibits a moderately concentrated market structure, with a handful of major players holding significant market share. Market share data for 2025 suggests that the top five players collectively account for approximately XX% of the global revenue. The industry's innovation ecosystem is characterized by continuous R&D investments focused on subsea technology, automation, and enhanced well integrity. Stringent regulatory frameworks, particularly concerning safety and environmental compliance, shape industry practices. Substitute products are limited, primarily focusing on alternative wellhead technologies, but these remain niche applications. End-user trends reveal a growing demand for advanced subsea Christmas trees, driven by deepwater exploration and production activities. M&A activities within the sector are relatively frequent, indicating a trend towards consolidation and increased vertical integration.
- Market Concentration: Top 5 players hold approximately XX% market share in 2025.
- M&A Activity: XX major deals recorded between 2019-2024.
- Innovation: Focus on subsea technology, automation, and well integrity.
- Regulation: Stringent safety and environmental regulations impact operations.
Christmas Tree Industry Industry Insights & Trends
The global Christmas Tree Industry is experiencing significant growth, fueled by the increasing demand for oil and gas globally. Market size expanded from $XX Million in 2019 to an estimated $XX Million in 2025. This growth is primarily driven by escalating offshore exploration and production activities, particularly in deepwater regions. Technological advancements, including the development of advanced subsea Christmas trees capable of operating in extreme environments, further stimulate market expansion. Evolving consumer behaviors within the oil and gas industry push towards sustainable practices, necessitating the development of environmentally friendly and efficient Christmas tree systems. The industry faces technological disruptions, including the adoption of digitalization and automation to enhance efficiency and safety.
Key Markets & Segments Leading Christmas Tree Industry
The offshore segment dominates the Christmas Tree Industry, accounting for XX% of the overall market in 2025, driven by the growing focus on deepwater oil and gas exploration and production. The horizontal tree type holds a larger market share compared to vertical trees due to its suitability for directional drilling techniques. Geographically, the Asia-Pacific region, particularly China, is expected to be the leading market in the coming years.
Key Market Drivers:
- Offshore Segment: High growth in deepwater oil and gas exploration.
- Horizontal Trees: Preference for directional drilling techniques.
- Asia-Pacific Region: Strong economic growth and increasing energy demand.
- North America and Europe: Mature markets with ongoing investment in aging infrastructure.
Dominance Analysis: Offshore segment's dominance is attributed to the higher capital expenditure in deep-sea exploration and the relative complexity requiring specialized Christmas tree systems.
Christmas Tree Industry Product Developments
Recent product innovations focus on enhanced automation, improved reliability, and greater environmental consciousness. Subsea systems are becoming increasingly compact and remotely operated, minimizing human intervention in hazardous environments. These advancements provide competitive advantages through reduced operational costs, increased safety, and improved environmental performance.
Challenges in the Christmas Tree Industry Market
The Christmas Tree Industry faces challenges including the fluctuating price of oil and gas, stringent environmental regulations impacting operational costs, and supply chain disruptions impacting procurement. These factors can collectively reduce profitability and hinder market growth. Specifically, xx% of companies reported supply chain related delays in 2024.
Forces Driving Christmas Tree Industry Growth
Technological advancements in subsea technologies, rising demand for oil and gas, and government incentives for exploration and production are key drivers for the Christmas Tree Industry growth. This growth is particularly pronounced in regions with significant deepwater oil and gas reserves.
Challenges in the Christmas Tree Industry Market
Long-term growth hinges on continuous innovation in materials science, automation, and remote operation capabilities. Strategic partnerships and mergers will help companies to leverage expertise and market share. Expansion into new geographical markets with significant exploration potential and development of sustainable solutions are other drivers for sustained growth.
Emerging Opportunities in Christmas Tree Industry
Emerging opportunities lie in the development of smaller, more efficient subsea Christmas trees suitable for smaller scale oil and gas fields. Furthermore, increasing demand for environmentally friendly solutions will fuel innovation in biodegradable materials and energy-efficient designs.
Leading Players in the Christmas Tree Industry Sector
- Yantai Jereh Petroleum Equipment & Technologies Co Ltd
- Shengji Group
- Worldwide Oilfield Machine
- Dril-Quip Inc
- Baker Hughes Company
- Aker Solutions
- INTERA Ltd
- Schlumberger Limited
- TechnipFMC PLC
Key Milestones in Christmas Tree Industry Industry
July 2022: CNOOC launched its first self-developed subsea Christmas tree system, demonstrating technological advancements in China's offshore oil and gas sector. This system showcased a compact design with a daily trial output of 310,000 cubic meters, highlighting advancements in efficiency and resource optimization.
March 2022: Woodside's contract with DOF Subsea Australia for subsea Xmas tree retrieval highlighted the growing decommissioning market within the industry, indicating a significant focus on environmental responsibility. The project’s scale (18 subsea XTrees) indicates a sizeable segment requiring specialized services.
Strategic Outlook for Christmas Tree Industry Market
The future of the Christmas Tree Industry is bright, with significant growth potential driven by continuous technological advancements, increasing offshore exploration, and rising global energy demand. Companies focusing on innovation, sustainability, and strategic partnerships are best positioned to capitalize on these market opportunities.
Christmas Tree Industry Segmentation
-
1. Type
- 1.1. Horizontal Tree
- 1.2. Vertical Tree
-
2. Location of Deployment
- 2.1. Onshore
- 2.2. Offshore
Christmas Tree Industry Segmentation By Geography
- 1. North America
- 2. Europe
- 3. South America
- 4. Asia Pacific
- 5. Middle East and Africa
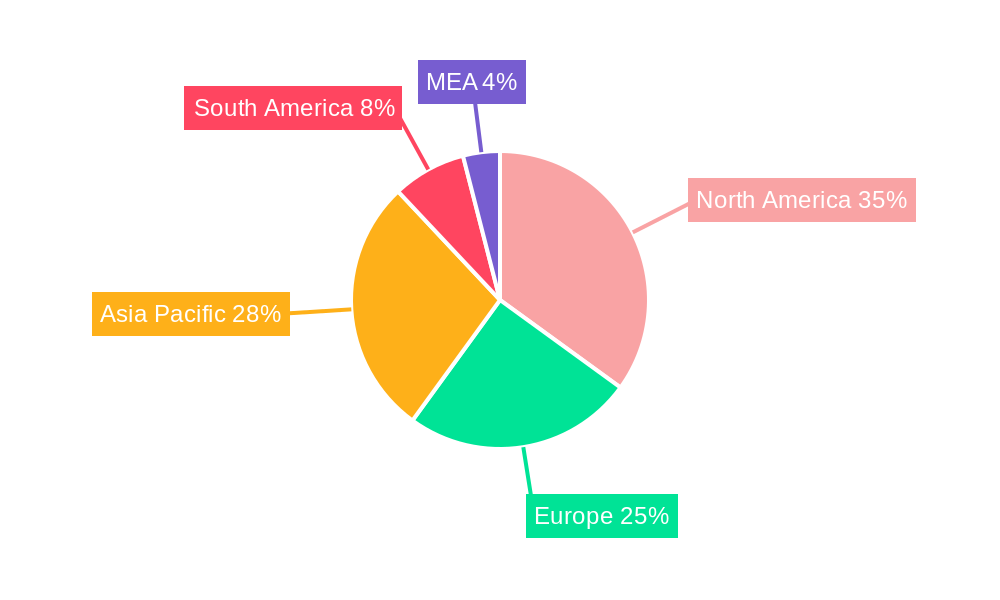
Christmas Tree Industry Regional Market Share
Geographic Coverage of Christmas Tree Industry
Christmas Tree Industry REPORT HIGHLIGHTS
| Aspects | Details |
|---|---|
| Study Period | 2020-2034 |
| Base Year | 2025 |
| Estimated Year | 2026 |
| Forecast Period | 2026-2034 |
| Historical Period | 2020-2025 |
| Growth Rate | CAGR of 4.63% from 2020-2034 |
| Segmentation |
|
Table of Contents
- 1. Introduction
- 1.1. Research Scope
- 1.2. Market Segmentation
- 1.3. Research Objective
- 1.4. Definitions and Assumptions
- 2. Executive Summary
- 2.1. Market Snapshot
- 3. Market Dynamics
- 3.1. Market Drivers
- 3.2. Market Restrains
- 3.3. Market Trends
- 3.4. Market Opportunities
- 4. Market Factor Analysis
- 4.1. Porters Five Forces
- 4.1.1. Bargaining Power of Suppliers
- 4.1.2. Bargaining Power of Buyers
- 4.1.3. Threat of New Entrants
- 4.1.4. Threat of Substitutes
- 4.1.5. Competitive Rivalry
- 4.2. PESTEL analysis
- 4.3. BCG Analysis
- 4.3.1. Stars (High Growth, High Market Share)
- 4.3.2. Cash Cows (Low Growth, High Market Share)
- 4.3.3. Question Mark (High Growth, Low Market Share)
- 4.3.4. Dogs (Low Growth, Low Market Share)
- 4.4. Ansoff Matrix Analysis
- 4.5. Supply Chain Analysis
- 4.6. Regulatory Landscape
- 4.7. Current Market Potential and Opportunity Assessment (TAM–SAM–SOM Framework)
- 4.8. MSR Analyst Note
- 4.1. Porters Five Forces
- 5. Market Analysis, Insights and Forecast 2021-2033
- 5.1. Market Analysis, Insights and Forecast - by Type
- 5.1.1. Horizontal Tree
- 5.1.2. Vertical Tree
- 5.2. Market Analysis, Insights and Forecast - by Location of Deployment
- 5.2.1. Onshore
- 5.2.2. Offshore
- 5.3. Market Analysis, Insights and Forecast - by Region
- 5.3.1. North America
- 5.3.2. Europe
- 5.3.3. South America
- 5.3.4. Asia Pacific
- 5.3.5. Middle East and Africa
- 5.1. Market Analysis, Insights and Forecast - by Type
- 6. Global Christmas Tree Industry Analysis, Insights and Forecast, 2021-2033
- 6.1. Market Analysis, Insights and Forecast - by Type
- 6.1.1. Horizontal Tree
- 6.1.2. Vertical Tree
- 6.2. Market Analysis, Insights and Forecast - by Location of Deployment
- 6.2.1. Onshore
- 6.2.2. Offshore
- 6.1. Market Analysis, Insights and Forecast - by Type
- 7. North America Christmas Tree Industry Analysis, Insights and Forecast, 2020-2032
- 7.1. Market Analysis, Insights and Forecast - by Type
- 7.1.1. Horizontal Tree
- 7.1.2. Vertical Tree
- 7.2. Market Analysis, Insights and Forecast - by Location of Deployment
- 7.2.1. Onshore
- 7.2.2. Offshore
- 7.1. Market Analysis, Insights and Forecast - by Type
- 8. Europe Christmas Tree Industry Analysis, Insights and Forecast, 2020-2032
- 8.1. Market Analysis, Insights and Forecast - by Type
- 8.1.1. Horizontal Tree
- 8.1.2. Vertical Tree
- 8.2. Market Analysis, Insights and Forecast - by Location of Deployment
- 8.2.1. Onshore
- 8.2.2. Offshore
- 8.1. Market Analysis, Insights and Forecast - by Type
- 9. South America Christmas Tree Industry Analysis, Insights and Forecast, 2020-2032
- 9.1. Market Analysis, Insights and Forecast - by Type
- 9.1.1. Horizontal Tree
- 9.1.2. Vertical Tree
- 9.2. Market Analysis, Insights and Forecast - by Location of Deployment
- 9.2.1. Onshore
- 9.2.2. Offshore
- 9.1. Market Analysis, Insights and Forecast - by Type
- 10. Asia Pacific Christmas Tree Industry Analysis, Insights and Forecast, 2020-2032
- 10.1. Market Analysis, Insights and Forecast - by Type
- 10.1.1. Horizontal Tree
- 10.1.2. Vertical Tree
- 10.2. Market Analysis, Insights and Forecast - by Location of Deployment
- 10.2.1. Onshore
- 10.2.2. Offshore
- 10.1. Market Analysis, Insights and Forecast - by Type
- 11. Middle East and Africa Christmas Tree Industry Analysis, Insights and Forecast, 2020-2032
- 11.1. Market Analysis, Insights and Forecast - by Type
- 11.1.1. Horizontal Tree
- 11.1.2. Vertical Tree
- 11.2. Market Analysis, Insights and Forecast - by Location of Deployment
- 11.2.1. Onshore
- 11.2.2. Offshore
- 11.1. Market Analysis, Insights and Forecast - by Type
- 12. Competitive Analysis
- 12.1. Company Profiles
- 12.1.1 Yantai Jereh Petroleum Equipment & Technologies Co Ltd
- 12.1.1.1. Company Overview
- 12.1.1.2. Products
- 12.1.1.3. Company Financials
- 12.1.1.4. SWOT Analysis
- 12.1.2 Shengji Group
- 12.1.2.1. Company Overview
- 12.1.2.2. Products
- 12.1.2.3. Company Financials
- 12.1.2.4. SWOT Analysis
- 12.1.3 Worldwide Oilfield Machine
- 12.1.3.1. Company Overview
- 12.1.3.2. Products
- 12.1.3.3. Company Financials
- 12.1.3.4. SWOT Analysis
- 12.1.4 Dril-Quip Inc
- 12.1.4.1. Company Overview
- 12.1.4.2. Products
- 12.1.4.3. Company Financials
- 12.1.4.4. SWOT Analysis
- 12.1.5 Baker Hughes Company
- 12.1.5.1. Company Overview
- 12.1.5.2. Products
- 12.1.5.3. Company Financials
- 12.1.5.4. SWOT Analysis
- 12.1.6 Aker Solutions
- 12.1.6.1. Company Overview
- 12.1.6.2. Products
- 12.1.6.3. Company Financials
- 12.1.6.4. SWOT Analysis
- 12.1.7 INTERA Ltd*List Not Exhaustive
- 12.1.7.1. Company Overview
- 12.1.7.2. Products
- 12.1.7.3. Company Financials
- 12.1.7.4. SWOT Analysis
- 12.1.8 Schlumberger Limited
- 12.1.8.1. Company Overview
- 12.1.8.2. Products
- 12.1.8.3. Company Financials
- 12.1.8.4. SWOT Analysis
- 12.1.9 TechnipFMC PLC
- 12.1.9.1. Company Overview
- 12.1.9.2. Products
- 12.1.9.3. Company Financials
- 12.1.9.4. SWOT Analysis
- 12.1.1 Yantai Jereh Petroleum Equipment & Technologies Co Ltd
- 12.2. Market Entropy
- 12.2.1 Company's Key Areas Served
- 12.2.2 Recent Developments
- 12.3. Company Market Share Analysis 2025
- 12.3.1 Top 5 Companies Market Share Analysis
- 12.3.2 Top 3 Companies Market Share Analysis
- 12.4. List of Potential Customers
- 13. Research Methodology
List of Figures
- Figure 1: Global Christmas Tree Industry Revenue Breakdown (billion, %) by Region 2025 & 2033
- Figure 2: Global Christmas Tree Industry Volume Breakdown (K Units, %) by Region 2025 & 2033
- Figure 3: North America Christmas Tree Industry Revenue (billion), by Type 2025 & 2033
- Figure 4: North America Christmas Tree Industry Volume (K Units), by Type 2025 & 2033
- Figure 5: North America Christmas Tree Industry Revenue Share (%), by Type 2025 & 2033
- Figure 6: North America Christmas Tree Industry Volume Share (%), by Type 2025 & 2033
- Figure 7: North America Christmas Tree Industry Revenue (billion), by Location of Deployment 2025 & 2033
- Figure 8: North America Christmas Tree Industry Volume (K Units), by Location of Deployment 2025 & 2033
- Figure 9: North America Christmas Tree Industry Revenue Share (%), by Location of Deployment 2025 & 2033
- Figure 10: North America Christmas Tree Industry Volume Share (%), by Location of Deployment 2025 & 2033
- Figure 11: North America Christmas Tree Industry Revenue (billion), by Country 2025 & 2033
- Figure 12: North America Christmas Tree Industry Volume (K Units), by Country 2025 & 2033
- Figure 13: North America Christmas Tree Industry Revenue Share (%), by Country 2025 & 2033
- Figure 14: North America Christmas Tree Industry Volume Share (%), by Country 2025 & 2033
- Figure 15: Europe Christmas Tree Industry Revenue (billion), by Type 2025 & 2033
- Figure 16: Europe Christmas Tree Industry Volume (K Units), by Type 2025 & 2033
- Figure 17: Europe Christmas Tree Industry Revenue Share (%), by Type 2025 & 2033
- Figure 18: Europe Christmas Tree Industry Volume Share (%), by Type 2025 & 2033
- Figure 19: Europe Christmas Tree Industry Revenue (billion), by Location of Deployment 2025 & 2033
- Figure 20: Europe Christmas Tree Industry Volume (K Units), by Location of Deployment 2025 & 2033
- Figure 21: Europe Christmas Tree Industry Revenue Share (%), by Location of Deployment 2025 & 2033
- Figure 22: Europe Christmas Tree Industry Volume Share (%), by Location of Deployment 2025 & 2033
- Figure 23: Europe Christmas Tree Industry Revenue (billion), by Country 2025 & 2033
- Figure 24: Europe Christmas Tree Industry Volume (K Units), by Country 2025 & 2033
- Figure 25: Europe Christmas Tree Industry Revenue Share (%), by Country 2025 & 2033
- Figure 26: Europe Christmas Tree Industry Volume Share (%), by Country 2025 & 2033
- Figure 27: South America Christmas Tree Industry Revenue (billion), by Type 2025 & 2033
- Figure 28: South America Christmas Tree Industry Volume (K Units), by Type 2025 & 2033
- Figure 29: South America Christmas Tree Industry Revenue Share (%), by Type 2025 & 2033
- Figure 30: South America Christmas Tree Industry Volume Share (%), by Type 2025 & 2033
- Figure 31: South America Christmas Tree Industry Revenue (billion), by Location of Deployment 2025 & 2033
- Figure 32: South America Christmas Tree Industry Volume (K Units), by Location of Deployment 2025 & 2033
- Figure 33: South America Christmas Tree Industry Revenue Share (%), by Location of Deployment 2025 & 2033
- Figure 34: South America Christmas Tree Industry Volume Share (%), by Location of Deployment 2025 & 2033
- Figure 35: South America Christmas Tree Industry Revenue (billion), by Country 2025 & 2033
- Figure 36: South America Christmas Tree Industry Volume (K Units), by Country 2025 & 2033
- Figure 37: South America Christmas Tree Industry Revenue Share (%), by Country 2025 & 2033
- Figure 38: South America Christmas Tree Industry Volume Share (%), by Country 2025 & 2033
- Figure 39: Asia Pacific Christmas Tree Industry Revenue (billion), by Type 2025 & 2033
- Figure 40: Asia Pacific Christmas Tree Industry Volume (K Units), by Type 2025 & 2033
- Figure 41: Asia Pacific Christmas Tree Industry Revenue Share (%), by Type 2025 & 2033
- Figure 42: Asia Pacific Christmas Tree Industry Volume Share (%), by Type 2025 & 2033
- Figure 43: Asia Pacific Christmas Tree Industry Revenue (billion), by Location of Deployment 2025 & 2033
- Figure 44: Asia Pacific Christmas Tree Industry Volume (K Units), by Location of Deployment 2025 & 2033
- Figure 45: Asia Pacific Christmas Tree Industry Revenue Share (%), by Location of Deployment 2025 & 2033
- Figure 46: Asia Pacific Christmas Tree Industry Volume Share (%), by Location of Deployment 2025 & 2033
- Figure 47: Asia Pacific Christmas Tree Industry Revenue (billion), by Country 2025 & 2033
- Figure 48: Asia Pacific Christmas Tree Industry Volume (K Units), by Country 2025 & 2033
- Figure 49: Asia Pacific Christmas Tree Industry Revenue Share (%), by Country 2025 & 2033
- Figure 50: Asia Pacific Christmas Tree Industry Volume Share (%), by Country 2025 & 2033
- Figure 51: Middle East and Africa Christmas Tree Industry Revenue (billion), by Type 2025 & 2033
- Figure 52: Middle East and Africa Christmas Tree Industry Volume (K Units), by Type 2025 & 2033
- Figure 53: Middle East and Africa Christmas Tree Industry Revenue Share (%), by Type 2025 & 2033
- Figure 54: Middle East and Africa Christmas Tree Industry Volume Share (%), by Type 2025 & 2033
- Figure 55: Middle East and Africa Christmas Tree Industry Revenue (billion), by Location of Deployment 2025 & 2033
- Figure 56: Middle East and Africa Christmas Tree Industry Volume (K Units), by Location of Deployment 2025 & 2033
- Figure 57: Middle East and Africa Christmas Tree Industry Revenue Share (%), by Location of Deployment 2025 & 2033
- Figure 58: Middle East and Africa Christmas Tree Industry Volume Share (%), by Location of Deployment 2025 & 2033
- Figure 59: Middle East and Africa Christmas Tree Industry Revenue (billion), by Country 2025 & 2033
- Figure 60: Middle East and Africa Christmas Tree Industry Volume (K Units), by Country 2025 & 2033
- Figure 61: Middle East and Africa Christmas Tree Industry Revenue Share (%), by Country 2025 & 2033
- Figure 62: Middle East and Africa Christmas Tree Industry Volume Share (%), by Country 2025 & 2033
List of Tables
- Table 1: Global Christmas Tree Industry Revenue billion Forecast, by Type 2020 & 2033
- Table 2: Global Christmas Tree Industry Volume K Units Forecast, by Type 2020 & 2033
- Table 3: Global Christmas Tree Industry Revenue billion Forecast, by Location of Deployment 2020 & 2033
- Table 4: Global Christmas Tree Industry Volume K Units Forecast, by Location of Deployment 2020 & 2033
- Table 5: Global Christmas Tree Industry Revenue billion Forecast, by Region 2020 & 2033
- Table 6: Global Christmas Tree Industry Volume K Units Forecast, by Region 2020 & 2033
- Table 7: Global Christmas Tree Industry Revenue billion Forecast, by Type 2020 & 2033
- Table 8: Global Christmas Tree Industry Volume K Units Forecast, by Type 2020 & 2033
- Table 9: Global Christmas Tree Industry Revenue billion Forecast, by Location of Deployment 2020 & 2033
- Table 10: Global Christmas Tree Industry Volume K Units Forecast, by Location of Deployment 2020 & 2033
- Table 11: Global Christmas Tree Industry Revenue billion Forecast, by Country 2020 & 2033
- Table 12: Global Christmas Tree Industry Volume K Units Forecast, by Country 2020 & 2033
- Table 13: Global Christmas Tree Industry Revenue billion Forecast, by Type 2020 & 2033
- Table 14: Global Christmas Tree Industry Volume K Units Forecast, by Type 2020 & 2033
- Table 15: Global Christmas Tree Industry Revenue billion Forecast, by Location of Deployment 2020 & 2033
- Table 16: Global Christmas Tree Industry Volume K Units Forecast, by Location of Deployment 2020 & 2033
- Table 17: Global Christmas Tree Industry Revenue billion Forecast, by Country 2020 & 2033
- Table 18: Global Christmas Tree Industry Volume K Units Forecast, by Country 2020 & 2033
- Table 19: Global Christmas Tree Industry Revenue billion Forecast, by Type 2020 & 2033
- Table 20: Global Christmas Tree Industry Volume K Units Forecast, by Type 2020 & 2033
- Table 21: Global Christmas Tree Industry Revenue billion Forecast, by Location of Deployment 2020 & 2033
- Table 22: Global Christmas Tree Industry Volume K Units Forecast, by Location of Deployment 2020 & 2033
- Table 23: Global Christmas Tree Industry Revenue billion Forecast, by Country 2020 & 2033
- Table 24: Global Christmas Tree Industry Volume K Units Forecast, by Country 2020 & 2033
- Table 25: Global Christmas Tree Industry Revenue billion Forecast, by Type 2020 & 2033
- Table 26: Global Christmas Tree Industry Volume K Units Forecast, by Type 2020 & 2033
- Table 27: Global Christmas Tree Industry Revenue billion Forecast, by Location of Deployment 2020 & 2033
- Table 28: Global Christmas Tree Industry Volume K Units Forecast, by Location of Deployment 2020 & 2033
- Table 29: Global Christmas Tree Industry Revenue billion Forecast, by Country 2020 & 2033
- Table 30: Global Christmas Tree Industry Volume K Units Forecast, by Country 2020 & 2033
- Table 31: Global Christmas Tree Industry Revenue billion Forecast, by Type 2020 & 2033
- Table 32: Global Christmas Tree Industry Volume K Units Forecast, by Type 2020 & 2033
- Table 33: Global Christmas Tree Industry Revenue billion Forecast, by Location of Deployment 2020 & 2033
- Table 34: Global Christmas Tree Industry Volume K Units Forecast, by Location of Deployment 2020 & 2033
- Table 35: Global Christmas Tree Industry Revenue billion Forecast, by Country 2020 & 2033
- Table 36: Global Christmas Tree Industry Volume K Units Forecast, by Country 2020 & 2033
Frequently Asked Questions
1. What is the projected Compound Annual Growth Rate (CAGR) of the Christmas Tree Industry?
The projected CAGR is approximately 4.63%.
2. Which companies are prominent players in the Christmas Tree Industry?
Key companies in the market include Yantai Jereh Petroleum Equipment & Technologies Co Ltd, Shengji Group, Worldwide Oilfield Machine, Dril-Quip Inc, Baker Hughes Company, Aker Solutions, INTERA Ltd*List Not Exhaustive, Schlumberger Limited, TechnipFMC PLC.
3. What are the main segments of the Christmas Tree Industry?
The market segments include Type, Location of Deployment.
4. Can you provide details about the market size?
The market size is estimated to be USD 1.27 billion as of 2022.
5. What are some drivers contributing to market growth?
4.; Increasing Investments in Offshore Wind Power Projects4.; Supportive Government Policies.
6. What are the notable trends driving market growth?
The Onshore Sector is Expected to Dominate the Market.
7. Are there any restraints impacting market growth?
4.; Increasing Adopting of Alternative Clean Energy Sources (Ex: Solar. Hydro).
8. Can you provide examples of recent developments in the market?
July 2022: China National Offshore Oil Corporation (CNOOC) launched its first self-developed subsea Christmas tree (Xmas) system in the Bohai Sea. The subsea Xmas oil and gas extraction system was installed in the Jinzhou 31-1 gas field in the Bohai Sea with a daily trial output of 310,000 cubic meters, able to meet the gas usage needs of 1,500 households for an entire year. The system was designed in a compact structure, weighing 24.8 tons. It is suitable for use in shallow water and has an expected operating life of 15 years.
9. What pricing options are available for accessing the report?
Pricing options include single-user, multi-user, and enterprise licenses priced at USD 4750, USD 5250, and USD 8750 respectively.
10. Is the market size provided in terms of value or volume?
The market size is provided in terms of value, measured in billion and volume, measured in K Units.
11. Are there any specific market keywords associated with the report?
Yes, the market keyword associated with the report is "Christmas Tree Industry," which aids in identifying and referencing the specific market segment covered.
12. How do I determine which pricing option suits my needs best?
The pricing options vary based on user requirements and access needs. Individual users may opt for single-user licenses, while businesses requiring broader access may choose multi-user or enterprise licenses for cost-effective access to the report.
13. Are there any additional resources or data provided in the Christmas Tree Industry report?
While the report offers comprehensive insights, it's advisable to review the specific contents or supplementary materials provided to ascertain if additional resources or data are available.
14. How can I stay updated on further developments or reports in the Christmas Tree Industry?
To stay informed about further developments, trends, and reports in the Christmas Tree Industry, consider subscribing to industry newsletters, following relevant companies and organizations, or regularly checking reputable industry news sources and publications.
Methodology
Step 1 - Identification of Relevant Samples Size from Population Database


Step 2 - Approaches for Defining Global Market Size (Value, Volume* & Price*)

Note*: In applicable scenarios
Step 3 - Data Sources
Primary Research
- Web Analytics
- Survey Reports
- Research Institute
- Latest Research Reports
- Opinion Leaders
Secondary Research
- Annual Reports
- White Paper
- Latest Press Release
- Industry Association
- Paid Database
- Investor Presentations

Step 4 - Data Triangulation
Involves using different sources of information in order to increase the validity of a study
These sources are likely to be stakeholders in a program - participants, other researchers, program staff, other community members, and so on.
Then we put all data in single framework & apply various statistical tools to find out the dynamic on the market.
During the analysis stage, feedback from the stakeholder groups would be compared to determine areas of agreement as well as areas of divergence