

Key Insights
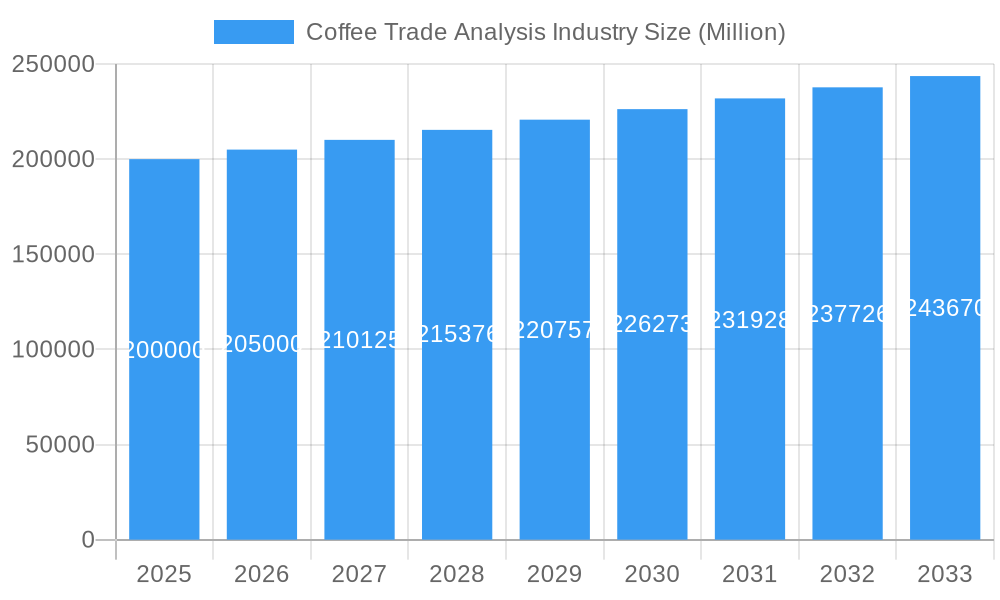
The global coffee trade, a multi-billion dollar industry, is experiencing steady growth, projected at a 2.5% CAGR from 2025 to 2033. This growth is fueled by several key factors. Rising disposable incomes in developing economies are driving increased coffee consumption, particularly in Asia-Pacific and South America. The increasing popularity of specialty coffee, including single-origin beans and unique brewing methods, caters to evolving consumer preferences and commands premium prices. Furthermore, the convenience offered by instant and soluble coffee continues to fuel market expansion, especially among younger demographics. However, challenges remain. Fluctuations in coffee bean prices due to weather patterns and geopolitical instability pose a significant risk. Sustainability concerns, including ethical sourcing and environmental impact, are gaining traction, prompting businesses to adopt more responsible practices. The market is segmented by bean type (Arabica and Robusta), processing method (washed, natural, honey), and end-use (roasted, instant, soluble, green). Major players, such as JDE Peet's, Starbucks, Nestlé, and Keurig Dr Pepper, are strategically investing in product innovation, brand expansion, and supply chain optimization to maintain their market share in this competitive landscape. Regional differences are significant, with North America and Europe maintaining substantial market shares, while Asia-Pacific shows the most robust growth potential.
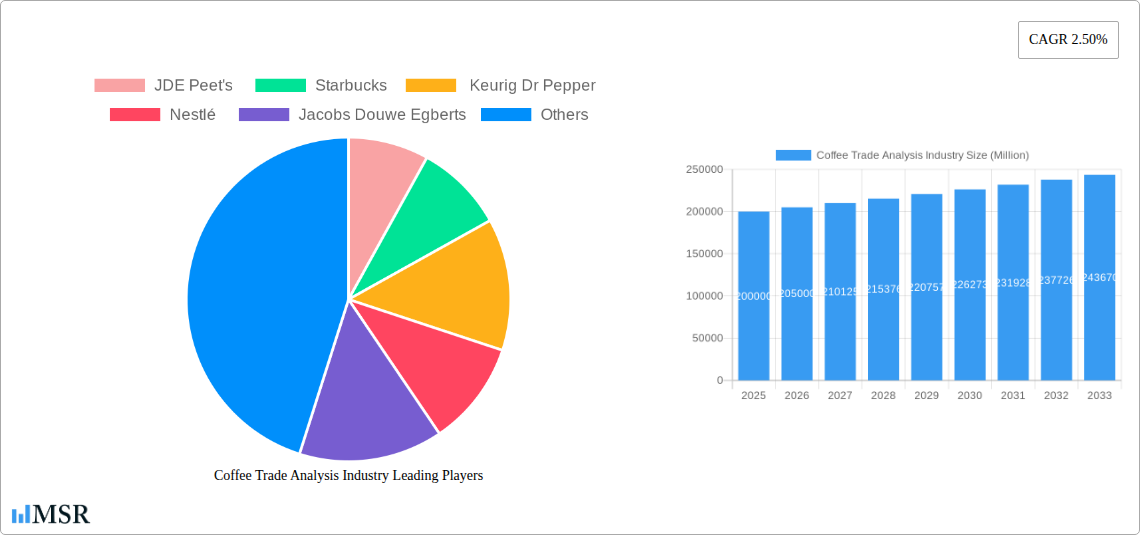
Coffee Trade Analysis Industry Market Size (In Billion)
The competitive landscape is dynamic, with both established players and emerging brands vying for market share. Innovation plays a pivotal role, with companies constantly introducing new coffee blends, flavors, and brewing technologies to attract consumers. The increasing demand for organic and fair-trade coffee signifies a shift towards ethical consumption patterns. The growth of the online coffee retail market offers new opportunities for direct-to-consumer brands, further intensifying competition. The forecast period (2025-2033) anticipates continued expansion, driven by factors such as rising global population, urbanization, and the ongoing trend towards premiumization within the coffee industry. However, careful management of supply chain vulnerabilities and adaptation to changing consumer preferences will be crucial for success. Companies need to leverage sustainable practices and innovative marketing strategies to navigate the evolving market dynamics effectively.
Coffee Trade Analysis Industry Company Market Share
Dive Deep into the Thriving Coffee Trade Analysis Industry: A Comprehensive Market Report (2019-2033)
This in-depth report provides a comprehensive analysis of the global coffee trade industry, encompassing market dynamics, key segments, leading players, and future growth prospects. Covering the period from 2019 to 2033, with a base year of 2025, this study offers invaluable insights for industry stakeholders, investors, and strategic decision-makers. The report leverages rigorous data analysis to forecast market trends and identify lucrative opportunities within this dynamic sector. Expect detailed breakdowns of market segments including Arabica and Robusta coffee beans, various processing methods (Washed, Natural, Honey), and end-uses (Roasted, Instant, Soluble, Green Coffee). Leading players like JDE Peet's, Starbucks, Keurig Dr Pepper, Nestlé, and Jacobs Douwe Egberts are thoroughly analyzed. The report value is xx Million.
Coffee Trade Analysis Industry Market Concentration & Dynamics
The global coffee trade industry exhibits a moderately concentrated market structure, dominated by a handful of multinational corporations. These giants, including JDE Peet's, Nestlé, and Starbucks, control a significant portion of the market share, estimated at approximately xx%. However, the presence of numerous smaller, regional players fosters competition and innovation.
Market dynamics are influenced by several factors:
- Innovation Ecosystems: Continuous innovation in coffee processing, roasting techniques, and product formulations drives growth. The development of sustainable and ethically sourced coffee is a key trend.
- Regulatory Frameworks: Government regulations concerning trade, sustainability, and food safety significantly impact market operations. Tariffs and trade agreements play a crucial role.
- Substitute Products: The rise of tea, herbal infusions, and other beverages presents a competitive threat, influencing consumer choice and market share.
- End-User Trends: Increasing consumer demand for specialty coffees, single-origin beans, and convenient formats like instant coffee fuels market growth. Health consciousness also plays a role, with demand for low-sugar and organic options.
- M&A Activities: Mergers and acquisitions are common, with larger players consolidating their market share and expanding their product portfolios. The number of M&A deals in the past five years is estimated at xx.
Coffee Trade Analysis Industry Industry Insights & Trends
The global coffee trade industry is experiencing robust and dynamic growth, propelled by a confluence of significant factors. The market size is estimated to reach [Insert Estimated Market Size in 2025] Million USD in 2025, with an impressive Compound Annual Growth Rate (CAGR) of [Insert CAGR]% projected during the forecast period of 2025-2033. This upward trajectory is primarily fueled by:
- Escalating Disposable Incomes: A substantial increase in purchasing power, particularly within developing economies, is a major catalyst. This enhanced financial capacity is driving greater demand for coffee, a universally cherished beverage that appeals to a broad spectrum of consumers across various age groups and socioeconomic backgrounds.
- Evolving Consumer Palates and Preferences: There's a discernible shift towards more sophisticated consumer tastes. A growing appreciation for high-quality, single-origin, and specialty coffees is leading to a significant premiumization trend within the market, with consumers willing to invest more in exceptional coffee experiences.
- Pioneering Technological Advancements: Innovations are revolutionizing every stage of the coffee value chain. From precision agriculture and advanced automation in farming to sophisticated processing techniques and advanced packaging solutions, these advancements are collectively enhancing coffee quality, operational efficiency, and critically, the sustainability of coffee production.
- Transforming Distribution Channels: The rise of e-commerce platforms and the proliferation of direct-to-consumer (DTC) models are fundamentally reshaping how coffee reaches consumers. These channels are not only broadening market access for businesses but also offering unprecedented convenience and a wider selection for coffee enthusiasts globally.
Key Markets & Segments Leading Coffee Trade Analysis Industry
Within the coffee trade landscape, the Arabica coffee bean segment continues to command the largest market share. This dominance is directly attributable to its intrinsically superior and complex flavor profiles, coupled with its widespread global appeal. Concurrently, Robusta coffee maintains a substantial and important market presence, valued for its bold, strong taste and its more accessible price point, making it a staple in many markets. When examining processing methods, Washed coffee leads significantly due to its characteristic clean, crisp, and balanced flavor attributes that are widely appreciated. Following closely are Natural and Honey processed coffees, which are increasingly sought after by connoisseurs and roasters looking to explore distinct and nuanced flavor nuances. In terms of end-use consumption, roasted coffee remains the dominant form. However, the convenience factor is driving significant growth for Instant and Soluble coffee products, making them increasingly popular choices for daily consumption.
-
Key Drivers for Arabica Coffee's Dominance:
- Superior Sensory Experience: Consistently exhibits a more refined and aromatic taste profile compared to Robusta.
- Broad Market Appeal: High and sustained consumer demand across both established and rapidly developing global markets.
- Established Infrastructure: Mature and extensive distribution networks facilitate widespread availability and accessibility.
-
Key Drivers for Washed Coffee's Dominance:
- Clean and Balanced Flavor: Produces a predictable and widely accepted clean, bright, and well-balanced cup.
- Global Acceptance: A universally recognized and favored processing method across diverse international coffee cultures.
- Versatility in Brewing: Well-suited to a vast array of brewing methods, from espresso to pour-over.
The leading geographical region for coffee trade is [Insert Dominant Region], closely followed by [Insert Second Leading Region] and [Insert Third Leading Region]. These regions benefit from a potent combination of factors, including robust economic growth, highly developed logistical and trade infrastructure, and consistently high per capita coffee consumption rates.
Coffee Trade Analysis Industry Product Developments
Recent product innovations focus on sustainability, convenience, and premiumization. This includes single-serve coffee pods, ready-to-drink coffee beverages, and functional coffees infused with health-promoting ingredients. Technological advancements like improved roasting techniques and automated processing enhance efficiency and product quality. Companies are increasingly focusing on ethically sourced and sustainably produced coffee to appeal to environmentally conscious consumers.
Challenges in the Coffee Trade Analysis Industry Market
The coffee industry faces several challenges:
- Volatile Coffee Bean Prices: Fluctuations in commodity prices impact profitability and market stability.
- Supply Chain Disruptions: Global events like pandemics and geopolitical instability can disrupt supply chains and affect product availability.
- Competition: Intense competition among large players and emerging brands exerts pressure on pricing and market share.
- Sustainability Concerns: Growing concerns about deforestation, water usage, and labor practices pressure the industry to adopt more sustainable practices.
Forces Driving Coffee Trade Analysis Industry Growth
Key growth drivers include:
- Technological advancements in sustainable farming and processing techniques.
- Rising disposable incomes and increasing demand for premium coffee.
- Growing popularity of ready-to-drink and single-serve coffee options.
- Expansion of e-commerce channels and direct-to-consumer models.
Challenges in the Coffee Trade Analysis Industry Market
Long-term growth relies on addressing challenges like climate change impacts on coffee production, securing sustainable supply chains, and navigating fluctuating commodity prices. Innovation in processing and brewing technologies, strategic partnerships, and market expansion into emerging economies remain crucial growth catalysts.
Emerging Opportunities in Coffee Trade Analysis Industry
The coffee trade industry is ripe with emerging opportunities for innovation and growth, including:
- Conscious Consumerism: A rapidly growing demand for ethically sourced coffee, specifically organic, fair-trade certified, and sustainably produced varieties. Consumers are increasingly aligning their purchasing decisions with their values.
- Market Expansion: Significant potential exists in tapping into emerging markets where coffee consumption is on a steady rise, driven by changing lifestyles and increasing disposable incomes.
- Product Innovation: The development and introduction of novel coffee products, such as functional coffee beverages fortified with vitamins, nootropics, or other health-promoting ingredients, cater to evolving wellness trends.
- Technological Integration: Harnessing cutting-edge technologies to enhance the entire coffee supply chain, focusing on improved efficiency, complete traceability from farm to cup, and robust sustainability practices.
Leading Players in the Coffee Trade Analysis Industry Sector
- JDE Peet's
- Starbucks
- Keurig Dr Pepper
- Nestlé
- Jacobs Douwe Egberts
Key Milestones in Coffee Trade Analysis Industry Industry
- October 2022: Nestlé announced a substantial commitment of over USD 1 billion dedicated to a comprehensive sustainable coffee farming plan, significantly bolstering global sustainability initiatives within the industry.
- December 2022: The United States Government launched the Indonesia Coffee Enterprise Resilience Initiative, a pivotal program aimed at providing crucial support and enhancing the resilience of Indonesian coffee farmers.
- January 2023: India reported a notable increase in coffee exports, rising by nearly 2% to 400,000 tons in 2022. Notably, exports of instant coffee experienced a remarkable surge of 16.73%.
Strategic Outlook for Coffee Trade Analysis Industry Market
The future outlook for the coffee trade industry is exceptionally bright, characterized by substantial growth potential. This optimistic forecast is underpinned by the continuous evolution of consumer preferences, the transformative impact of technological advancements, and a steadily increasing global appetite for coffee. Companies that proactively prioritize sustainability, foster a culture of innovation, and diligently focus on optimizing supply chain management will be strategically positioned to not only capitalize on the burgeoning opportunities but also to achieve enduring success in this vibrant and ever-evolving market.
Coffee Trade Analysis Industry Segmentation
- 1. Production Analysis
- 2. Consumption Analysis
- 3. Import Market Analysis (Value & Volume)
- 4. Export Market Analysis (Value & Volume)
- 5. Price Trend Analysis
Coffee Trade Analysis Industry Segmentation By Geography
-
1. North America
- 1.1. United States
- 1.2. Canada
- 1.3. Mexico
-
2. Europe
- 2.1. United Kingdom
- 2.2. Denmark
- 2.3. Netherlands
- 2.4. Germany
- 2.5. Norway
- 2.6. Sweden
-
3. Asia Pacific
- 3.1. China
- 3.2. India
- 3.3. Japan
- 3.4. Indonesia
- 3.5. Philippines
-
4. South America
- 4.1. Brazil
- 4.2. Argentina
-
5. Africa
- 5.1. South Africa
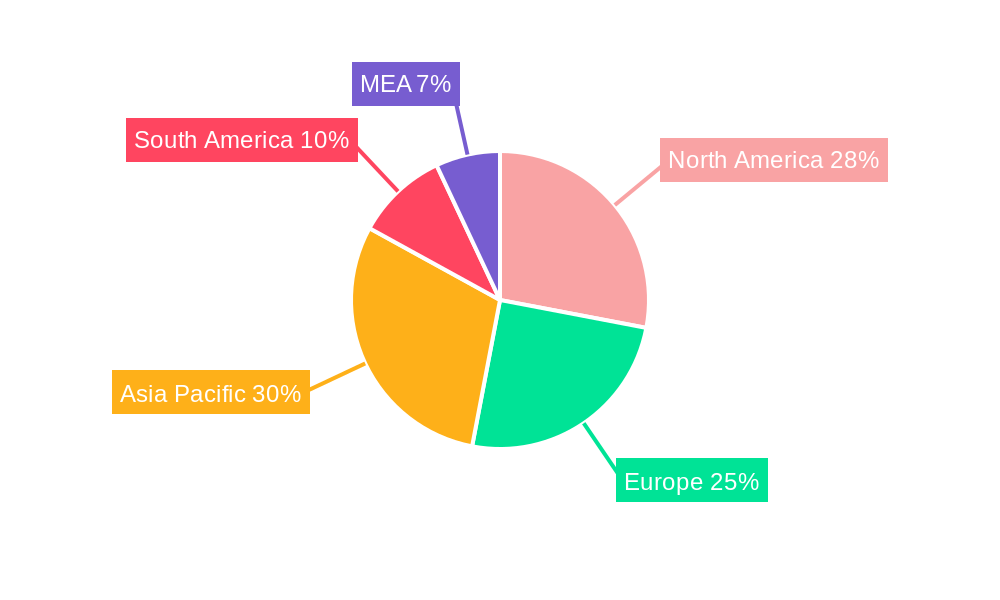
Coffee Trade Analysis Industry Regional Market Share
Geographic Coverage of Coffee Trade Analysis Industry
Coffee Trade Analysis Industry REPORT HIGHLIGHTS
| Aspects | Details |
|---|---|
| Study Period | 2020-2034 |
| Base Year | 2025 |
| Estimated Year | 2026 |
| Forecast Period | 2026-2034 |
| Historical Period | 2020-2025 |
| Growth Rate | CAGR of 2.50% from 2020-2034 |
| Segmentation |
|
Table of Contents
- 1. Introduction
- 1.1. Research Scope
- 1.2. Market Segmentation
- 1.3. Research Objective
- 1.4. Definitions and Assumptions
- 2. Executive Summary
- 2.1. Market Snapshot
- 3. Market Dynamics
- 3.1. Market Drivers
- 3.2. Market Restrains
- 3.3. Market Trends
- 3.4. Market Opportunities
- 4. Market Factor Analysis
- 4.1. Porters Five Forces
- 4.1.1. Bargaining Power of Suppliers
- 4.1.2. Bargaining Power of Buyers
- 4.1.3. Threat of New Entrants
- 4.1.4. Threat of Substitutes
- 4.1.5. Competitive Rivalry
- 4.2. PESTEL analysis
- 4.3. BCG Analysis
- 4.3.1. Stars (High Growth, High Market Share)
- 4.3.2. Cash Cows (Low Growth, High Market Share)
- 4.3.3. Question Mark (High Growth, Low Market Share)
- 4.3.4. Dogs (Low Growth, Low Market Share)
- 4.4. Ansoff Matrix Analysis
- 4.5. Supply Chain Analysis
- 4.6. Regulatory Landscape
- 4.7. Current Market Potential and Opportunity Assessment (TAM–SAM–SOM Framework)
- 4.8. MSR Analyst Note
- 4.1. Porters Five Forces
- 5. Market Analysis, Insights and Forecast 2021-2033
- 5.1. Market Analysis, Insights and Forecast - by Production Analysis
- 5.2. Market Analysis, Insights and Forecast - by Consumption Analysis
- 5.3. Market Analysis, Insights and Forecast - by Import Market Analysis (Value & Volume)
- 5.4. Market Analysis, Insights and Forecast - by Export Market Analysis (Value & Volume)
- 5.5. Market Analysis, Insights and Forecast - by Price Trend Analysis
- 5.6. Market Analysis, Insights and Forecast - by Region
- 5.6.1. North America
- 5.6.2. Europe
- 5.6.3. Asia Pacific
- 5.6.4. South America
- 5.6.5. Africa
- 6. Global Coffee Trade Analysis Industry Analysis, Insights and Forecast, 2021-2033
- 6.1. Market Analysis, Insights and Forecast - by Production Analysis
- 6.2. Market Analysis, Insights and Forecast - by Consumption Analysis
- 6.3. Market Analysis, Insights and Forecast - by Import Market Analysis (Value & Volume)
- 6.4. Market Analysis, Insights and Forecast - by Export Market Analysis (Value & Volume)
- 6.5. Market Analysis, Insights and Forecast - by Price Trend Analysis
- 7. North America Coffee Trade Analysis Industry Analysis, Insights and Forecast, 2020-2032
- 7.1. Market Analysis, Insights and Forecast - by Production Analysis
- 7.2. Market Analysis, Insights and Forecast - by Consumption Analysis
- 7.3. Market Analysis, Insights and Forecast - by Import Market Analysis (Value & Volume)
- 7.4. Market Analysis, Insights and Forecast - by Export Market Analysis (Value & Volume)
- 7.5. Market Analysis, Insights and Forecast - by Price Trend Analysis
- 8. Europe Coffee Trade Analysis Industry Analysis, Insights and Forecast, 2020-2032
- 8.1. Market Analysis, Insights and Forecast - by Production Analysis
- 8.2. Market Analysis, Insights and Forecast - by Consumption Analysis
- 8.3. Market Analysis, Insights and Forecast - by Import Market Analysis (Value & Volume)
- 8.4. Market Analysis, Insights and Forecast - by Export Market Analysis (Value & Volume)
- 8.5. Market Analysis, Insights and Forecast - by Price Trend Analysis
- 9. Asia Pacific Coffee Trade Analysis Industry Analysis, Insights and Forecast, 2020-2032
- 9.1. Market Analysis, Insights and Forecast - by Production Analysis
- 9.2. Market Analysis, Insights and Forecast - by Consumption Analysis
- 9.3. Market Analysis, Insights and Forecast - by Import Market Analysis (Value & Volume)
- 9.4. Market Analysis, Insights and Forecast - by Export Market Analysis (Value & Volume)
- 9.5. Market Analysis, Insights and Forecast - by Price Trend Analysis
- 10. South America Coffee Trade Analysis Industry Analysis, Insights and Forecast, 2020-2032
- 10.1. Market Analysis, Insights and Forecast - by Production Analysis
- 10.2. Market Analysis, Insights and Forecast - by Consumption Analysis
- 10.3. Market Analysis, Insights and Forecast - by Import Market Analysis (Value & Volume)
- 10.4. Market Analysis, Insights and Forecast - by Export Market Analysis (Value & Volume)
- 10.5. Market Analysis, Insights and Forecast - by Price Trend Analysis
- 11. Africa Coffee Trade Analysis Industry Analysis, Insights and Forecast, 2020-2032
- 11.1. Market Analysis, Insights and Forecast - by Production Analysis
- 11.2. Market Analysis, Insights and Forecast - by Consumption Analysis
- 11.3. Market Analysis, Insights and Forecast - by Import Market Analysis (Value & Volume)
- 11.4. Market Analysis, Insights and Forecast - by Export Market Analysis (Value & Volume)
- 11.5. Market Analysis, Insights and Forecast - by Price Trend Analysis
- 12. Competitive Analysis
- 12.1. Company Profiles
- 12.1.1 JDE Peet's
- 12.1.1.1. Company Overview
- 12.1.1.2. Products
- 12.1.1.3. Company Financials
- 12.1.1.4. SWOT Analysis
- 12.1.2 Starbucks
- 12.1.2.1. Company Overview
- 12.1.2.2. Products
- 12.1.2.3. Company Financials
- 12.1.2.4. SWOT Analysis
- 12.1.3 Keurig Dr Pepper
- 12.1.3.1. Company Overview
- 12.1.3.2. Products
- 12.1.3.3. Company Financials
- 12.1.3.4. SWOT Analysis
- 12.1.4 Nestlé
- 12.1.4.1. Company Overview
- 12.1.4.2. Products
- 12.1.4.3. Company Financials
- 12.1.4.4. SWOT Analysis
- 12.1.5 Jacobs Douwe Egberts
- 12.1.5.1. Company Overview
- 12.1.5.2. Products
- 12.1.5.3. Company Financials
- 12.1.5.4. SWOT Analysis
- 12.1.1 JDE Peet's
- 12.2. Market Entropy
- 12.2.1 Company's Key Areas Served
- 12.2.2 Recent Developments
- 12.3. Company Market Share Analysis 2025
- 12.3.1 Top 5 Companies Market Share Analysis
- 12.3.2 Top 3 Companies Market Share Analysis
- 12.4. List of Potential Customers
- 13. Research Methodology
List of Figures
- Figure 1: Global Coffee Trade Analysis Industry Revenue Breakdown (Million, %) by Region 2025 & 2033
- Figure 2: North America Coffee Trade Analysis Industry Revenue (Million), by Production Analysis 2025 & 2033
- Figure 3: North America Coffee Trade Analysis Industry Revenue Share (%), by Production Analysis 2025 & 2033
- Figure 4: North America Coffee Trade Analysis Industry Revenue (Million), by Consumption Analysis 2025 & 2033
- Figure 5: North America Coffee Trade Analysis Industry Revenue Share (%), by Consumption Analysis 2025 & 2033
- Figure 6: North America Coffee Trade Analysis Industry Revenue (Million), by Import Market Analysis (Value & Volume) 2025 & 2033
- Figure 7: North America Coffee Trade Analysis Industry Revenue Share (%), by Import Market Analysis (Value & Volume) 2025 & 2033
- Figure 8: North America Coffee Trade Analysis Industry Revenue (Million), by Export Market Analysis (Value & Volume) 2025 & 2033
- Figure 9: North America Coffee Trade Analysis Industry Revenue Share (%), by Export Market Analysis (Value & Volume) 2025 & 2033
- Figure 10: North America Coffee Trade Analysis Industry Revenue (Million), by Price Trend Analysis 2025 & 2033
- Figure 11: North America Coffee Trade Analysis Industry Revenue Share (%), by Price Trend Analysis 2025 & 2033
- Figure 12: North America Coffee Trade Analysis Industry Revenue (Million), by Country 2025 & 2033
- Figure 13: North America Coffee Trade Analysis Industry Revenue Share (%), by Country 2025 & 2033
- Figure 14: Europe Coffee Trade Analysis Industry Revenue (Million), by Production Analysis 2025 & 2033
- Figure 15: Europe Coffee Trade Analysis Industry Revenue Share (%), by Production Analysis 2025 & 2033
- Figure 16: Europe Coffee Trade Analysis Industry Revenue (Million), by Consumption Analysis 2025 & 2033
- Figure 17: Europe Coffee Trade Analysis Industry Revenue Share (%), by Consumption Analysis 2025 & 2033
- Figure 18: Europe Coffee Trade Analysis Industry Revenue (Million), by Import Market Analysis (Value & Volume) 2025 & 2033
- Figure 19: Europe Coffee Trade Analysis Industry Revenue Share (%), by Import Market Analysis (Value & Volume) 2025 & 2033
- Figure 20: Europe Coffee Trade Analysis Industry Revenue (Million), by Export Market Analysis (Value & Volume) 2025 & 2033
- Figure 21: Europe Coffee Trade Analysis Industry Revenue Share (%), by Export Market Analysis (Value & Volume) 2025 & 2033
- Figure 22: Europe Coffee Trade Analysis Industry Revenue (Million), by Price Trend Analysis 2025 & 2033
- Figure 23: Europe Coffee Trade Analysis Industry Revenue Share (%), by Price Trend Analysis 2025 & 2033
- Figure 24: Europe Coffee Trade Analysis Industry Revenue (Million), by Country 2025 & 2033
- Figure 25: Europe Coffee Trade Analysis Industry Revenue Share (%), by Country 2025 & 2033
- Figure 26: Asia Pacific Coffee Trade Analysis Industry Revenue (Million), by Production Analysis 2025 & 2033
- Figure 27: Asia Pacific Coffee Trade Analysis Industry Revenue Share (%), by Production Analysis 2025 & 2033
- Figure 28: Asia Pacific Coffee Trade Analysis Industry Revenue (Million), by Consumption Analysis 2025 & 2033
- Figure 29: Asia Pacific Coffee Trade Analysis Industry Revenue Share (%), by Consumption Analysis 2025 & 2033
- Figure 30: Asia Pacific Coffee Trade Analysis Industry Revenue (Million), by Import Market Analysis (Value & Volume) 2025 & 2033
- Figure 31: Asia Pacific Coffee Trade Analysis Industry Revenue Share (%), by Import Market Analysis (Value & Volume) 2025 & 2033
- Figure 32: Asia Pacific Coffee Trade Analysis Industry Revenue (Million), by Export Market Analysis (Value & Volume) 2025 & 2033
- Figure 33: Asia Pacific Coffee Trade Analysis Industry Revenue Share (%), by Export Market Analysis (Value & Volume) 2025 & 2033
- Figure 34: Asia Pacific Coffee Trade Analysis Industry Revenue (Million), by Price Trend Analysis 2025 & 2033
- Figure 35: Asia Pacific Coffee Trade Analysis Industry Revenue Share (%), by Price Trend Analysis 2025 & 2033
- Figure 36: Asia Pacific Coffee Trade Analysis Industry Revenue (Million), by Country 2025 & 2033
- Figure 37: Asia Pacific Coffee Trade Analysis Industry Revenue Share (%), by Country 2025 & 2033
- Figure 38: South America Coffee Trade Analysis Industry Revenue (Million), by Production Analysis 2025 & 2033
- Figure 39: South America Coffee Trade Analysis Industry Revenue Share (%), by Production Analysis 2025 & 2033
- Figure 40: South America Coffee Trade Analysis Industry Revenue (Million), by Consumption Analysis 2025 & 2033
- Figure 41: South America Coffee Trade Analysis Industry Revenue Share (%), by Consumption Analysis 2025 & 2033
- Figure 42: South America Coffee Trade Analysis Industry Revenue (Million), by Import Market Analysis (Value & Volume) 2025 & 2033
- Figure 43: South America Coffee Trade Analysis Industry Revenue Share (%), by Import Market Analysis (Value & Volume) 2025 & 2033
- Figure 44: South America Coffee Trade Analysis Industry Revenue (Million), by Export Market Analysis (Value & Volume) 2025 & 2033
- Figure 45: South America Coffee Trade Analysis Industry Revenue Share (%), by Export Market Analysis (Value & Volume) 2025 & 2033
- Figure 46: South America Coffee Trade Analysis Industry Revenue (Million), by Price Trend Analysis 2025 & 2033
- Figure 47: South America Coffee Trade Analysis Industry Revenue Share (%), by Price Trend Analysis 2025 & 2033
- Figure 48: South America Coffee Trade Analysis Industry Revenue (Million), by Country 2025 & 2033
- Figure 49: South America Coffee Trade Analysis Industry Revenue Share (%), by Country 2025 & 2033
- Figure 50: Africa Coffee Trade Analysis Industry Revenue (Million), by Production Analysis 2025 & 2033
- Figure 51: Africa Coffee Trade Analysis Industry Revenue Share (%), by Production Analysis 2025 & 2033
- Figure 52: Africa Coffee Trade Analysis Industry Revenue (Million), by Consumption Analysis 2025 & 2033
- Figure 53: Africa Coffee Trade Analysis Industry Revenue Share (%), by Consumption Analysis 2025 & 2033
- Figure 54: Africa Coffee Trade Analysis Industry Revenue (Million), by Import Market Analysis (Value & Volume) 2025 & 2033
- Figure 55: Africa Coffee Trade Analysis Industry Revenue Share (%), by Import Market Analysis (Value & Volume) 2025 & 2033
- Figure 56: Africa Coffee Trade Analysis Industry Revenue (Million), by Export Market Analysis (Value & Volume) 2025 & 2033
- Figure 57: Africa Coffee Trade Analysis Industry Revenue Share (%), by Export Market Analysis (Value & Volume) 2025 & 2033
- Figure 58: Africa Coffee Trade Analysis Industry Revenue (Million), by Price Trend Analysis 2025 & 2033
- Figure 59: Africa Coffee Trade Analysis Industry Revenue Share (%), by Price Trend Analysis 2025 & 2033
- Figure 60: Africa Coffee Trade Analysis Industry Revenue (Million), by Country 2025 & 2033
- Figure 61: Africa Coffee Trade Analysis Industry Revenue Share (%), by Country 2025 & 2033
List of Tables
- Table 1: Global Coffee Trade Analysis Industry Revenue Million Forecast, by Production Analysis 2020 & 2033
- Table 2: Global Coffee Trade Analysis Industry Revenue Million Forecast, by Consumption Analysis 2020 & 2033
- Table 3: Global Coffee Trade Analysis Industry Revenue Million Forecast, by Import Market Analysis (Value & Volume) 2020 & 2033
- Table 4: Global Coffee Trade Analysis Industry Revenue Million Forecast, by Export Market Analysis (Value & Volume) 2020 & 2033
- Table 5: Global Coffee Trade Analysis Industry Revenue Million Forecast, by Price Trend Analysis 2020 & 2033
- Table 6: Global Coffee Trade Analysis Industry Revenue Million Forecast, by Region 2020 & 2033
- Table 7: Global Coffee Trade Analysis Industry Revenue Million Forecast, by Production Analysis 2020 & 2033
- Table 8: Global Coffee Trade Analysis Industry Revenue Million Forecast, by Consumption Analysis 2020 & 2033
- Table 9: Global Coffee Trade Analysis Industry Revenue Million Forecast, by Import Market Analysis (Value & Volume) 2020 & 2033
- Table 10: Global Coffee Trade Analysis Industry Revenue Million Forecast, by Export Market Analysis (Value & Volume) 2020 & 2033
- Table 11: Global Coffee Trade Analysis Industry Revenue Million Forecast, by Price Trend Analysis 2020 & 2033
- Table 12: Global Coffee Trade Analysis Industry Revenue Million Forecast, by Country 2020 & 2033
- Table 13: United States Coffee Trade Analysis Industry Revenue (Million) Forecast, by Application 2020 & 2033
- Table 14: Canada Coffee Trade Analysis Industry Revenue (Million) Forecast, by Application 2020 & 2033
- Table 15: Mexico Coffee Trade Analysis Industry Revenue (Million) Forecast, by Application 2020 & 2033
- Table 16: Global Coffee Trade Analysis Industry Revenue Million Forecast, by Production Analysis 2020 & 2033
- Table 17: Global Coffee Trade Analysis Industry Revenue Million Forecast, by Consumption Analysis 2020 & 2033
- Table 18: Global Coffee Trade Analysis Industry Revenue Million Forecast, by Import Market Analysis (Value & Volume) 2020 & 2033
- Table 19: Global Coffee Trade Analysis Industry Revenue Million Forecast, by Export Market Analysis (Value & Volume) 2020 & 2033
- Table 20: Global Coffee Trade Analysis Industry Revenue Million Forecast, by Price Trend Analysis 2020 & 2033
- Table 21: Global Coffee Trade Analysis Industry Revenue Million Forecast, by Country 2020 & 2033
- Table 22: United Kingdom Coffee Trade Analysis Industry Revenue (Million) Forecast, by Application 2020 & 2033
- Table 23: Denmark Coffee Trade Analysis Industry Revenue (Million) Forecast, by Application 2020 & 2033
- Table 24: Netherlands Coffee Trade Analysis Industry Revenue (Million) Forecast, by Application 2020 & 2033
- Table 25: Germany Coffee Trade Analysis Industry Revenue (Million) Forecast, by Application 2020 & 2033
- Table 26: Norway Coffee Trade Analysis Industry Revenue (Million) Forecast, by Application 2020 & 2033
- Table 27: Sweden Coffee Trade Analysis Industry Revenue (Million) Forecast, by Application 2020 & 2033
- Table 28: Global Coffee Trade Analysis Industry Revenue Million Forecast, by Production Analysis 2020 & 2033
- Table 29: Global Coffee Trade Analysis Industry Revenue Million Forecast, by Consumption Analysis 2020 & 2033
- Table 30: Global Coffee Trade Analysis Industry Revenue Million Forecast, by Import Market Analysis (Value & Volume) 2020 & 2033
- Table 31: Global Coffee Trade Analysis Industry Revenue Million Forecast, by Export Market Analysis (Value & Volume) 2020 & 2033
- Table 32: Global Coffee Trade Analysis Industry Revenue Million Forecast, by Price Trend Analysis 2020 & 2033
- Table 33: Global Coffee Trade Analysis Industry Revenue Million Forecast, by Country 2020 & 2033
- Table 34: China Coffee Trade Analysis Industry Revenue (Million) Forecast, by Application 2020 & 2033
- Table 35: India Coffee Trade Analysis Industry Revenue (Million) Forecast, by Application 2020 & 2033
- Table 36: Japan Coffee Trade Analysis Industry Revenue (Million) Forecast, by Application 2020 & 2033
- Table 37: Indonesia Coffee Trade Analysis Industry Revenue (Million) Forecast, by Application 2020 & 2033
- Table 38: Philippines Coffee Trade Analysis Industry Revenue (Million) Forecast, by Application 2020 & 2033
- Table 39: Global Coffee Trade Analysis Industry Revenue Million Forecast, by Production Analysis 2020 & 2033
- Table 40: Global Coffee Trade Analysis Industry Revenue Million Forecast, by Consumption Analysis 2020 & 2033
- Table 41: Global Coffee Trade Analysis Industry Revenue Million Forecast, by Import Market Analysis (Value & Volume) 2020 & 2033
- Table 42: Global Coffee Trade Analysis Industry Revenue Million Forecast, by Export Market Analysis (Value & Volume) 2020 & 2033
- Table 43: Global Coffee Trade Analysis Industry Revenue Million Forecast, by Price Trend Analysis 2020 & 2033
- Table 44: Global Coffee Trade Analysis Industry Revenue Million Forecast, by Country 2020 & 2033
- Table 45: Brazil Coffee Trade Analysis Industry Revenue (Million) Forecast, by Application 2020 & 2033
- Table 46: Argentina Coffee Trade Analysis Industry Revenue (Million) Forecast, by Application 2020 & 2033
- Table 47: Global Coffee Trade Analysis Industry Revenue Million Forecast, by Production Analysis 2020 & 2033
- Table 48: Global Coffee Trade Analysis Industry Revenue Million Forecast, by Consumption Analysis 2020 & 2033
- Table 49: Global Coffee Trade Analysis Industry Revenue Million Forecast, by Import Market Analysis (Value & Volume) 2020 & 2033
- Table 50: Global Coffee Trade Analysis Industry Revenue Million Forecast, by Export Market Analysis (Value & Volume) 2020 & 2033
- Table 51: Global Coffee Trade Analysis Industry Revenue Million Forecast, by Price Trend Analysis 2020 & 2033
- Table 52: Global Coffee Trade Analysis Industry Revenue Million Forecast, by Country 2020 & 2033
- Table 53: South Africa Coffee Trade Analysis Industry Revenue (Million) Forecast, by Application 2020 & 2033
Frequently Asked Questions
1. What is the projected Compound Annual Growth Rate (CAGR) of the Coffee Trade Analysis Industry?
The projected CAGR is approximately 2.50%.
2. Which companies are prominent players in the Coffee Trade Analysis Industry?
Key companies in the market include JDE Peet's , Starbucks , Keurig Dr Pepper , Nestlé , Jacobs Douwe Egberts.
3. What are the main segments of the Coffee Trade Analysis Industry?
The market segments include Production Analysis, Consumption Analysis, Import Market Analysis (Value & Volume), Export Market Analysis (Value & Volume), Price Trend Analysis.
4. Can you provide details about the market size?
The market size is estimated to be USD XXX Million as of 2022.
5. What are some drivers contributing to market growth?
Rising Consumption of Cashew Nuts in the Country; Favorable Government Initiatives.
6. What are the notable trends driving market growth?
United States Dominates the Global Imports.
7. Are there any restraints impacting market growth?
Hazardous Climatic Condition Hinders Cashew Production; Stringent Regulations Related to Food Quality Standards.
8. Can you provide examples of recent developments in the market?
January 2023: Coffee exported from India was up by nearly 2% to 400,000 tons in 2022, with the rise in instant coffee exports and re-exports in the country. The export of instant coffee increased by 16.73% to 35,810 tons in 2022 from 29,819 tons in the previous year.
9. What pricing options are available for accessing the report?
Pricing options include single-user, multi-user, and enterprise licenses priced at USD 4750, USD 5250, and USD 8750 respectively.
10. Is the market size provided in terms of value or volume?
The market size is provided in terms of value, measured in Million.
11. Are there any specific market keywords associated with the report?
Yes, the market keyword associated with the report is "Coffee Trade Analysis Industry," which aids in identifying and referencing the specific market segment covered.
12. How do I determine which pricing option suits my needs best?
The pricing options vary based on user requirements and access needs. Individual users may opt for single-user licenses, while businesses requiring broader access may choose multi-user or enterprise licenses for cost-effective access to the report.
13. Are there any additional resources or data provided in the Coffee Trade Analysis Industry report?
While the report offers comprehensive insights, it's advisable to review the specific contents or supplementary materials provided to ascertain if additional resources or data are available.
14. How can I stay updated on further developments or reports in the Coffee Trade Analysis Industry?
To stay informed about further developments, trends, and reports in the Coffee Trade Analysis Industry, consider subscribing to industry newsletters, following relevant companies and organizations, or regularly checking reputable industry news sources and publications.
Methodology
Step 1 - Identification of Relevant Samples Size from Population Database


Step 2 - Approaches for Defining Global Market Size (Value, Volume* & Price*)

Note*: In applicable scenarios
Step 3 - Data Sources
Primary Research
- Web Analytics
- Survey Reports
- Research Institute
- Latest Research Reports
- Opinion Leaders
Secondary Research
- Annual Reports
- White Paper
- Latest Press Release
- Industry Association
- Paid Database
- Investor Presentations

Step 4 - Data Triangulation
Involves using different sources of information in order to increase the validity of a study
These sources are likely to be stakeholders in a program - participants, other researchers, program staff, other community members, and so on.
Then we put all data in single framework & apply various statistical tools to find out the dynamic on the market.
During the analysis stage, feedback from the stakeholder groups would be compared to determine areas of agreement as well as areas of divergence