

Key Insights
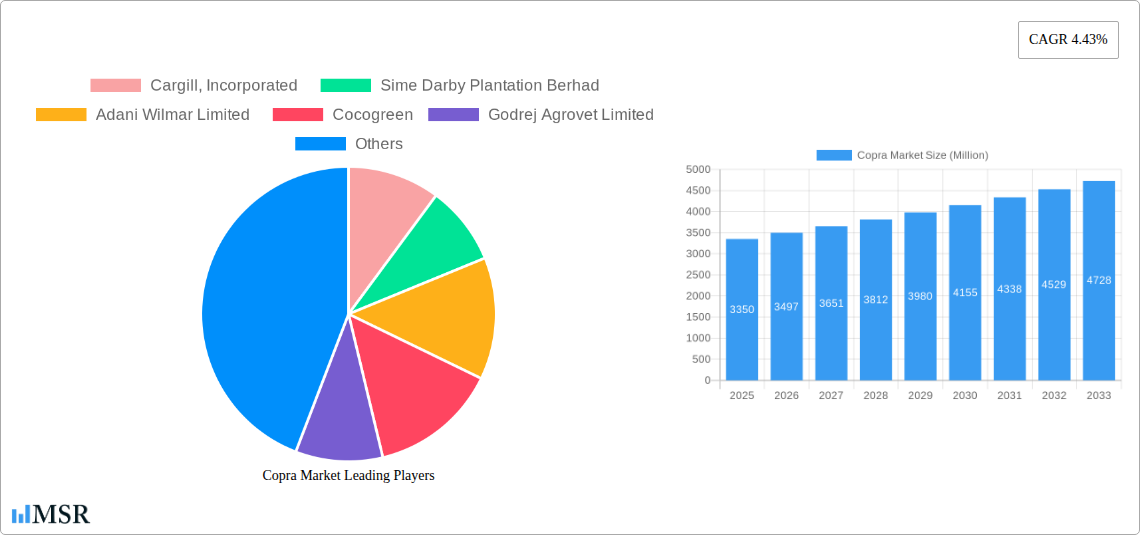
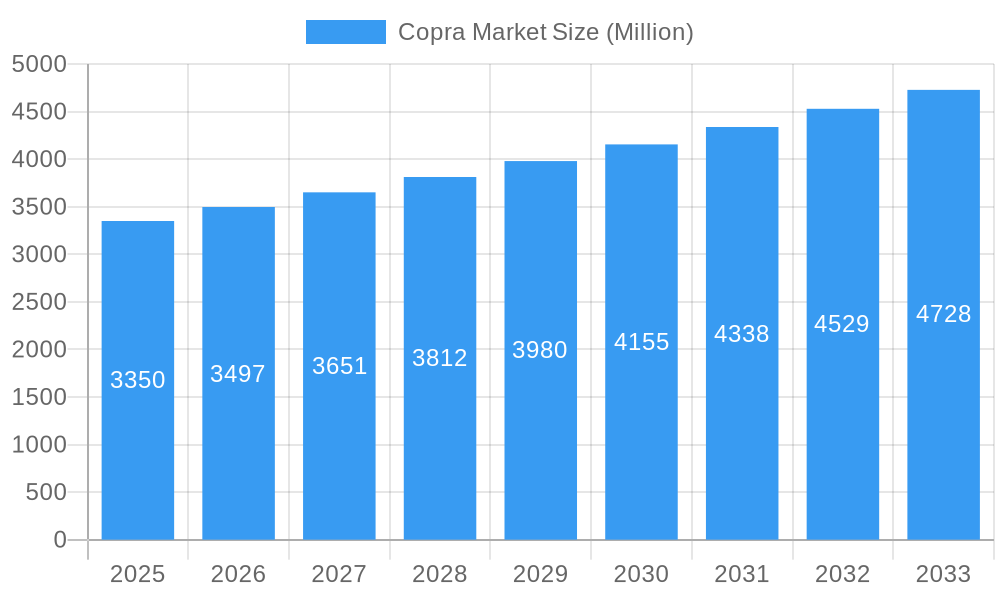
The global copra market, valued at $3.35 billion in 2025, is projected to experience steady growth, driven by increasing demand from the food and beverage, cosmetics, and animal feed industries. The compound annual growth rate (CAGR) of 4.43% from 2025 to 2033 indicates a promising outlook, fueled by rising consumer preference for natural and sustainable ingredients in food products and cosmetics. Growth in the food and beverage sector is primarily attributed to the use of copra in the manufacturing of coconut oil, coconut milk, and other coconut-based products, which are increasingly popular due to their perceived health benefits. The cosmetics industry utilizes copra oil for its moisturizing and nourishing properties, further contributing to market expansion. Meanwhile, the animal feed sector leverages copra as a cost-effective and nutritious feed ingredient. Geographical expansion, particularly in developing economies with rising populations and disposable incomes, is another significant driver. However, challenges like fluctuating copra prices due to weather patterns and variations in coconut yield, coupled with potential competition from alternative ingredients, could act as restraints on market growth. The market is segmented by product type (milling copra, ball copra, edible copra) and application (food and beverage, cosmetics, animal feed), with food manufacturers, cosmetics manufacturers, and animal feed producers representing the key end-users. Major players like Cargill, Sime Darby Plantation, Adani Wilmar, Cocogreen, and Godrej Agrovet are actively shaping the market landscape through innovation and strategic partnerships.
Copra Market Market Size (In Billion)
The regional distribution of the copra market reflects varying levels of consumption and production. Asia Pacific, with its extensive coconut cultivation, is anticipated to hold a dominant market share. North America and Europe, while exhibiting strong demand, are expected to show moderate growth due to established markets and the presence of diverse ingredient options. South America and the Middle East and Africa (MEA) regions present emerging opportunities for expansion as consumption patterns evolve and consumer awareness of copra's benefits increases. Future market growth will depend on factors such as sustainable cultivation practices, efficient processing techniques, and the development of innovative copra-based products that cater to evolving consumer preferences, especially within the health and wellness segments. Furthermore, regulatory frameworks concerning food safety and ingredient sourcing will play a vital role in shaping the market trajectory.
Copra Market Company Market Share
Deep Dive into the Copra Market: A Comprehensive Report (2019-2033)
This comprehensive report provides an in-depth analysis of the global copra market, offering invaluable insights for industry stakeholders, investors, and businesses seeking to navigate this dynamic sector. Spanning the period from 2019 to 2033, with a focus on 2025, this study unveils the market's current state, future trajectory, and key opportunities. The report analyzes market dynamics, key segments (including milling copra, ball copra, and edible copra), leading players such as Cargill, Incorporated, Sime Darby Plantation Berhad, Adani Wilmar Limited, Cocogreen, and Godrej Agrovet Limited, and emerging trends shaping the industry’s future. The market size is projected to reach xx Million by 2033, exhibiting a CAGR of xx%.
Copra Market Concentration & Dynamics
The global copra market exhibits a moderately concentrated landscape, with a few large players holding significant market share. Cargill, Incorporated, and Sime Darby Plantation Berhad are among the dominant players, commanding a combined xx% market share in 2024. However, the market also accommodates several smaller, regional players, particularly in coconut-producing regions.
- Market Share Distribution: Cargill (xx%), Sime Darby Plantation Berhad (xx%), Adani Wilmar Limited (xx%), Others (xx%).
- Innovation Ecosystems: Innovation in copra processing and value-added product development is crucial for growth. Focus areas include sustainable sourcing, efficient milling techniques, and the development of new copra-based products.
- Regulatory Frameworks: Government policies concerning coconut cultivation, trade, and pricing significantly impact market dynamics. Recent examples include the price incentives introduced in Papua New Guinea and the MSP increase in India.
- Substitute Products: While copra has unique properties, substitute products for specific applications exist. The availability and cost of these alternatives can influence demand.
- End-User Trends: Growing demand from the food and beverage, cosmetics, and animal feed industries is driving market expansion. Health-conscious consumer preferences are driving demand for sustainably sourced copra.
- M&A Activities: The copra market witnessed xx M&A deals between 2019 and 2024. Consolidation is expected to continue, driving further market concentration.
Copra Market Industry Insights & Trends
The global copra market is projected to experience substantial growth over the forecast period (2025-2033), fueled by rising demand across various applications. The market size is estimated at xx Million in 2025 and is expected to reach xx Million by 2033, representing a CAGR of xx%. This growth is primarily driven by the increasing demand for coconut products in food and beverages, cosmetics, and animal feed, coupled with expanding coconut cultivation in key regions.
Technological advancements in copra processing and the development of value-added products are further propelling market expansion. Furthermore, changing consumer preferences towards natural and organic ingredients are positively impacting the demand for copra.
Key Markets & Segments Leading Copra Market
The Asia-Pacific region currently dominates the global copra market, accounting for xx% of the global market share in 2024. India, Indonesia, and the Philippines are leading producers and consumers of copra.
- Dominant Regions: Asia-Pacific (xx%), South America (xx%), Africa (xx%), Others (xx%)
- Leading Countries: India, Indonesia, Philippines, Papua New Guinea
- Dominant Product Type: Milling copra currently holds the largest market share among different copra types, owing to its widespread use in various industries.
- Dominant Application Segment: The food and beverage industry represents the primary application segment for copra, driven by its use in various food products.
Drivers for Dominance:
- Strong Economic Growth: Rapid economic growth in several Asia-Pacific countries fuels increased disposable income and demand for processed food and other copra-based products.
- Favorable Climate Conditions: The region boasts a suitable climate for coconut cultivation, leading to high production levels.
- Developed Infrastructure: Improved infrastructure and logistical capabilities contribute to efficient copra production and distribution.
Copra Market Product Developments
Recent innovations in copra processing focus on improving oil extraction efficiency and refining processes to enhance the quality and value of copra-derived products. These advancements have led to the development of higher-quality copra oil and other by-products, catering to the growing demand for natural and organic ingredients in various industries.
Challenges in the Copra Market Market
The copra market faces several challenges, including volatile commodity prices, susceptibility to climate change, and inconsistent supply due to weather patterns. Regulatory hurdles, particularly regarding trade policies and import/export regulations, can impact market dynamics. Furthermore, competition from substitute products and pressure on sustainable sourcing practices pose further challenges.
Forces Driving Copra Market Growth
Key drivers for copra market growth include increasing demand for coconut-based products, technological advancements in processing and value addition, and government support for coconut cultivation in key producing countries. Rising consumer preference for natural and organic ingredients also fuels demand. For example, the recent price incentives introduced in Papua New Guinea and the MSP increase in India are likely to boost copra production.
Long-Term Growth Catalysts in Copra Market
Long-term growth in the copra market will be supported by ongoing research and development efforts to enhance copra processing, the development of new copra-based products, and partnerships that promote sustainable sourcing and fair trade practices. Expansion into new markets and the application of copra in niche areas will further drive growth.
Emerging Opportunities in Copra Market
Emerging opportunities lie in the development of value-added copra products, tapping into the growing demand for sustainable and ethically sourced ingredients, and exploring new applications for copra in diverse industries. Expansion into new markets, particularly in regions with growing consumption of coconut-based products, offers significant growth potential.
Leading Players in the Copra Market Sector
- Cargill, Incorporated
- Sime Darby Plantation Berhad
- Adani Wilmar Limited
- Cocogreen
- Godrej Agrovet Limited
Key Milestones in Copra Market Industry
- December 2022: Indian government increased the minimum support price (MSP) for milling copra and ball copra, boosting production.
- January 2023: Papua New Guinea implemented a price incentive for copra, supporting coconut farmers.
Strategic Outlook for Copra Market Market
The copra market presents a promising outlook, with sustained growth projected for the foreseeable future. Strategic opportunities abound for companies focused on innovation, sustainable practices, and expansion into new markets. Investment in technological advancements and strategic partnerships will be critical to capitalize on the market's potential.
Copra Market Segmentation
- 1. Production Analysis
- 2. Consumption Analysis
- 3. Import Market Analysis (Value & Volume)
- 4. Export Market Analysis (Value & Volume)
- 5. Price Trend Analysis
Copra Market Segmentation By Geography
-
1. North America
- 1.1. United States
-
2. Europe
- 2.1. Germany
-
3. Asia Pacific
- 3.1. China
-
4. South America
- 4.1. Brazil
-
5. Middle East and Africa
- 5.1. South Africa

Copra Market Regional Market Share
Geographic Coverage of Copra Market
Copra Market REPORT HIGHLIGHTS
| Aspects | Details |
|---|---|
| Study Period | 2020-2034 |
| Base Year | 2025 |
| Estimated Year | 2026 |
| Forecast Period | 2026-2034 |
| Historical Period | 2020-2025 |
| Growth Rate | CAGR of 4.43% from 2020-2034 |
| Segmentation |
|
Table of Contents
- 1. Introduction
- 1.1. Research Scope
- 1.2. Market Segmentation
- 1.3. Research Objective
- 1.4. Definitions and Assumptions
- 2. Executive Summary
- 2.1. Market Snapshot
- 3. Market Dynamics
- 3.1. Market Drivers
- 3.2. Market Restrains
- 3.3. Market Trends
- 3.4. Market Opportunities
- 4. Market Factor Analysis
- 4.1. Porters Five Forces
- 4.1.1. Bargaining Power of Suppliers
- 4.1.2. Bargaining Power of Buyers
- 4.1.3. Threat of New Entrants
- 4.1.4. Threat of Substitutes
- 4.1.5. Competitive Rivalry
- 4.2. PESTEL analysis
- 4.3. BCG Analysis
- 4.3.1. Stars (High Growth, High Market Share)
- 4.3.2. Cash Cows (Low Growth, High Market Share)
- 4.3.3. Question Mark (High Growth, Low Market Share)
- 4.3.4. Dogs (Low Growth, Low Market Share)
- 4.4. Ansoff Matrix Analysis
- 4.5. Supply Chain Analysis
- 4.6. Regulatory Landscape
- 4.7. Current Market Potential and Opportunity Assessment (TAM–SAM–SOM Framework)
- 4.8. MSR Analyst Note
- 4.1. Porters Five Forces
- 5. Market Analysis, Insights and Forecast 2021-2033
- 5.1. Market Analysis, Insights and Forecast - by Production Analysis
- 5.2. Market Analysis, Insights and Forecast - by Consumption Analysis
- 5.3. Market Analysis, Insights and Forecast - by Import Market Analysis (Value & Volume)
- 5.4. Market Analysis, Insights and Forecast - by Export Market Analysis (Value & Volume)
- 5.5. Market Analysis, Insights and Forecast - by Price Trend Analysis
- 5.6. Market Analysis, Insights and Forecast - by Region
- 5.6.1. North America
- 5.6.2. Europe
- 5.6.3. Asia Pacific
- 5.6.4. South America
- 5.6.5. Middle East and Africa
- 6. Global Copra Market Analysis, Insights and Forecast, 2021-2033
- 6.1. Market Analysis, Insights and Forecast - by Production Analysis
- 6.2. Market Analysis, Insights and Forecast - by Consumption Analysis
- 6.3. Market Analysis, Insights and Forecast - by Import Market Analysis (Value & Volume)
- 6.4. Market Analysis, Insights and Forecast - by Export Market Analysis (Value & Volume)
- 6.5. Market Analysis, Insights and Forecast - by Price Trend Analysis
- 7. North America Copra Market Analysis, Insights and Forecast, 2020-2032
- 7.1. Market Analysis, Insights and Forecast - by Production Analysis
- 7.2. Market Analysis, Insights and Forecast - by Consumption Analysis
- 7.3. Market Analysis, Insights and Forecast - by Import Market Analysis (Value & Volume)
- 7.4. Market Analysis, Insights and Forecast - by Export Market Analysis (Value & Volume)
- 7.5. Market Analysis, Insights and Forecast - by Price Trend Analysis
- 8. Europe Copra Market Analysis, Insights and Forecast, 2020-2032
- 8.1. Market Analysis, Insights and Forecast - by Production Analysis
- 8.2. Market Analysis, Insights and Forecast - by Consumption Analysis
- 8.3. Market Analysis, Insights and Forecast - by Import Market Analysis (Value & Volume)
- 8.4. Market Analysis, Insights and Forecast - by Export Market Analysis (Value & Volume)
- 8.5. Market Analysis, Insights and Forecast - by Price Trend Analysis
- 9. Asia Pacific Copra Market Analysis, Insights and Forecast, 2020-2032
- 9.1. Market Analysis, Insights and Forecast - by Production Analysis
- 9.2. Market Analysis, Insights and Forecast - by Consumption Analysis
- 9.3. Market Analysis, Insights and Forecast - by Import Market Analysis (Value & Volume)
- 9.4. Market Analysis, Insights and Forecast - by Export Market Analysis (Value & Volume)
- 9.5. Market Analysis, Insights and Forecast - by Price Trend Analysis
- 10. South America Copra Market Analysis, Insights and Forecast, 2020-2032
- 10.1. Market Analysis, Insights and Forecast - by Production Analysis
- 10.2. Market Analysis, Insights and Forecast - by Consumption Analysis
- 10.3. Market Analysis, Insights and Forecast - by Import Market Analysis (Value & Volume)
- 10.4. Market Analysis, Insights and Forecast - by Export Market Analysis (Value & Volume)
- 10.5. Market Analysis, Insights and Forecast - by Price Trend Analysis
- 11. Middle East and Africa Copra Market Analysis, Insights and Forecast, 2020-2032
- 11.1. Market Analysis, Insights and Forecast - by Production Analysis
- 11.2. Market Analysis, Insights and Forecast - by Consumption Analysis
- 11.3. Market Analysis, Insights and Forecast - by Import Market Analysis (Value & Volume)
- 11.4. Market Analysis, Insights and Forecast - by Export Market Analysis (Value & Volume)
- 11.5. Market Analysis, Insights and Forecast - by Price Trend Analysis
- 12. Competitive Analysis
- 12.1. Company Profiles
- 12.1.1 Cargill Incorporated
- 12.1.1.1. Company Overview
- 12.1.1.2. Products
- 12.1.1.3. Company Financials
- 12.1.1.4. SWOT Analysis
- 12.1.2 Sime Darby Plantation Berhad
- 12.1.2.1. Company Overview
- 12.1.2.2. Products
- 12.1.2.3. Company Financials
- 12.1.2.4. SWOT Analysis
- 12.1.3 Adani Wilmar Limited
- 12.1.3.1. Company Overview
- 12.1.3.2. Products
- 12.1.3.3. Company Financials
- 12.1.3.4. SWOT Analysis
- 12.1.4 Cocogreen
- 12.1.4.1. Company Overview
- 12.1.4.2. Products
- 12.1.4.3. Company Financials
- 12.1.4.4. SWOT Analysis
- 12.1.5 Godrej Agrovet Limited
- 12.1.5.1. Company Overview
- 12.1.5.2. Products
- 12.1.5.3. Company Financials
- 12.1.5.4. SWOT Analysis
- 12.1.1 Cargill Incorporated
- 12.2. Market Entropy
- 12.2.1 Company's Key Areas Served
- 12.2.2 Recent Developments
- 12.3. Company Market Share Analysis 2025
- 12.3.1 Top 5 Companies Market Share Analysis
- 12.3.2 Top 3 Companies Market Share Analysis
- 12.4. List of Potential Customers
- 13. Research Methodology
List of Figures
- Figure 1: Global Copra Market Revenue Breakdown (Million, %) by Region 2025 & 2033
- Figure 2: North America Copra Market Revenue (Million), by Production Analysis 2025 & 2033
- Figure 3: North America Copra Market Revenue Share (%), by Production Analysis 2025 & 2033
- Figure 4: North America Copra Market Revenue (Million), by Consumption Analysis 2025 & 2033
- Figure 5: North America Copra Market Revenue Share (%), by Consumption Analysis 2025 & 2033
- Figure 6: North America Copra Market Revenue (Million), by Import Market Analysis (Value & Volume) 2025 & 2033
- Figure 7: North America Copra Market Revenue Share (%), by Import Market Analysis (Value & Volume) 2025 & 2033
- Figure 8: North America Copra Market Revenue (Million), by Export Market Analysis (Value & Volume) 2025 & 2033
- Figure 9: North America Copra Market Revenue Share (%), by Export Market Analysis (Value & Volume) 2025 & 2033
- Figure 10: North America Copra Market Revenue (Million), by Price Trend Analysis 2025 & 2033
- Figure 11: North America Copra Market Revenue Share (%), by Price Trend Analysis 2025 & 2033
- Figure 12: North America Copra Market Revenue (Million), by Country 2025 & 2033
- Figure 13: North America Copra Market Revenue Share (%), by Country 2025 & 2033
- Figure 14: Europe Copra Market Revenue (Million), by Production Analysis 2025 & 2033
- Figure 15: Europe Copra Market Revenue Share (%), by Production Analysis 2025 & 2033
- Figure 16: Europe Copra Market Revenue (Million), by Consumption Analysis 2025 & 2033
- Figure 17: Europe Copra Market Revenue Share (%), by Consumption Analysis 2025 & 2033
- Figure 18: Europe Copra Market Revenue (Million), by Import Market Analysis (Value & Volume) 2025 & 2033
- Figure 19: Europe Copra Market Revenue Share (%), by Import Market Analysis (Value & Volume) 2025 & 2033
- Figure 20: Europe Copra Market Revenue (Million), by Export Market Analysis (Value & Volume) 2025 & 2033
- Figure 21: Europe Copra Market Revenue Share (%), by Export Market Analysis (Value & Volume) 2025 & 2033
- Figure 22: Europe Copra Market Revenue (Million), by Price Trend Analysis 2025 & 2033
- Figure 23: Europe Copra Market Revenue Share (%), by Price Trend Analysis 2025 & 2033
- Figure 24: Europe Copra Market Revenue (Million), by Country 2025 & 2033
- Figure 25: Europe Copra Market Revenue Share (%), by Country 2025 & 2033
- Figure 26: Asia Pacific Copra Market Revenue (Million), by Production Analysis 2025 & 2033
- Figure 27: Asia Pacific Copra Market Revenue Share (%), by Production Analysis 2025 & 2033
- Figure 28: Asia Pacific Copra Market Revenue (Million), by Consumption Analysis 2025 & 2033
- Figure 29: Asia Pacific Copra Market Revenue Share (%), by Consumption Analysis 2025 & 2033
- Figure 30: Asia Pacific Copra Market Revenue (Million), by Import Market Analysis (Value & Volume) 2025 & 2033
- Figure 31: Asia Pacific Copra Market Revenue Share (%), by Import Market Analysis (Value & Volume) 2025 & 2033
- Figure 32: Asia Pacific Copra Market Revenue (Million), by Export Market Analysis (Value & Volume) 2025 & 2033
- Figure 33: Asia Pacific Copra Market Revenue Share (%), by Export Market Analysis (Value & Volume) 2025 & 2033
- Figure 34: Asia Pacific Copra Market Revenue (Million), by Price Trend Analysis 2025 & 2033
- Figure 35: Asia Pacific Copra Market Revenue Share (%), by Price Trend Analysis 2025 & 2033
- Figure 36: Asia Pacific Copra Market Revenue (Million), by Country 2025 & 2033
- Figure 37: Asia Pacific Copra Market Revenue Share (%), by Country 2025 & 2033
- Figure 38: South America Copra Market Revenue (Million), by Production Analysis 2025 & 2033
- Figure 39: South America Copra Market Revenue Share (%), by Production Analysis 2025 & 2033
- Figure 40: South America Copra Market Revenue (Million), by Consumption Analysis 2025 & 2033
- Figure 41: South America Copra Market Revenue Share (%), by Consumption Analysis 2025 & 2033
- Figure 42: South America Copra Market Revenue (Million), by Import Market Analysis (Value & Volume) 2025 & 2033
- Figure 43: South America Copra Market Revenue Share (%), by Import Market Analysis (Value & Volume) 2025 & 2033
- Figure 44: South America Copra Market Revenue (Million), by Export Market Analysis (Value & Volume) 2025 & 2033
- Figure 45: South America Copra Market Revenue Share (%), by Export Market Analysis (Value & Volume) 2025 & 2033
- Figure 46: South America Copra Market Revenue (Million), by Price Trend Analysis 2025 & 2033
- Figure 47: South America Copra Market Revenue Share (%), by Price Trend Analysis 2025 & 2033
- Figure 48: South America Copra Market Revenue (Million), by Country 2025 & 2033
- Figure 49: South America Copra Market Revenue Share (%), by Country 2025 & 2033
- Figure 50: Middle East and Africa Copra Market Revenue (Million), by Production Analysis 2025 & 2033
- Figure 51: Middle East and Africa Copra Market Revenue Share (%), by Production Analysis 2025 & 2033
- Figure 52: Middle East and Africa Copra Market Revenue (Million), by Consumption Analysis 2025 & 2033
- Figure 53: Middle East and Africa Copra Market Revenue Share (%), by Consumption Analysis 2025 & 2033
- Figure 54: Middle East and Africa Copra Market Revenue (Million), by Import Market Analysis (Value & Volume) 2025 & 2033
- Figure 55: Middle East and Africa Copra Market Revenue Share (%), by Import Market Analysis (Value & Volume) 2025 & 2033
- Figure 56: Middle East and Africa Copra Market Revenue (Million), by Export Market Analysis (Value & Volume) 2025 & 2033
- Figure 57: Middle East and Africa Copra Market Revenue Share (%), by Export Market Analysis (Value & Volume) 2025 & 2033
- Figure 58: Middle East and Africa Copra Market Revenue (Million), by Price Trend Analysis 2025 & 2033
- Figure 59: Middle East and Africa Copra Market Revenue Share (%), by Price Trend Analysis 2025 & 2033
- Figure 60: Middle East and Africa Copra Market Revenue (Million), by Country 2025 & 2033
- Figure 61: Middle East and Africa Copra Market Revenue Share (%), by Country 2025 & 2033
List of Tables
- Table 1: Global Copra Market Revenue Million Forecast, by Production Analysis 2020 & 2033
- Table 2: Global Copra Market Revenue Million Forecast, by Consumption Analysis 2020 & 2033
- Table 3: Global Copra Market Revenue Million Forecast, by Import Market Analysis (Value & Volume) 2020 & 2033
- Table 4: Global Copra Market Revenue Million Forecast, by Export Market Analysis (Value & Volume) 2020 & 2033
- Table 5: Global Copra Market Revenue Million Forecast, by Price Trend Analysis 2020 & 2033
- Table 6: Global Copra Market Revenue Million Forecast, by Region 2020 & 2033
- Table 7: Global Copra Market Revenue Million Forecast, by Production Analysis 2020 & 2033
- Table 8: Global Copra Market Revenue Million Forecast, by Consumption Analysis 2020 & 2033
- Table 9: Global Copra Market Revenue Million Forecast, by Import Market Analysis (Value & Volume) 2020 & 2033
- Table 10: Global Copra Market Revenue Million Forecast, by Export Market Analysis (Value & Volume) 2020 & 2033
- Table 11: Global Copra Market Revenue Million Forecast, by Price Trend Analysis 2020 & 2033
- Table 12: Global Copra Market Revenue Million Forecast, by Country 2020 & 2033
- Table 13: United States Copra Market Revenue (Million) Forecast, by Application 2020 & 2033
- Table 14: Global Copra Market Revenue Million Forecast, by Production Analysis 2020 & 2033
- Table 15: Global Copra Market Revenue Million Forecast, by Consumption Analysis 2020 & 2033
- Table 16: Global Copra Market Revenue Million Forecast, by Import Market Analysis (Value & Volume) 2020 & 2033
- Table 17: Global Copra Market Revenue Million Forecast, by Export Market Analysis (Value & Volume) 2020 & 2033
- Table 18: Global Copra Market Revenue Million Forecast, by Price Trend Analysis 2020 & 2033
- Table 19: Global Copra Market Revenue Million Forecast, by Country 2020 & 2033
- Table 20: Germany Copra Market Revenue (Million) Forecast, by Application 2020 & 2033
- Table 21: Global Copra Market Revenue Million Forecast, by Production Analysis 2020 & 2033
- Table 22: Global Copra Market Revenue Million Forecast, by Consumption Analysis 2020 & 2033
- Table 23: Global Copra Market Revenue Million Forecast, by Import Market Analysis (Value & Volume) 2020 & 2033
- Table 24: Global Copra Market Revenue Million Forecast, by Export Market Analysis (Value & Volume) 2020 & 2033
- Table 25: Global Copra Market Revenue Million Forecast, by Price Trend Analysis 2020 & 2033
- Table 26: Global Copra Market Revenue Million Forecast, by Country 2020 & 2033
- Table 27: China Copra Market Revenue (Million) Forecast, by Application 2020 & 2033
- Table 28: Global Copra Market Revenue Million Forecast, by Production Analysis 2020 & 2033
- Table 29: Global Copra Market Revenue Million Forecast, by Consumption Analysis 2020 & 2033
- Table 30: Global Copra Market Revenue Million Forecast, by Import Market Analysis (Value & Volume) 2020 & 2033
- Table 31: Global Copra Market Revenue Million Forecast, by Export Market Analysis (Value & Volume) 2020 & 2033
- Table 32: Global Copra Market Revenue Million Forecast, by Price Trend Analysis 2020 & 2033
- Table 33: Global Copra Market Revenue Million Forecast, by Country 2020 & 2033
- Table 34: Brazil Copra Market Revenue (Million) Forecast, by Application 2020 & 2033
- Table 35: Global Copra Market Revenue Million Forecast, by Production Analysis 2020 & 2033
- Table 36: Global Copra Market Revenue Million Forecast, by Consumption Analysis 2020 & 2033
- Table 37: Global Copra Market Revenue Million Forecast, by Import Market Analysis (Value & Volume) 2020 & 2033
- Table 38: Global Copra Market Revenue Million Forecast, by Export Market Analysis (Value & Volume) 2020 & 2033
- Table 39: Global Copra Market Revenue Million Forecast, by Price Trend Analysis 2020 & 2033
- Table 40: Global Copra Market Revenue Million Forecast, by Country 2020 & 2033
- Table 41: South Africa Copra Market Revenue (Million) Forecast, by Application 2020 & 2033
Frequently Asked Questions
1. What is the projected Compound Annual Growth Rate (CAGR) of the Copra Market?
The projected CAGR is approximately 4.43%.
2. Which companies are prominent players in the Copra Market?
Key companies in the market include Cargill, Incorporated , Sime Darby Plantation Berhad , Adani Wilmar Limited , Cocogreen, Godrej Agrovet Limited .
3. What are the main segments of the Copra Market?
The market segments include Production Analysis, Consumption Analysis, Import Market Analysis (Value & Volume), Export Market Analysis (Value & Volume), Price Trend Analysis.
4. Can you provide details about the market size?
The market size is estimated to be USD 3.35 Million as of 2022.
5. What are some drivers contributing to market growth?
Increasing Demand for Garlic Due to Various Uses in Industries; Rising Demad of Organic Garlic; Increasing Government Initiatives.
6. What are the notable trends driving market growth?
Growing Inclination towards Animal Sourced Food.
7. Are there any restraints impacting market growth?
Lack of Technical Knowledge of Farmers; Price Fluctuations.
8. Can you provide examples of recent developments in the market?
January 2023: The Papua New Guinea Minister for Agriculture implemented a price incentive for copra. Minister for Agriculture Aiya Tambua announced the new price support for copra or coconut farmers in the country.
9. What pricing options are available for accessing the report?
Pricing options include single-user, multi-user, and enterprise licenses priced at USD 4750, USD 5250, and USD 8750 respectively.
10. Is the market size provided in terms of value or volume?
The market size is provided in terms of value, measured in Million.
11. Are there any specific market keywords associated with the report?
Yes, the market keyword associated with the report is "Copra Market," which aids in identifying and referencing the specific market segment covered.
12. How do I determine which pricing option suits my needs best?
The pricing options vary based on user requirements and access needs. Individual users may opt for single-user licenses, while businesses requiring broader access may choose multi-user or enterprise licenses for cost-effective access to the report.
13. Are there any additional resources or data provided in the Copra Market report?
While the report offers comprehensive insights, it's advisable to review the specific contents or supplementary materials provided to ascertain if additional resources or data are available.
14. How can I stay updated on further developments or reports in the Copra Market?
To stay informed about further developments, trends, and reports in the Copra Market, consider subscribing to industry newsletters, following relevant companies and organizations, or regularly checking reputable industry news sources and publications.
Methodology
Step 1 - Identification of Relevant Samples Size from Population Database


Step 2 - Approaches for Defining Global Market Size (Value, Volume* & Price*)

Note*: In applicable scenarios
Step 3 - Data Sources
Primary Research
- Web Analytics
- Survey Reports
- Research Institute
- Latest Research Reports
- Opinion Leaders
Secondary Research
- Annual Reports
- White Paper
- Latest Press Release
- Industry Association
- Paid Database
- Investor Presentations

Step 4 - Data Triangulation
Involves using different sources of information in order to increase the validity of a study
These sources are likely to be stakeholders in a program - participants, other researchers, program staff, other community members, and so on.
Then we put all data in single framework & apply various statistical tools to find out the dynamic on the market.
During the analysis stage, feedback from the stakeholder groups would be compared to determine areas of agreement as well as areas of divergence