

Key Insights
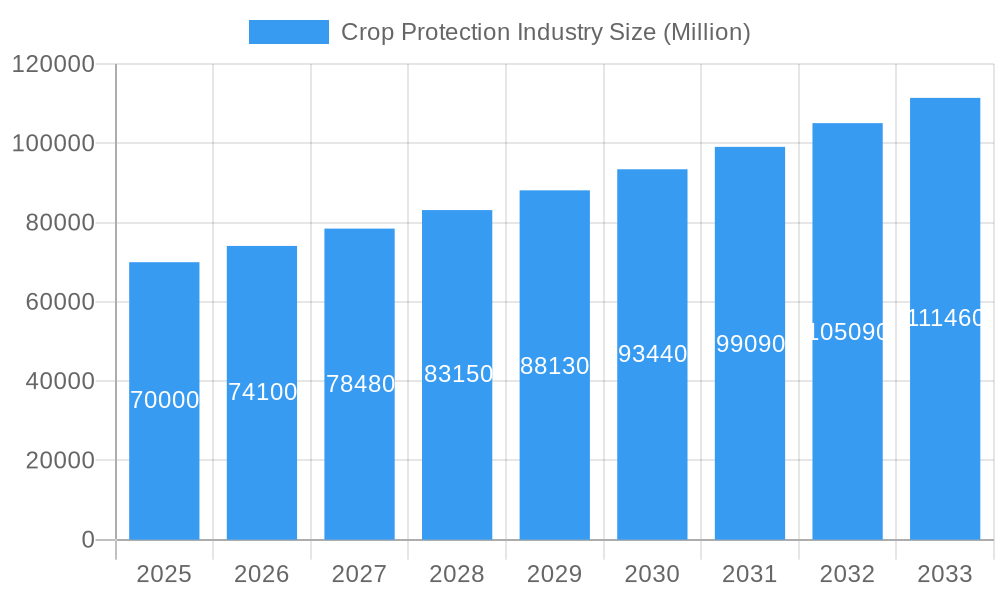
The global crop protection market, valued at approximately $70 billion in 2025, is projected to experience robust growth, driven by a 5.6% CAGR from 2025 to 2033. This expansion is fueled by several key factors. Increasing global food demand necessitates higher crop yields, leading to greater reliance on pesticides, herbicides, and other crop protection solutions. Furthermore, the growing prevalence of crop diseases and pest infestations, exacerbated by climate change and evolving pest resistance, necessitates the development and adoption of innovative and more effective crop protection technologies. The shift towards sustainable agriculture practices, while presenting challenges, also creates opportunities for biopesticides and integrated pest management (IPM) strategies within the market. The market is segmented by function (fungicides, herbicides, insecticides, etc.), application mode (foliar, soil treatment, etc.), and crop type (grains & cereals, fruits & vegetables, etc.), each exhibiting unique growth trajectories based on specific regional needs and agricultural practices. Major players like FMC Corporation, Bayer AG, Syngenta, and BASF are investing heavily in R&D to develop novel products and strengthen their market positions.
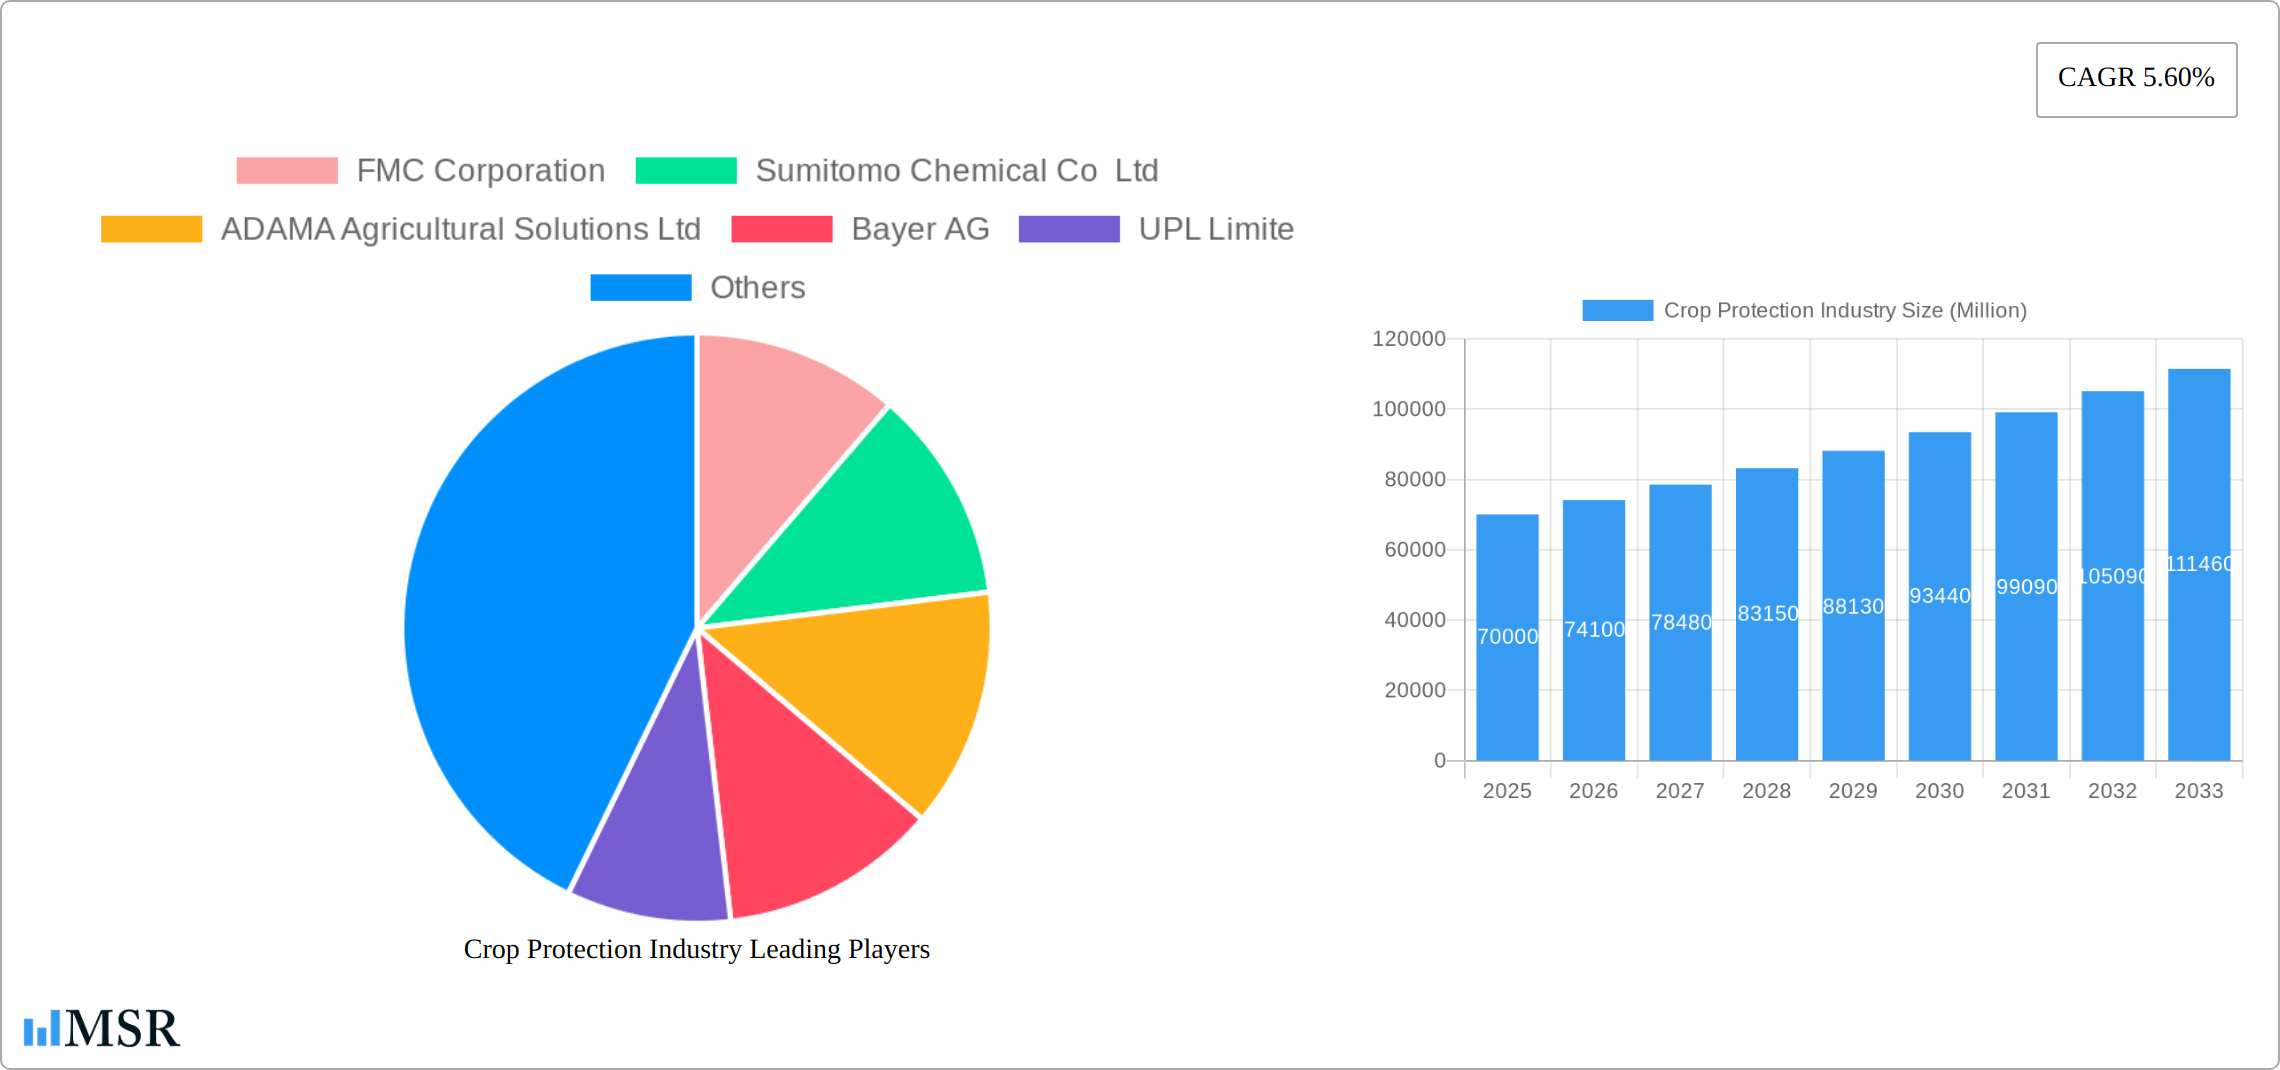
Crop Protection Industry Market Size (In Billion)
The diverse range of crop protection products caters to the varying needs of different agricultural sectors. The insecticide segment is expected to maintain its dominant position, driven by consistent demand for protection against insect pests. Herbicides are also a significant segment, reflecting the continued need for weed control in various crops. However, the growing awareness of environmental concerns is driving a shift towards environmentally friendly crop protection solutions, including biopesticides and integrated pest management (IPM) techniques. Regional variations exist, with developed markets showing a higher adoption of advanced technologies, while developing regions present significant growth potential due to increasing agricultural activities and rising awareness of crop protection needs. The market is expected to see consolidation through mergers and acquisitions as companies strive for greater market share and access to innovative technologies.
Crop Protection Industry Company Market Share
Crop Protection Industry Market Report: 2019-2033
This comprehensive report provides a detailed analysis of the global crop protection industry, offering invaluable insights for stakeholders, investors, and industry professionals. With a study period spanning 2019-2033, a base year of 2025, and a forecast period of 2025-2033, this report leverages historical data (2019-2024) to predict future market trends and opportunities. The global market size is estimated at xx Million in 2025, showcasing significant growth potential in the coming years. This report covers key segments like fungicides, herbicides, insecticides, and more, analyzing market dynamics, leading players (including FMC Corporation, Sumitomo Chemical Co Ltd, ADAMA Agricultural Solutions Ltd, Bayer AG, UPL Limited, Syngenta Group, Jiangsu Yangnong Chemical Co Ltd, Corteva Agriscience, Nufarm Ltd, and BASF SE), and emerging trends.
Crop Protection Industry Market Concentration & Dynamics
The crop protection industry exhibits a moderately concentrated market structure, dominated by several multinational corporations possessing substantial market share. This concentration is a result of several key factors, including significant economies of scale, robust research and development (R&D) capabilities, and extensive global distribution networks. Giants like Bayer AG and Syngenta Group hold commanding positions. However, a dynamic competitive landscape is emerging, fueled by the growth of regional players and specialized companies offering niche solutions. A thriving innovation ecosystem, characterized by substantial R&D investments, is driving the development of cutting-edge crop protection technologies. This innovation is crucial for addressing evolving agricultural challenges and meeting the demands of a growing global population.
The regulatory environment significantly shapes market dynamics. Stringent environmental regulations and stringent safety standards worldwide influence product development, registration, and market access. The increasing availability of substitute products, such as biological control agents (biopesticides) and the wider adoption of integrated pest management (IPM) strategies, adds another layer of complexity to the competitive landscape. Furthermore, evolving end-user preferences, notably the rising demand for sustainable and environmentally friendly solutions, are reshaping industry priorities and driving the adoption of more eco-conscious practices. The industry has witnessed considerable merger and acquisition (M&A) activity in recent years, reflecting a strategic push for expansion and consolidation. This M&A activity has directly influenced market share distribution and the overall competitive landscape.
- Market Share (2025 Estimate): Top 5 players hold an estimated [Insert Percentage]% of the global market share. (Note: Please replace "[Insert Percentage]%" with the actual data.)
- M&A Deal Count (2019-2024): Approximately [Insert Number] deals, primarily driven by consolidation efforts and strategic market expansion. (Note: Please replace "[Insert Number]" with the actual data.)
- Regulatory Landscape: Stringent regulations in key markets continue to influence product registration and approval processes, increasing the time and cost associated with bringing new products to market.
- Substitute Products: The burgeoning market for biologicals and biopesticides presents a notable challenge to traditional chemical-based crop protection products, driving innovation and the development of integrated approaches.
Crop Protection Industry Industry Insights & Trends
The global crop protection market is experiencing robust growth, driven by factors such as increasing global food demand, changing agricultural practices, and the growing prevalence of crop diseases and pests. The market size is projected to reach xx Million by 2033, exhibiting a CAGR of xx% during the forecast period (2025-2033). Technological disruptions, including the advent of precision agriculture and digital farming technologies, are transforming the industry. These technologies enable targeted application of crop protection products, optimizing efficacy and minimizing environmental impact. Consumer behavior is also evolving, with increased awareness of sustainability and environmental concerns leading to a rising demand for eco-friendly crop protection solutions. This is driving innovation in biological control agents and biopesticides. The industry is also witnessing a growing focus on integrated pest management (IPM) strategies, which combine different approaches to control pests and diseases.
Key Markets & Segments Leading Crop Protection Industry
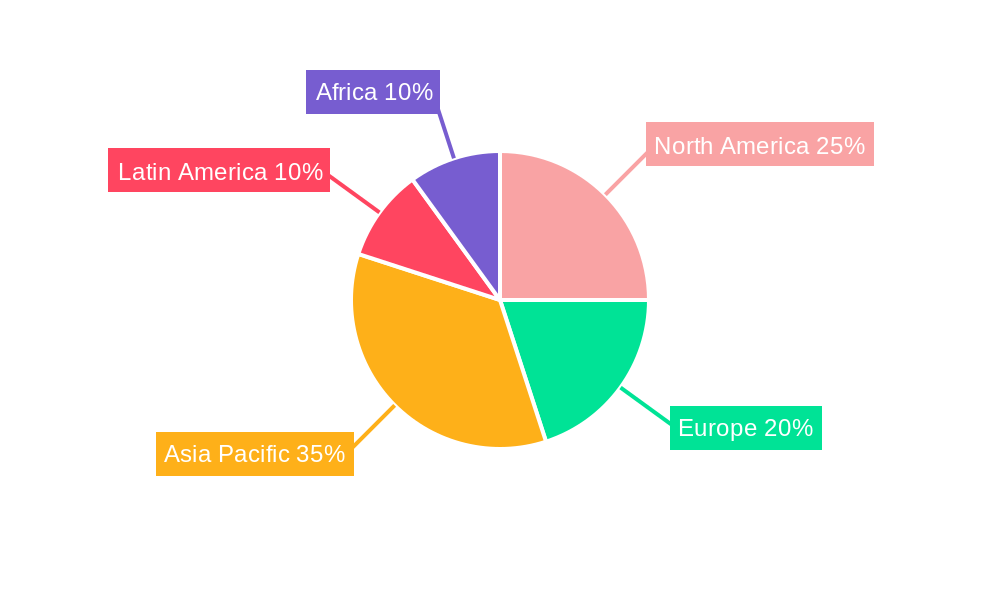
The Asia-Pacific region is expected to dominate the crop protection market during the forecast period, driven by factors such as rapid economic growth, rising agricultural production, and increasing adoption of modern farming techniques. Within crop types, grains and cereals represent the largest segment, followed by fruits and vegetables. The most dominant functions include herbicides and insecticides.
Region: Asia-Pacific holds the largest market share in 2025 with xx Million USD.
Crop Type: Grains & Cereals (Largest segment, expected market size of xx Million in 2025).
Function: Herbicides (Largest segment, xx Million in 2025) and Insecticides (Second largest segment, xx Million in 2025).
Application Mode: Foliar application (largest segment, xx Million in 2025).
Drivers for Asia-Pacific Dominance:
- Rapid economic growth and increasing disposable incomes.
- Expanding agricultural land and intensification of farming practices.
- Government initiatives promoting agricultural development and modernization.
Crop Protection Industry Product Developments
Recent years have witnessed significant advancements in crop protection product development. Companies are focusing on developing products with improved efficacy, lower environmental impact, and enhanced safety profiles. This includes innovations in formulation technologies, leading to products with improved sprayability, reduced drift, and enhanced target specificity. The development of new active ingredients and innovative delivery systems is also playing a crucial role in enhancing product performance and efficiency. These advancements provide significant competitive advantages, enabling companies to cater to the evolving needs of farmers and address emerging challenges in crop protection.
Challenges in the Crop Protection Industry Market
The crop protection industry faces several challenges, including stringent regulatory hurdles that increase product registration costs and timelines. This also leads to higher costs for the farmers. Supply chain disruptions, particularly in the sourcing of raw materials and active ingredients, can impact product availability and profitability. Intense competition among established players and the emergence of new entrants create price pressures and limit profit margins. The market also faces pressure from growing consumer concerns regarding the environmental and health implications of chemical pesticides, potentially impacting consumer demand. These challenges collectively reduce the overall profitability of the crop protection industry.
Forces Driving Crop Protection Industry Growth
Technological advancements in precision agriculture, like drone technology and sensor-based monitoring systems, are optimizing pesticide application. Economic growth in developing nations drives demand for increased food production. Government regulations, while posing challenges, also incentivize sustainable practices and innovation in crop protection technology. Examples include subsidies for adopting biopesticides and promoting integrated pest management practices.
Long-Term Growth Catalysts in the Crop Protection Industry
Long-term growth will be fueled by continued innovation in biopesticides and other sustainable solutions. Strategic partnerships between chemical companies and biotech firms will accelerate the development and market adoption of novel crop protection technologies. Market expansion into developing economies with growing agricultural sectors presents substantial opportunities for future growth.
Emerging Opportunities in Crop Protection Industry
The growing demand for organic and sustainable farming practices presents significant opportunities for biopesticides and biocontrol agents. Precision agriculture technologies, such as targeted spraying and remote sensing, are creating efficiencies and reducing pesticide use. Developing innovative solutions for emerging pest and disease threats will provide significant growth prospects for companies.
Leading Players in the Crop Protection Industry Sector
- FMC Corporation
- Sumitomo Chemical Co Ltd
- ADAMA Agricultural Solutions Ltd
- Bayer AG
- UPL Limited
- Syngenta Group
- Jiangsu Yangnong Chemical Co Ltd
- Corteva Agriscience
- Nufarm Ltd
- BASF SE
Key Milestones in Crop Protection Industry Industry
- December 2023: ADAMA launched Kampai, a cross-spectrum herbicide for grain crops, expanding application windows for weed control.
- July 2023: ADAMA introduced Davai A Plus and Clearfield Broad-Spectrum Herbicide Solutions for imidazolinone-tolerant legumes.
- April 2023: Nufarm launched Tourney EZ, a liquid fungicide for turf and ornamental crops, strengthening its position in this segment.
Strategic Outlook for Crop Protection Industry Market
The crop protection industry is poised for sustained growth, driven by technological advancements, increasing food demand, and the growing need for sustainable agricultural practices. Strategic opportunities lie in developing innovative, environmentally friendly solutions, expanding into emerging markets, and forging strategic partnerships to accelerate innovation and market penetration. Companies focusing on sustainable solutions, digital agriculture, and integrated pest management strategies are best positioned to capitalize on future market potential.
Crop Protection Industry Segmentation
-
1. Function
- 1.1. Fungicide
- 1.2. Herbicide
- 1.3. Insecticide
- 1.4. Molluscicide
- 1.5. Nematicide
-
2. Application Mode
- 2.1. Chemigation
- 2.2. Foliar
- 2.3. Fumigation
- 2.4. Seed Treatment
- 2.5. Soil Treatment
-
3. Crop Type
- 3.1. Commercial Crops
- 3.2. Fruits & Vegetables
- 3.3. Grains & Cereals
- 3.4. Pulses & Oilseeds
- 3.5. Turf & Ornamental
-
4. Function
- 4.1. Fungicide
- 4.2. Herbicide
- 4.3. Insecticide
- 4.4. Molluscicide
- 4.5. Nematicide
-
5. Application Mode
- 5.1. Chemigation
- 5.2. Foliar
- 5.3. Fumigation
- 5.4. Seed Treatment
- 5.5. Soil Treatment
-
6. Crop Type
- 6.1. Commercial Crops
- 6.2. Fruits & Vegetables
- 6.3. Grains & Cereals
- 6.4. Pulses & Oilseeds
- 6.5. Turf & Ornamental
Crop Protection Industry Segmentation By Geography
-
1. North America
- 1.1. United States
- 1.2. Canada
- 1.3. Mexico
-
2. South America
- 2.1. Brazil
- 2.2. Argentina
- 2.3. Rest of South America
-
3. Europe
- 3.1. United Kingdom
- 3.2. Germany
- 3.3. France
- 3.4. Italy
- 3.5. Spain
- 3.6. Russia
- 3.7. Benelux
- 3.8. Nordics
- 3.9. Rest of Europe
-
4. Middle East & Africa
- 4.1. Turkey
- 4.2. Israel
- 4.3. GCC
- 4.4. North Africa
- 4.5. South Africa
- 4.6. Rest of Middle East & Africa
-
5. Asia Pacific
- 5.1. China
- 5.2. India
- 5.3. Japan
- 5.4. South Korea
- 5.5. ASEAN
- 5.6. Oceania
- 5.7. Rest of Asia Pacific
Crop Protection Industry Regional Market Share
Geographic Coverage of Crop Protection Industry
Crop Protection Industry REPORT HIGHLIGHTS
| Aspects | Details |
|---|---|
| Study Period | 2020-2034 |
| Base Year | 2025 |
| Estimated Year | 2026 |
| Forecast Period | 2026-2034 |
| Historical Period | 2020-2025 |
| Growth Rate | CAGR of 5.60% from 2020-2034 |
| Segmentation |
|
Table of Contents
- 1. Introduction
- 1.1. Research Scope
- 1.2. Market Segmentation
- 1.3. Research Objective
- 1.4. Definitions and Assumptions
- 2. Executive Summary
- 2.1. Market Snapshot
- 3. Market Dynamics
- 3.1. Market Drivers
- 3.2. Market Restrains
- 3.3. Market Trends
- 3.4. Market Opportunities
- 4. Market Factor Analysis
- 4.1. Porters Five Forces
- 4.1.1. Bargaining Power of Suppliers
- 4.1.2. Bargaining Power of Buyers
- 4.1.3. Threat of New Entrants
- 4.1.4. Threat of Substitutes
- 4.1.5. Competitive Rivalry
- 4.2. PESTEL analysis
- 4.3. BCG Analysis
- 4.3.1. Stars (High Growth, High Market Share)
- 4.3.2. Cash Cows (Low Growth, High Market Share)
- 4.3.3. Question Mark (High Growth, Low Market Share)
- 4.3.4. Dogs (Low Growth, Low Market Share)
- 4.4. Ansoff Matrix Analysis
- 4.5. Supply Chain Analysis
- 4.6. Regulatory Landscape
- 4.7. Current Market Potential and Opportunity Assessment (TAM–SAM–SOM Framework)
- 4.8. MSR Analyst Note
- 4.1. Porters Five Forces
- 5. Market Analysis, Insights and Forecast 2021-2033
- 5.1. Market Analysis, Insights and Forecast - by Function
- 5.1.1. Fungicide
- 5.1.2. Herbicide
- 5.1.3. Insecticide
- 5.1.4. Molluscicide
- 5.1.5. Nematicide
- 5.2. Market Analysis, Insights and Forecast - by Application Mode
- 5.2.1. Chemigation
- 5.2.2. Foliar
- 5.2.3. Fumigation
- 5.2.4. Seed Treatment
- 5.2.5. Soil Treatment
- 5.3. Market Analysis, Insights and Forecast - by Crop Type
- 5.3.1. Commercial Crops
- 5.3.2. Fruits & Vegetables
- 5.3.3. Grains & Cereals
- 5.3.4. Pulses & Oilseeds
- 5.3.5. Turf & Ornamental
- 5.4. Market Analysis, Insights and Forecast - by Function
- 5.4.1. Fungicide
- 5.4.2. Herbicide
- 5.4.3. Insecticide
- 5.4.4. Molluscicide
- 5.4.5. Nematicide
- 5.5. Market Analysis, Insights and Forecast - by Application Mode
- 5.5.1. Chemigation
- 5.5.2. Foliar
- 5.5.3. Fumigation
- 5.5.4. Seed Treatment
- 5.5.5. Soil Treatment
- 5.6. Market Analysis, Insights and Forecast - by Crop Type
- 5.6.1. Commercial Crops
- 5.6.2. Fruits & Vegetables
- 5.6.3. Grains & Cereals
- 5.6.4. Pulses & Oilseeds
- 5.6.5. Turf & Ornamental
- 5.7. Market Analysis, Insights and Forecast - by Region
- 5.7.1. North America
- 5.7.2. South America
- 5.7.3. Europe
- 5.7.4. Middle East & Africa
- 5.7.5. Asia Pacific
- 5.1. Market Analysis, Insights and Forecast - by Function
- 6. Global Crop Protection Industry Analysis, Insights and Forecast, 2021-2033
- 6.1. Market Analysis, Insights and Forecast - by Function
- 6.1.1. Fungicide
- 6.1.2. Herbicide
- 6.1.3. Insecticide
- 6.1.4. Molluscicide
- 6.1.5. Nematicide
- 6.2. Market Analysis, Insights and Forecast - by Application Mode
- 6.2.1. Chemigation
- 6.2.2. Foliar
- 6.2.3. Fumigation
- 6.2.4. Seed Treatment
- 6.2.5. Soil Treatment
- 6.3. Market Analysis, Insights and Forecast - by Crop Type
- 6.3.1. Commercial Crops
- 6.3.2. Fruits & Vegetables
- 6.3.3. Grains & Cereals
- 6.3.4. Pulses & Oilseeds
- 6.3.5. Turf & Ornamental
- 6.4. Market Analysis, Insights and Forecast - by Function
- 6.4.1. Fungicide
- 6.4.2. Herbicide
- 6.4.3. Insecticide
- 6.4.4. Molluscicide
- 6.4.5. Nematicide
- 6.5. Market Analysis, Insights and Forecast - by Application Mode
- 6.5.1. Chemigation
- 6.5.2. Foliar
- 6.5.3. Fumigation
- 6.5.4. Seed Treatment
- 6.5.5. Soil Treatment
- 6.6. Market Analysis, Insights and Forecast - by Crop Type
- 6.6.1. Commercial Crops
- 6.6.2. Fruits & Vegetables
- 6.6.3. Grains & Cereals
- 6.6.4. Pulses & Oilseeds
- 6.6.5. Turf & Ornamental
- 6.1. Market Analysis, Insights and Forecast - by Function
- 7. North America Crop Protection Industry Analysis, Insights and Forecast, 2020-2032
- 7.1. Market Analysis, Insights and Forecast - by Function
- 7.1.1. Fungicide
- 7.1.2. Herbicide
- 7.1.3. Insecticide
- 7.1.4. Molluscicide
- 7.1.5. Nematicide
- 7.2. Market Analysis, Insights and Forecast - by Application Mode
- 7.2.1. Chemigation
- 7.2.2. Foliar
- 7.2.3. Fumigation
- 7.2.4. Seed Treatment
- 7.2.5. Soil Treatment
- 7.3. Market Analysis, Insights and Forecast - by Crop Type
- 7.3.1. Commercial Crops
- 7.3.2. Fruits & Vegetables
- 7.3.3. Grains & Cereals
- 7.3.4. Pulses & Oilseeds
- 7.3.5. Turf & Ornamental
- 7.4. Market Analysis, Insights and Forecast - by Function
- 7.4.1. Fungicide
- 7.4.2. Herbicide
- 7.4.3. Insecticide
- 7.4.4. Molluscicide
- 7.4.5. Nematicide
- 7.5. Market Analysis, Insights and Forecast - by Application Mode
- 7.5.1. Chemigation
- 7.5.2. Foliar
- 7.5.3. Fumigation
- 7.5.4. Seed Treatment
- 7.5.5. Soil Treatment
- 7.6. Market Analysis, Insights and Forecast - by Crop Type
- 7.6.1. Commercial Crops
- 7.6.2. Fruits & Vegetables
- 7.6.3. Grains & Cereals
- 7.6.4. Pulses & Oilseeds
- 7.6.5. Turf & Ornamental
- 7.1. Market Analysis, Insights and Forecast - by Function
- 8. South America Crop Protection Industry Analysis, Insights and Forecast, 2020-2032
- 8.1. Market Analysis, Insights and Forecast - by Function
- 8.1.1. Fungicide
- 8.1.2. Herbicide
- 8.1.3. Insecticide
- 8.1.4. Molluscicide
- 8.1.5. Nematicide
- 8.2. Market Analysis, Insights and Forecast - by Application Mode
- 8.2.1. Chemigation
- 8.2.2. Foliar
- 8.2.3. Fumigation
- 8.2.4. Seed Treatment
- 8.2.5. Soil Treatment
- 8.3. Market Analysis, Insights and Forecast - by Crop Type
- 8.3.1. Commercial Crops
- 8.3.2. Fruits & Vegetables
- 8.3.3. Grains & Cereals
- 8.3.4. Pulses & Oilseeds
- 8.3.5. Turf & Ornamental
- 8.4. Market Analysis, Insights and Forecast - by Function
- 8.4.1. Fungicide
- 8.4.2. Herbicide
- 8.4.3. Insecticide
- 8.4.4. Molluscicide
- 8.4.5. Nematicide
- 8.5. Market Analysis, Insights and Forecast - by Application Mode
- 8.5.1. Chemigation
- 8.5.2. Foliar
- 8.5.3. Fumigation
- 8.5.4. Seed Treatment
- 8.5.5. Soil Treatment
- 8.6. Market Analysis, Insights and Forecast - by Crop Type
- 8.6.1. Commercial Crops
- 8.6.2. Fruits & Vegetables
- 8.6.3. Grains & Cereals
- 8.6.4. Pulses & Oilseeds
- 8.6.5. Turf & Ornamental
- 8.1. Market Analysis, Insights and Forecast - by Function
- 9. Europe Crop Protection Industry Analysis, Insights and Forecast, 2020-2032
- 9.1. Market Analysis, Insights and Forecast - by Function
- 9.1.1. Fungicide
- 9.1.2. Herbicide
- 9.1.3. Insecticide
- 9.1.4. Molluscicide
- 9.1.5. Nematicide
- 9.2. Market Analysis, Insights and Forecast - by Application Mode
- 9.2.1. Chemigation
- 9.2.2. Foliar
- 9.2.3. Fumigation
- 9.2.4. Seed Treatment
- 9.2.5. Soil Treatment
- 9.3. Market Analysis, Insights and Forecast - by Crop Type
- 9.3.1. Commercial Crops
- 9.3.2. Fruits & Vegetables
- 9.3.3. Grains & Cereals
- 9.3.4. Pulses & Oilseeds
- 9.3.5. Turf & Ornamental
- 9.4. Market Analysis, Insights and Forecast - by Function
- 9.4.1. Fungicide
- 9.4.2. Herbicide
- 9.4.3. Insecticide
- 9.4.4. Molluscicide
- 9.4.5. Nematicide
- 9.5. Market Analysis, Insights and Forecast - by Application Mode
- 9.5.1. Chemigation
- 9.5.2. Foliar
- 9.5.3. Fumigation
- 9.5.4. Seed Treatment
- 9.5.5. Soil Treatment
- 9.6. Market Analysis, Insights and Forecast - by Crop Type
- 9.6.1. Commercial Crops
- 9.6.2. Fruits & Vegetables
- 9.6.3. Grains & Cereals
- 9.6.4. Pulses & Oilseeds
- 9.6.5. Turf & Ornamental
- 9.1. Market Analysis, Insights and Forecast - by Function
- 10. Middle East & Africa Crop Protection Industry Analysis, Insights and Forecast, 2020-2032
- 10.1. Market Analysis, Insights and Forecast - by Function
- 10.1.1. Fungicide
- 10.1.2. Herbicide
- 10.1.3. Insecticide
- 10.1.4. Molluscicide
- 10.1.5. Nematicide
- 10.2. Market Analysis, Insights and Forecast - by Application Mode
- 10.2.1. Chemigation
- 10.2.2. Foliar
- 10.2.3. Fumigation
- 10.2.4. Seed Treatment
- 10.2.5. Soil Treatment
- 10.3. Market Analysis, Insights and Forecast - by Crop Type
- 10.3.1. Commercial Crops
- 10.3.2. Fruits & Vegetables
- 10.3.3. Grains & Cereals
- 10.3.4. Pulses & Oilseeds
- 10.3.5. Turf & Ornamental
- 10.4. Market Analysis, Insights and Forecast - by Function
- 10.4.1. Fungicide
- 10.4.2. Herbicide
- 10.4.3. Insecticide
- 10.4.4. Molluscicide
- 10.4.5. Nematicide
- 10.5. Market Analysis, Insights and Forecast - by Application Mode
- 10.5.1. Chemigation
- 10.5.2. Foliar
- 10.5.3. Fumigation
- 10.5.4. Seed Treatment
- 10.5.5. Soil Treatment
- 10.6. Market Analysis, Insights and Forecast - by Crop Type
- 10.6.1. Commercial Crops
- 10.6.2. Fruits & Vegetables
- 10.6.3. Grains & Cereals
- 10.6.4. Pulses & Oilseeds
- 10.6.5. Turf & Ornamental
- 10.1. Market Analysis, Insights and Forecast - by Function
- 11. Asia Pacific Crop Protection Industry Analysis, Insights and Forecast, 2020-2032
- 11.1. Market Analysis, Insights and Forecast - by Function
- 11.1.1. Fungicide
- 11.1.2. Herbicide
- 11.1.3. Insecticide
- 11.1.4. Molluscicide
- 11.1.5. Nematicide
- 11.2. Market Analysis, Insights and Forecast - by Application Mode
- 11.2.1. Chemigation
- 11.2.2. Foliar
- 11.2.3. Fumigation
- 11.2.4. Seed Treatment
- 11.2.5. Soil Treatment
- 11.3. Market Analysis, Insights and Forecast - by Crop Type
- 11.3.1. Commercial Crops
- 11.3.2. Fruits & Vegetables
- 11.3.3. Grains & Cereals
- 11.3.4. Pulses & Oilseeds
- 11.3.5. Turf & Ornamental
- 11.4. Market Analysis, Insights and Forecast - by Function
- 11.4.1. Fungicide
- 11.4.2. Herbicide
- 11.4.3. Insecticide
- 11.4.4. Molluscicide
- 11.4.5. Nematicide
- 11.5. Market Analysis, Insights and Forecast - by Application Mode
- 11.5.1. Chemigation
- 11.5.2. Foliar
- 11.5.3. Fumigation
- 11.5.4. Seed Treatment
- 11.5.5. Soil Treatment
- 11.6. Market Analysis, Insights and Forecast - by Crop Type
- 11.6.1. Commercial Crops
- 11.6.2. Fruits & Vegetables
- 11.6.3. Grains & Cereals
- 11.6.4. Pulses & Oilseeds
- 11.6.5. Turf & Ornamental
- 11.1. Market Analysis, Insights and Forecast - by Function
- 12. Competitive Analysis
- 12.1. Company Profiles
- 12.1.1 FMC Corporation
- 12.1.1.1. Company Overview
- 12.1.1.2. Products
- 12.1.1.3. Company Financials
- 12.1.1.4. SWOT Analysis
- 12.1.2 Sumitomo Chemical Co Ltd
- 12.1.2.1. Company Overview
- 12.1.2.2. Products
- 12.1.2.3. Company Financials
- 12.1.2.4. SWOT Analysis
- 12.1.3 ADAMA Agricultural Solutions Ltd
- 12.1.3.1. Company Overview
- 12.1.3.2. Products
- 12.1.3.3. Company Financials
- 12.1.3.4. SWOT Analysis
- 12.1.4 Bayer AG
- 12.1.4.1. Company Overview
- 12.1.4.2. Products
- 12.1.4.3. Company Financials
- 12.1.4.4. SWOT Analysis
- 12.1.5 UPL Limite
- 12.1.5.1. Company Overview
- 12.1.5.2. Products
- 12.1.5.3. Company Financials
- 12.1.5.4. SWOT Analysis
- 12.1.6 Syngenta Group
- 12.1.6.1. Company Overview
- 12.1.6.2. Products
- 12.1.6.3. Company Financials
- 12.1.6.4. SWOT Analysis
- 12.1.7 Jiangsu Yangnong Chemical Co Ltd
- 12.1.7.1. Company Overview
- 12.1.7.2. Products
- 12.1.7.3. Company Financials
- 12.1.7.4. SWOT Analysis
- 12.1.8 Corteva Agriscience
- 12.1.8.1. Company Overview
- 12.1.8.2. Products
- 12.1.8.3. Company Financials
- 12.1.8.4. SWOT Analysis
- 12.1.9 Nufarm Ltd
- 12.1.9.1. Company Overview
- 12.1.9.2. Products
- 12.1.9.3. Company Financials
- 12.1.9.4. SWOT Analysis
- 12.1.10 BASF SE
- 12.1.10.1. Company Overview
- 12.1.10.2. Products
- 12.1.10.3. Company Financials
- 12.1.10.4. SWOT Analysis
- 12.1.1 FMC Corporation
- 12.2. Market Entropy
- 12.2.1 Company's Key Areas Served
- 12.2.2 Recent Developments
- 12.3. Company Market Share Analysis 2025
- 12.3.1 Top 5 Companies Market Share Analysis
- 12.3.2 Top 3 Companies Market Share Analysis
- 12.4. List of Potential Customers
- 13. Research Methodology
List of Figures
- Figure 1: Global Crop Protection Industry Revenue Breakdown (Million, %) by Region 2025 & 2033
- Figure 2: Global Crop Protection Industry Volume Breakdown (kilotons, %) by Region 2025 & 2033
- Figure 3: North America Crop Protection Industry Revenue (Million), by Function 2025 & 2033
- Figure 4: North America Crop Protection Industry Volume (kilotons), by Function 2025 & 2033
- Figure 5: North America Crop Protection Industry Revenue Share (%), by Function 2025 & 2033
- Figure 6: North America Crop Protection Industry Volume Share (%), by Function 2025 & 2033
- Figure 7: North America Crop Protection Industry Revenue (Million), by Application Mode 2025 & 2033
- Figure 8: North America Crop Protection Industry Volume (kilotons), by Application Mode 2025 & 2033
- Figure 9: North America Crop Protection Industry Revenue Share (%), by Application Mode 2025 & 2033
- Figure 10: North America Crop Protection Industry Volume Share (%), by Application Mode 2025 & 2033
- Figure 11: North America Crop Protection Industry Revenue (Million), by Crop Type 2025 & 2033
- Figure 12: North America Crop Protection Industry Volume (kilotons), by Crop Type 2025 & 2033
- Figure 13: North America Crop Protection Industry Revenue Share (%), by Crop Type 2025 & 2033
- Figure 14: North America Crop Protection Industry Volume Share (%), by Crop Type 2025 & 2033
- Figure 15: North America Crop Protection Industry Revenue (Million), by Function 2025 & 2033
- Figure 16: North America Crop Protection Industry Volume (kilotons), by Function 2025 & 2033
- Figure 17: North America Crop Protection Industry Revenue Share (%), by Function 2025 & 2033
- Figure 18: North America Crop Protection Industry Volume Share (%), by Function 2025 & 2033
- Figure 19: North America Crop Protection Industry Revenue (Million), by Application Mode 2025 & 2033
- Figure 20: North America Crop Protection Industry Volume (kilotons), by Application Mode 2025 & 2033
- Figure 21: North America Crop Protection Industry Revenue Share (%), by Application Mode 2025 & 2033
- Figure 22: North America Crop Protection Industry Volume Share (%), by Application Mode 2025 & 2033
- Figure 23: North America Crop Protection Industry Revenue (Million), by Crop Type 2025 & 2033
- Figure 24: North America Crop Protection Industry Volume (kilotons), by Crop Type 2025 & 2033
- Figure 25: North America Crop Protection Industry Revenue Share (%), by Crop Type 2025 & 2033
- Figure 26: North America Crop Protection Industry Volume Share (%), by Crop Type 2025 & 2033
- Figure 27: North America Crop Protection Industry Revenue (Million), by Country 2025 & 2033
- Figure 28: North America Crop Protection Industry Volume (kilotons), by Country 2025 & 2033
- Figure 29: North America Crop Protection Industry Revenue Share (%), by Country 2025 & 2033
- Figure 30: North America Crop Protection Industry Volume Share (%), by Country 2025 & 2033
- Figure 31: South America Crop Protection Industry Revenue (Million), by Function 2025 & 2033
- Figure 32: South America Crop Protection Industry Volume (kilotons), by Function 2025 & 2033
- Figure 33: South America Crop Protection Industry Revenue Share (%), by Function 2025 & 2033
- Figure 34: South America Crop Protection Industry Volume Share (%), by Function 2025 & 2033
- Figure 35: South America Crop Protection Industry Revenue (Million), by Application Mode 2025 & 2033
- Figure 36: South America Crop Protection Industry Volume (kilotons), by Application Mode 2025 & 2033
- Figure 37: South America Crop Protection Industry Revenue Share (%), by Application Mode 2025 & 2033
- Figure 38: South America Crop Protection Industry Volume Share (%), by Application Mode 2025 & 2033
- Figure 39: South America Crop Protection Industry Revenue (Million), by Crop Type 2025 & 2033
- Figure 40: South America Crop Protection Industry Volume (kilotons), by Crop Type 2025 & 2033
- Figure 41: South America Crop Protection Industry Revenue Share (%), by Crop Type 2025 & 2033
- Figure 42: South America Crop Protection Industry Volume Share (%), by Crop Type 2025 & 2033
- Figure 43: South America Crop Protection Industry Revenue (Million), by Function 2025 & 2033
- Figure 44: South America Crop Protection Industry Volume (kilotons), by Function 2025 & 2033
- Figure 45: South America Crop Protection Industry Revenue Share (%), by Function 2025 & 2033
- Figure 46: South America Crop Protection Industry Volume Share (%), by Function 2025 & 2033
- Figure 47: South America Crop Protection Industry Revenue (Million), by Application Mode 2025 & 2033
- Figure 48: South America Crop Protection Industry Volume (kilotons), by Application Mode 2025 & 2033
- Figure 49: South America Crop Protection Industry Revenue Share (%), by Application Mode 2025 & 2033
- Figure 50: South America Crop Protection Industry Volume Share (%), by Application Mode 2025 & 2033
- Figure 51: South America Crop Protection Industry Revenue (Million), by Crop Type 2025 & 2033
- Figure 52: South America Crop Protection Industry Volume (kilotons), by Crop Type 2025 & 2033
- Figure 53: South America Crop Protection Industry Revenue Share (%), by Crop Type 2025 & 2033
- Figure 54: South America Crop Protection Industry Volume Share (%), by Crop Type 2025 & 2033
- Figure 55: South America Crop Protection Industry Revenue (Million), by Country 2025 & 2033
- Figure 56: South America Crop Protection Industry Volume (kilotons), by Country 2025 & 2033
- Figure 57: South America Crop Protection Industry Revenue Share (%), by Country 2025 & 2033
- Figure 58: South America Crop Protection Industry Volume Share (%), by Country 2025 & 2033
- Figure 59: Europe Crop Protection Industry Revenue (Million), by Function 2025 & 2033
- Figure 60: Europe Crop Protection Industry Volume (kilotons), by Function 2025 & 2033
- Figure 61: Europe Crop Protection Industry Revenue Share (%), by Function 2025 & 2033
- Figure 62: Europe Crop Protection Industry Volume Share (%), by Function 2025 & 2033
- Figure 63: Europe Crop Protection Industry Revenue (Million), by Application Mode 2025 & 2033
- Figure 64: Europe Crop Protection Industry Volume (kilotons), by Application Mode 2025 & 2033
- Figure 65: Europe Crop Protection Industry Revenue Share (%), by Application Mode 2025 & 2033
- Figure 66: Europe Crop Protection Industry Volume Share (%), by Application Mode 2025 & 2033
- Figure 67: Europe Crop Protection Industry Revenue (Million), by Crop Type 2025 & 2033
- Figure 68: Europe Crop Protection Industry Volume (kilotons), by Crop Type 2025 & 2033
- Figure 69: Europe Crop Protection Industry Revenue Share (%), by Crop Type 2025 & 2033
- Figure 70: Europe Crop Protection Industry Volume Share (%), by Crop Type 2025 & 2033
- Figure 71: Europe Crop Protection Industry Revenue (Million), by Function 2025 & 2033
- Figure 72: Europe Crop Protection Industry Volume (kilotons), by Function 2025 & 2033
- Figure 73: Europe Crop Protection Industry Revenue Share (%), by Function 2025 & 2033
- Figure 74: Europe Crop Protection Industry Volume Share (%), by Function 2025 & 2033
- Figure 75: Europe Crop Protection Industry Revenue (Million), by Application Mode 2025 & 2033
- Figure 76: Europe Crop Protection Industry Volume (kilotons), by Application Mode 2025 & 2033
- Figure 77: Europe Crop Protection Industry Revenue Share (%), by Application Mode 2025 & 2033
- Figure 78: Europe Crop Protection Industry Volume Share (%), by Application Mode 2025 & 2033
- Figure 79: Europe Crop Protection Industry Revenue (Million), by Crop Type 2025 & 2033
- Figure 80: Europe Crop Protection Industry Volume (kilotons), by Crop Type 2025 & 2033
- Figure 81: Europe Crop Protection Industry Revenue Share (%), by Crop Type 2025 & 2033
- Figure 82: Europe Crop Protection Industry Volume Share (%), by Crop Type 2025 & 2033
- Figure 83: Europe Crop Protection Industry Revenue (Million), by Country 2025 & 2033
- Figure 84: Europe Crop Protection Industry Volume (kilotons), by Country 2025 & 2033
- Figure 85: Europe Crop Protection Industry Revenue Share (%), by Country 2025 & 2033
- Figure 86: Europe Crop Protection Industry Volume Share (%), by Country 2025 & 2033
- Figure 87: Middle East & Africa Crop Protection Industry Revenue (Million), by Function 2025 & 2033
- Figure 88: Middle East & Africa Crop Protection Industry Volume (kilotons), by Function 2025 & 2033
- Figure 89: Middle East & Africa Crop Protection Industry Revenue Share (%), by Function 2025 & 2033
- Figure 90: Middle East & Africa Crop Protection Industry Volume Share (%), by Function 2025 & 2033
- Figure 91: Middle East & Africa Crop Protection Industry Revenue (Million), by Application Mode 2025 & 2033
- Figure 92: Middle East & Africa Crop Protection Industry Volume (kilotons), by Application Mode 2025 & 2033
- Figure 93: Middle East & Africa Crop Protection Industry Revenue Share (%), by Application Mode 2025 & 2033
- Figure 94: Middle East & Africa Crop Protection Industry Volume Share (%), by Application Mode 2025 & 2033
- Figure 95: Middle East & Africa Crop Protection Industry Revenue (Million), by Crop Type 2025 & 2033
- Figure 96: Middle East & Africa Crop Protection Industry Volume (kilotons), by Crop Type 2025 & 2033
- Figure 97: Middle East & Africa Crop Protection Industry Revenue Share (%), by Crop Type 2025 & 2033
- Figure 98: Middle East & Africa Crop Protection Industry Volume Share (%), by Crop Type 2025 & 2033
- Figure 99: Middle East & Africa Crop Protection Industry Revenue (Million), by Function 2025 & 2033
- Figure 100: Middle East & Africa Crop Protection Industry Volume (kilotons), by Function 2025 & 2033
- Figure 101: Middle East & Africa Crop Protection Industry Revenue Share (%), by Function 2025 & 2033
- Figure 102: Middle East & Africa Crop Protection Industry Volume Share (%), by Function 2025 & 2033
- Figure 103: Middle East & Africa Crop Protection Industry Revenue (Million), by Application Mode 2025 & 2033
- Figure 104: Middle East & Africa Crop Protection Industry Volume (kilotons), by Application Mode 2025 & 2033
- Figure 105: Middle East & Africa Crop Protection Industry Revenue Share (%), by Application Mode 2025 & 2033
- Figure 106: Middle East & Africa Crop Protection Industry Volume Share (%), by Application Mode 2025 & 2033
- Figure 107: Middle East & Africa Crop Protection Industry Revenue (Million), by Crop Type 2025 & 2033
- Figure 108: Middle East & Africa Crop Protection Industry Volume (kilotons), by Crop Type 2025 & 2033
- Figure 109: Middle East & Africa Crop Protection Industry Revenue Share (%), by Crop Type 2025 & 2033
- Figure 110: Middle East & Africa Crop Protection Industry Volume Share (%), by Crop Type 2025 & 2033
- Figure 111: Middle East & Africa Crop Protection Industry Revenue (Million), by Country 2025 & 2033
- Figure 112: Middle East & Africa Crop Protection Industry Volume (kilotons), by Country 2025 & 2033
- Figure 113: Middle East & Africa Crop Protection Industry Revenue Share (%), by Country 2025 & 2033
- Figure 114: Middle East & Africa Crop Protection Industry Volume Share (%), by Country 2025 & 2033
- Figure 115: Asia Pacific Crop Protection Industry Revenue (Million), by Function 2025 & 2033
- Figure 116: Asia Pacific Crop Protection Industry Volume (kilotons), by Function 2025 & 2033
- Figure 117: Asia Pacific Crop Protection Industry Revenue Share (%), by Function 2025 & 2033
- Figure 118: Asia Pacific Crop Protection Industry Volume Share (%), by Function 2025 & 2033
- Figure 119: Asia Pacific Crop Protection Industry Revenue (Million), by Application Mode 2025 & 2033
- Figure 120: Asia Pacific Crop Protection Industry Volume (kilotons), by Application Mode 2025 & 2033
- Figure 121: Asia Pacific Crop Protection Industry Revenue Share (%), by Application Mode 2025 & 2033
- Figure 122: Asia Pacific Crop Protection Industry Volume Share (%), by Application Mode 2025 & 2033
- Figure 123: Asia Pacific Crop Protection Industry Revenue (Million), by Crop Type 2025 & 2033
- Figure 124: Asia Pacific Crop Protection Industry Volume (kilotons), by Crop Type 2025 & 2033
- Figure 125: Asia Pacific Crop Protection Industry Revenue Share (%), by Crop Type 2025 & 2033
- Figure 126: Asia Pacific Crop Protection Industry Volume Share (%), by Crop Type 2025 & 2033
- Figure 127: Asia Pacific Crop Protection Industry Revenue (Million), by Function 2025 & 2033
- Figure 128: Asia Pacific Crop Protection Industry Volume (kilotons), by Function 2025 & 2033
- Figure 129: Asia Pacific Crop Protection Industry Revenue Share (%), by Function 2025 & 2033
- Figure 130: Asia Pacific Crop Protection Industry Volume Share (%), by Function 2025 & 2033
- Figure 131: Asia Pacific Crop Protection Industry Revenue (Million), by Application Mode 2025 & 2033
- Figure 132: Asia Pacific Crop Protection Industry Volume (kilotons), by Application Mode 2025 & 2033
- Figure 133: Asia Pacific Crop Protection Industry Revenue Share (%), by Application Mode 2025 & 2033
- Figure 134: Asia Pacific Crop Protection Industry Volume Share (%), by Application Mode 2025 & 2033
- Figure 135: Asia Pacific Crop Protection Industry Revenue (Million), by Crop Type 2025 & 2033
- Figure 136: Asia Pacific Crop Protection Industry Volume (kilotons), by Crop Type 2025 & 2033
- Figure 137: Asia Pacific Crop Protection Industry Revenue Share (%), by Crop Type 2025 & 2033
- Figure 138: Asia Pacific Crop Protection Industry Volume Share (%), by Crop Type 2025 & 2033
- Figure 139: Asia Pacific Crop Protection Industry Revenue (Million), by Country 2025 & 2033
- Figure 140: Asia Pacific Crop Protection Industry Volume (kilotons), by Country 2025 & 2033
- Figure 141: Asia Pacific Crop Protection Industry Revenue Share (%), by Country 2025 & 2033
- Figure 142: Asia Pacific Crop Protection Industry Volume Share (%), by Country 2025 & 2033
List of Tables
- Table 1: Global Crop Protection Industry Revenue Million Forecast, by Function 2020 & 2033
- Table 2: Global Crop Protection Industry Volume kilotons Forecast, by Function 2020 & 2033
- Table 3: Global Crop Protection Industry Revenue Million Forecast, by Application Mode 2020 & 2033
- Table 4: Global Crop Protection Industry Volume kilotons Forecast, by Application Mode 2020 & 2033
- Table 5: Global Crop Protection Industry Revenue Million Forecast, by Crop Type 2020 & 2033
- Table 6: Global Crop Protection Industry Volume kilotons Forecast, by Crop Type 2020 & 2033
- Table 7: Global Crop Protection Industry Revenue Million Forecast, by Function 2020 & 2033
- Table 8: Global Crop Protection Industry Volume kilotons Forecast, by Function 2020 & 2033
- Table 9: Global Crop Protection Industry Revenue Million Forecast, by Application Mode 2020 & 2033
- Table 10: Global Crop Protection Industry Volume kilotons Forecast, by Application Mode 2020 & 2033
- Table 11: Global Crop Protection Industry Revenue Million Forecast, by Crop Type 2020 & 2033
- Table 12: Global Crop Protection Industry Volume kilotons Forecast, by Crop Type 2020 & 2033
- Table 13: Global Crop Protection Industry Revenue Million Forecast, by Region 2020 & 2033
- Table 14: Global Crop Protection Industry Volume kilotons Forecast, by Region 2020 & 2033
- Table 15: Global Crop Protection Industry Revenue Million Forecast, by Function 2020 & 2033
- Table 16: Global Crop Protection Industry Volume kilotons Forecast, by Function 2020 & 2033
- Table 17: Global Crop Protection Industry Revenue Million Forecast, by Application Mode 2020 & 2033
- Table 18: Global Crop Protection Industry Volume kilotons Forecast, by Application Mode 2020 & 2033
- Table 19: Global Crop Protection Industry Revenue Million Forecast, by Crop Type 2020 & 2033
- Table 20: Global Crop Protection Industry Volume kilotons Forecast, by Crop Type 2020 & 2033
- Table 21: Global Crop Protection Industry Revenue Million Forecast, by Function 2020 & 2033
- Table 22: Global Crop Protection Industry Volume kilotons Forecast, by Function 2020 & 2033
- Table 23: Global Crop Protection Industry Revenue Million Forecast, by Application Mode 2020 & 2033
- Table 24: Global Crop Protection Industry Volume kilotons Forecast, by Application Mode 2020 & 2033
- Table 25: Global Crop Protection Industry Revenue Million Forecast, by Crop Type 2020 & 2033
- Table 26: Global Crop Protection Industry Volume kilotons Forecast, by Crop Type 2020 & 2033
- Table 27: Global Crop Protection Industry Revenue Million Forecast, by Country 2020 & 2033
- Table 28: Global Crop Protection Industry Volume kilotons Forecast, by Country 2020 & 2033
- Table 29: United States Crop Protection Industry Revenue (Million) Forecast, by Application 2020 & 2033
- Table 30: United States Crop Protection Industry Volume (kilotons) Forecast, by Application 2020 & 2033
- Table 31: Canada Crop Protection Industry Revenue (Million) Forecast, by Application 2020 & 2033
- Table 32: Canada Crop Protection Industry Volume (kilotons) Forecast, by Application 2020 & 2033
- Table 33: Mexico Crop Protection Industry Revenue (Million) Forecast, by Application 2020 & 2033
- Table 34: Mexico Crop Protection Industry Volume (kilotons) Forecast, by Application 2020 & 2033
- Table 35: Global Crop Protection Industry Revenue Million Forecast, by Function 2020 & 2033
- Table 36: Global Crop Protection Industry Volume kilotons Forecast, by Function 2020 & 2033
- Table 37: Global Crop Protection Industry Revenue Million Forecast, by Application Mode 2020 & 2033
- Table 38: Global Crop Protection Industry Volume kilotons Forecast, by Application Mode 2020 & 2033
- Table 39: Global Crop Protection Industry Revenue Million Forecast, by Crop Type 2020 & 2033
- Table 40: Global Crop Protection Industry Volume kilotons Forecast, by Crop Type 2020 & 2033
- Table 41: Global Crop Protection Industry Revenue Million Forecast, by Function 2020 & 2033
- Table 42: Global Crop Protection Industry Volume kilotons Forecast, by Function 2020 & 2033
- Table 43: Global Crop Protection Industry Revenue Million Forecast, by Application Mode 2020 & 2033
- Table 44: Global Crop Protection Industry Volume kilotons Forecast, by Application Mode 2020 & 2033
- Table 45: Global Crop Protection Industry Revenue Million Forecast, by Crop Type 2020 & 2033
- Table 46: Global Crop Protection Industry Volume kilotons Forecast, by Crop Type 2020 & 2033
- Table 47: Global Crop Protection Industry Revenue Million Forecast, by Country 2020 & 2033
- Table 48: Global Crop Protection Industry Volume kilotons Forecast, by Country 2020 & 2033
- Table 49: Brazil Crop Protection Industry Revenue (Million) Forecast, by Application 2020 & 2033
- Table 50: Brazil Crop Protection Industry Volume (kilotons) Forecast, by Application 2020 & 2033
- Table 51: Argentina Crop Protection Industry Revenue (Million) Forecast, by Application 2020 & 2033
- Table 52: Argentina Crop Protection Industry Volume (kilotons) Forecast, by Application 2020 & 2033
- Table 53: Rest of South America Crop Protection Industry Revenue (Million) Forecast, by Application 2020 & 2033
- Table 54: Rest of South America Crop Protection Industry Volume (kilotons) Forecast, by Application 2020 & 2033
- Table 55: Global Crop Protection Industry Revenue Million Forecast, by Function 2020 & 2033
- Table 56: Global Crop Protection Industry Volume kilotons Forecast, by Function 2020 & 2033
- Table 57: Global Crop Protection Industry Revenue Million Forecast, by Application Mode 2020 & 2033
- Table 58: Global Crop Protection Industry Volume kilotons Forecast, by Application Mode 2020 & 2033
- Table 59: Global Crop Protection Industry Revenue Million Forecast, by Crop Type 2020 & 2033
- Table 60: Global Crop Protection Industry Volume kilotons Forecast, by Crop Type 2020 & 2033
- Table 61: Global Crop Protection Industry Revenue Million Forecast, by Function 2020 & 2033
- Table 62: Global Crop Protection Industry Volume kilotons Forecast, by Function 2020 & 2033
- Table 63: Global Crop Protection Industry Revenue Million Forecast, by Application Mode 2020 & 2033
- Table 64: Global Crop Protection Industry Volume kilotons Forecast, by Application Mode 2020 & 2033
- Table 65: Global Crop Protection Industry Revenue Million Forecast, by Crop Type 2020 & 2033
- Table 66: Global Crop Protection Industry Volume kilotons Forecast, by Crop Type 2020 & 2033
- Table 67: Global Crop Protection Industry Revenue Million Forecast, by Country 2020 & 2033
- Table 68: Global Crop Protection Industry Volume kilotons Forecast, by Country 2020 & 2033
- Table 69: United Kingdom Crop Protection Industry Revenue (Million) Forecast, by Application 2020 & 2033
- Table 70: United Kingdom Crop Protection Industry Volume (kilotons) Forecast, by Application 2020 & 2033
- Table 71: Germany Crop Protection Industry Revenue (Million) Forecast, by Application 2020 & 2033
- Table 72: Germany Crop Protection Industry Volume (kilotons) Forecast, by Application 2020 & 2033
- Table 73: France Crop Protection Industry Revenue (Million) Forecast, by Application 2020 & 2033
- Table 74: France Crop Protection Industry Volume (kilotons) Forecast, by Application 2020 & 2033
- Table 75: Italy Crop Protection Industry Revenue (Million) Forecast, by Application 2020 & 2033
- Table 76: Italy Crop Protection Industry Volume (kilotons) Forecast, by Application 2020 & 2033
- Table 77: Spain Crop Protection Industry Revenue (Million) Forecast, by Application 2020 & 2033
- Table 78: Spain Crop Protection Industry Volume (kilotons) Forecast, by Application 2020 & 2033
- Table 79: Russia Crop Protection Industry Revenue (Million) Forecast, by Application 2020 & 2033
- Table 80: Russia Crop Protection Industry Volume (kilotons) Forecast, by Application 2020 & 2033
- Table 81: Benelux Crop Protection Industry Revenue (Million) Forecast, by Application 2020 & 2033
- Table 82: Benelux Crop Protection Industry Volume (kilotons) Forecast, by Application 2020 & 2033
- Table 83: Nordics Crop Protection Industry Revenue (Million) Forecast, by Application 2020 & 2033
- Table 84: Nordics Crop Protection Industry Volume (kilotons) Forecast, by Application 2020 & 2033
- Table 85: Rest of Europe Crop Protection Industry Revenue (Million) Forecast, by Application 2020 & 2033
- Table 86: Rest of Europe Crop Protection Industry Volume (kilotons) Forecast, by Application 2020 & 2033
- Table 87: Global Crop Protection Industry Revenue Million Forecast, by Function 2020 & 2033
- Table 88: Global Crop Protection Industry Volume kilotons Forecast, by Function 2020 & 2033
- Table 89: Global Crop Protection Industry Revenue Million Forecast, by Application Mode 2020 & 2033
- Table 90: Global Crop Protection Industry Volume kilotons Forecast, by Application Mode 2020 & 2033
- Table 91: Global Crop Protection Industry Revenue Million Forecast, by Crop Type 2020 & 2033
- Table 92: Global Crop Protection Industry Volume kilotons Forecast, by Crop Type 2020 & 2033
- Table 93: Global Crop Protection Industry Revenue Million Forecast, by Function 2020 & 2033
- Table 94: Global Crop Protection Industry Volume kilotons Forecast, by Function 2020 & 2033
- Table 95: Global Crop Protection Industry Revenue Million Forecast, by Application Mode 2020 & 2033
- Table 96: Global Crop Protection Industry Volume kilotons Forecast, by Application Mode 2020 & 2033
- Table 97: Global Crop Protection Industry Revenue Million Forecast, by Crop Type 2020 & 2033
- Table 98: Global Crop Protection Industry Volume kilotons Forecast, by Crop Type 2020 & 2033
- Table 99: Global Crop Protection Industry Revenue Million Forecast, by Country 2020 & 2033
- Table 100: Global Crop Protection Industry Volume kilotons Forecast, by Country 2020 & 2033
- Table 101: Turkey Crop Protection Industry Revenue (Million) Forecast, by Application 2020 & 2033
- Table 102: Turkey Crop Protection Industry Volume (kilotons) Forecast, by Application 2020 & 2033
- Table 103: Israel Crop Protection Industry Revenue (Million) Forecast, by Application 2020 & 2033
- Table 104: Israel Crop Protection Industry Volume (kilotons) Forecast, by Application 2020 & 2033
- Table 105: GCC Crop Protection Industry Revenue (Million) Forecast, by Application 2020 & 2033
- Table 106: GCC Crop Protection Industry Volume (kilotons) Forecast, by Application 2020 & 2033
- Table 107: North Africa Crop Protection Industry Revenue (Million) Forecast, by Application 2020 & 2033
- Table 108: North Africa Crop Protection Industry Volume (kilotons) Forecast, by Application 2020 & 2033
- Table 109: South Africa Crop Protection Industry Revenue (Million) Forecast, by Application 2020 & 2033
- Table 110: South Africa Crop Protection Industry Volume (kilotons) Forecast, by Application 2020 & 2033
- Table 111: Rest of Middle East & Africa Crop Protection Industry Revenue (Million) Forecast, by Application 2020 & 2033
- Table 112: Rest of Middle East & Africa Crop Protection Industry Volume (kilotons) Forecast, by Application 2020 & 2033
- Table 113: Global Crop Protection Industry Revenue Million Forecast, by Function 2020 & 2033
- Table 114: Global Crop Protection Industry Volume kilotons Forecast, by Function 2020 & 2033
- Table 115: Global Crop Protection Industry Revenue Million Forecast, by Application Mode 2020 & 2033
- Table 116: Global Crop Protection Industry Volume kilotons Forecast, by Application Mode 2020 & 2033
- Table 117: Global Crop Protection Industry Revenue Million Forecast, by Crop Type 2020 & 2033
- Table 118: Global Crop Protection Industry Volume kilotons Forecast, by Crop Type 2020 & 2033
- Table 119: Global Crop Protection Industry Revenue Million Forecast, by Function 2020 & 2033
- Table 120: Global Crop Protection Industry Volume kilotons Forecast, by Function 2020 & 2033
- Table 121: Global Crop Protection Industry Revenue Million Forecast, by Application Mode 2020 & 2033
- Table 122: Global Crop Protection Industry Volume kilotons Forecast, by Application Mode 2020 & 2033
- Table 123: Global Crop Protection Industry Revenue Million Forecast, by Crop Type 2020 & 2033
- Table 124: Global Crop Protection Industry Volume kilotons Forecast, by Crop Type 2020 & 2033
- Table 125: Global Crop Protection Industry Revenue Million Forecast, by Country 2020 & 2033
- Table 126: Global Crop Protection Industry Volume kilotons Forecast, by Country 2020 & 2033
- Table 127: China Crop Protection Industry Revenue (Million) Forecast, by Application 2020 & 2033
- Table 128: China Crop Protection Industry Volume (kilotons) Forecast, by Application 2020 & 2033
- Table 129: India Crop Protection Industry Revenue (Million) Forecast, by Application 2020 & 2033
- Table 130: India Crop Protection Industry Volume (kilotons) Forecast, by Application 2020 & 2033
- Table 131: Japan Crop Protection Industry Revenue (Million) Forecast, by Application 2020 & 2033
- Table 132: Japan Crop Protection Industry Volume (kilotons) Forecast, by Application 2020 & 2033
- Table 133: South Korea Crop Protection Industry Revenue (Million) Forecast, by Application 2020 & 2033
- Table 134: South Korea Crop Protection Industry Volume (kilotons) Forecast, by Application 2020 & 2033
- Table 135: ASEAN Crop Protection Industry Revenue (Million) Forecast, by Application 2020 & 2033
- Table 136: ASEAN Crop Protection Industry Volume (kilotons) Forecast, by Application 2020 & 2033
- Table 137: Oceania Crop Protection Industry Revenue (Million) Forecast, by Application 2020 & 2033
- Table 138: Oceania Crop Protection Industry Volume (kilotons) Forecast, by Application 2020 & 2033
- Table 139: Rest of Asia Pacific Crop Protection Industry Revenue (Million) Forecast, by Application 2020 & 2033
- Table 140: Rest of Asia Pacific Crop Protection Industry Volume (kilotons) Forecast, by Application 2020 & 2033
Frequently Asked Questions
1. What is the projected Compound Annual Growth Rate (CAGR) of the Crop Protection Industry?
The projected CAGR is approximately 5.60%.
2. Which companies are prominent players in the Crop Protection Industry?
Key companies in the market include FMC Corporation, Sumitomo Chemical Co Ltd, ADAMA Agricultural Solutions Ltd, Bayer AG, UPL Limite, Syngenta Group, Jiangsu Yangnong Chemical Co Ltd, Corteva Agriscience, Nufarm Ltd, BASF SE.
3. What are the main segments of the Crop Protection Industry?
The market segments include Function, Application Mode, Crop Type, Function, Application Mode, Crop Type.
4. Can you provide details about the market size?
The market size is estimated to be USD XX Million as of 2022.
5. What are some drivers contributing to market growth?
Seed Treatment As A Solution To Enhance Yield; Growing Awareness For Seed Treatment Among The Farmers; Rising Trend Of Organic Farming.
6. What are the notable trends driving market growth?
OTHER KEY INDUSTRY TRENDS COVERED IN THE REPORT.
7. Are there any restraints impacting market growth?
Limitations Across Farm-Level Seed Treatment; Rising Environmental Concerns.
8. Can you provide examples of recent developments in the market?
December 2023: ADAMA introduced its most advanced cross-spectrum herbicide called Kampai for the grain business. The new product provides the broadest application window for broadleaf and narrow-leaf weed control for cereal crops.July 2023: ADAMA introduced new products, Davai A Plus and Clearfield Broad-Spectrum Herbicide Solutions, for imidazolinone-tolerant legumes like lentils, peas, and soybeans.April 2023: Nufarm launched a new liquid formulation fungicide, Tourney EZ, exclusively for turf and ornamental crops based on customer demand, which further strengthens the company's role in turf and ornamental crop protection.
9. What pricing options are available for accessing the report?
Pricing options include single-user, multi-user, and enterprise licenses priced at USD 3800, USD 4500, and USD 5800 respectively.
10. Is the market size provided in terms of value or volume?
The market size is provided in terms of value, measured in Million and volume, measured in kilotons.
11. Are there any specific market keywords associated with the report?
Yes, the market keyword associated with the report is "Crop Protection Industry," which aids in identifying and referencing the specific market segment covered.
12. How do I determine which pricing option suits my needs best?
The pricing options vary based on user requirements and access needs. Individual users may opt for single-user licenses, while businesses requiring broader access may choose multi-user or enterprise licenses for cost-effective access to the report.
13. Are there any additional resources or data provided in the Crop Protection Industry report?
While the report offers comprehensive insights, it's advisable to review the specific contents or supplementary materials provided to ascertain if additional resources or data are available.
14. How can I stay updated on further developments or reports in the Crop Protection Industry?
To stay informed about further developments, trends, and reports in the Crop Protection Industry, consider subscribing to industry newsletters, following relevant companies and organizations, or regularly checking reputable industry news sources and publications.
Methodology
Step 1 - Identification of Relevant Samples Size from Population Database


Step 2 - Approaches for Defining Global Market Size (Value, Volume* & Price*)

Note*: In applicable scenarios
Step 3 - Data Sources
Primary Research
- Web Analytics
- Survey Reports
- Research Institute
- Latest Research Reports
- Opinion Leaders
Secondary Research
- Annual Reports
- White Paper
- Latest Press Release
- Industry Association
- Paid Database
- Investor Presentations

Step 4 - Data Triangulation
Involves using different sources of information in order to increase the validity of a study
These sources are likely to be stakeholders in a program - participants, other researchers, program staff, other community members, and so on.
Then we put all data in single framework & apply various statistical tools to find out the dynamic on the market.
During the analysis stage, feedback from the stakeholder groups would be compared to determine areas of agreement as well as areas of divergence