

Key Insights
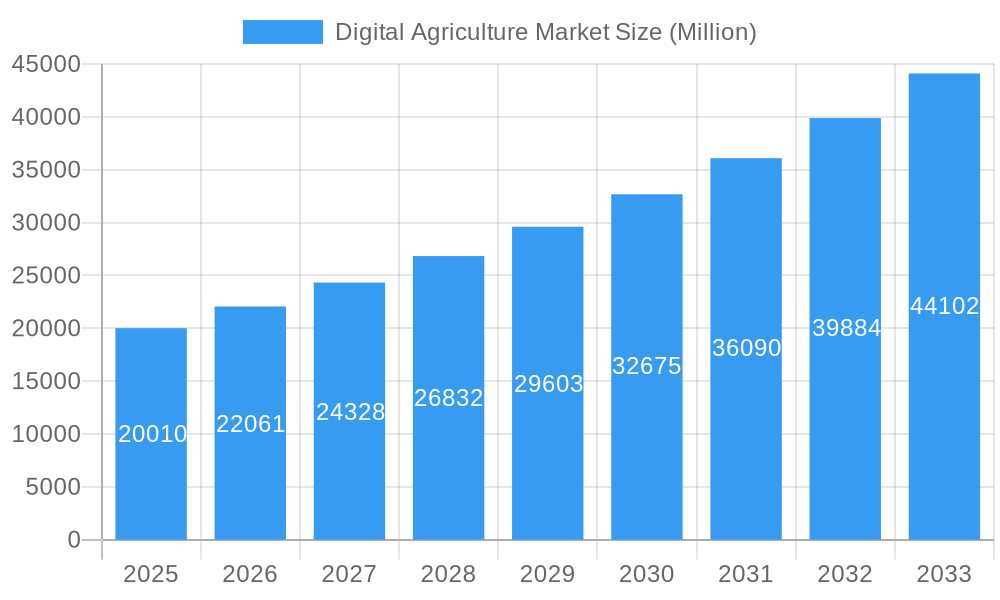
The Digital Agriculture market is experiencing robust growth, projected to reach $20.01 billion in 2025 and exhibiting a Compound Annual Growth Rate (CAGR) of 10.50%. This expansion is fueled by several key drivers. The increasing need for efficient resource management in agriculture, driven by growing populations and shrinking arable land, is a primary factor. Technological advancements in areas like artificial intelligence (AI), drone analytics, and variable rate technology are revolutionizing farming practices, enabling precision agriculture and optimized resource allocation. Furthermore, the rising adoption of precision farming techniques, coupled with supportive government initiatives promoting digitalization in the agricultural sector, is significantly boosting market growth. The market is segmented by application (crop monitoring, precision farming, other applications), technology (AI, drone analytics, variable rate technology, other solutions), and deployment (type and solution). Major players like AGCO Corporation, Microsoft, and Deere & Company are driving innovation and market penetration through their advanced solutions. The North American region currently holds a significant market share, but regions like Asia-Pacific are poised for rapid growth due to increasing investments in agricultural technology and the expansion of smart farming initiatives.
Digital Agriculture Market Market Size (In Billion)
The forecast period (2025-2033) suggests continued market expansion, with growth primarily driven by the increasing adoption of data-driven insights and predictive analytics for improved decision-making in agriculture. Challenges such as the high initial investment costs associated with implementing digital agriculture technologies and the need for robust internet connectivity in rural areas remain potential restraints. However, ongoing technological advancements leading to cost reductions and the increasing availability of high-speed internet are mitigating these limitations. The market’s future success hinges on continued innovation in software and hardware, the development of user-friendly interfaces, and effective strategies to address the digital literacy gap amongst farmers. The diverse range of solutions available caters to different farming scales and operational needs, ensuring widespread adoption across the agricultural landscape.
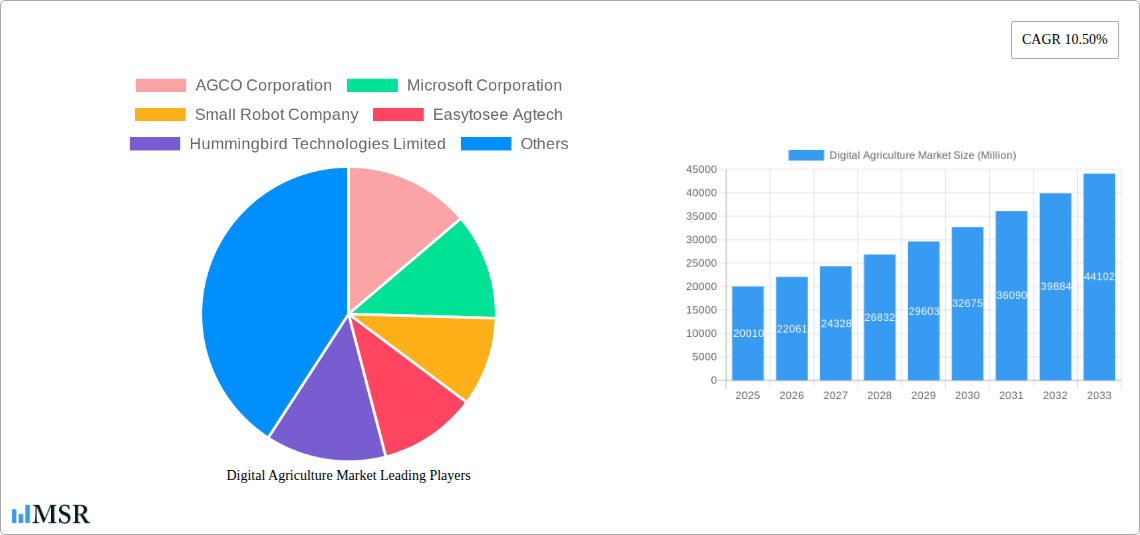
Digital Agriculture Market Company Market Share
Unlock the Potential of the Digital Agriculture Market: A Comprehensive Report (2019-2033)
This comprehensive report provides an in-depth analysis of the Digital Agriculture Market, offering actionable insights for stakeholders across the agricultural technology landscape. The study period spans 2019-2033, with a base year of 2025 and a forecast period of 2025-2033. Discover key trends, leading players, emerging opportunities, and challenges shaping the future of precision farming and sustainable agriculture. The market is projected to reach xx Million by 2033, exhibiting a CAGR of xx% during the forecast period.
Digital Agriculture Market Market Concentration & Dynamics
The Digital Agriculture market is characterized by a moderately concentrated landscape with several major players and a growing number of smaller, specialized companies. Key players like Deere & Company, AGCO Corporation, and John Deere hold significant market share, but the market is witnessing increasing competition from technology companies like Microsoft Corporation and IBM Corporation entering the sector. The innovation ecosystem is vibrant, fueled by substantial investments in R&D and collaborations between established players and agricultural technology startups. Regulatory frameworks, while evolving, are generally supportive of technological advancements aiming to enhance efficiency and sustainability in agriculture. Substitute products include traditional farming methods, but the increasing adoption of digital solutions driven by efficiency gains and improved yields diminishes their market share. End-user trends are towards data-driven decision-making, automation, and precision techniques. The market also experiences considerable M&A activity, with approximately xx M&A deals recorded during the historical period (2019-2024). Market share data reveals that the top 5 players collectively account for approximately xx% of the market in 2025.
- Market Concentration: Moderately concentrated, with increasing competition.
- Innovation Ecosystem: Vibrant, with significant R&D investment and collaborations.
- Regulatory Framework: Evolving but generally supportive of digital agriculture.
- Substitute Products: Traditional farming methods, declining in market share.
- End-User Trends: Data-driven decision-making, automation, precision farming.
- M&A Activity: Approximately xx deals during 2019-2024.
Digital Agriculture Market Industry Insights & Trends
The Digital Agriculture market is experiencing robust growth, driven by several factors. The increasing global population and growing demand for food are key drivers, necessitating enhanced agricultural efficiency and productivity. Technological disruptions, particularly in areas like Artificial Intelligence (AI), the Internet of Things (IoT), and cloud computing, are revolutionizing farming practices. Evolving consumer behaviors, including a greater awareness of food sustainability and traceability, are also pushing the demand for digital solutions that enhance transparency and minimize environmental impact. Market size reached xx Million in 2024 and is projected to reach xx Million in 2025. The market is expected to grow significantly in the coming years due to the rising adoption of precision farming techniques and the increasing use of data analytics in agriculture.
Key Markets & Segments Leading Digital Agriculture Market
North America currently holds the dominant position in the Digital Agriculture market, followed by Europe and Asia-Pacific. This dominance is attributed to factors such as high technology adoption rates, established agricultural infrastructure, and substantial investments in agricultural technology.
- Dominant Region: North America
- Other Applications: Type: Precision farming solutions are driving growth in this segment.
- Crop Monitoring: Technology: Remote sensing and IoT-based technologies are key growth drivers.
- Variable Rate Technology: Solution: Demand is increasing due to cost optimization and efficiency gains.
- Other Solutions: Application: Data analytics and farm management software are rapidly gaining popularity.
- Artificial Intelligence: Application: AI-powered solutions are enhancing decision-making and automation.
- Drone Analytics: Deployment: Drone technology is enabling efficient crop monitoring and assessment.
- Precision Farming: Application: Precision farming remains the core application driving market growth.
Drivers for North American Dominance:
- Advanced agricultural infrastructure
- High technology adoption rates
- Substantial investment in agricultural technology
- Supportive regulatory environment
- Strong presence of major technology and agricultural companies
Digital Agriculture Market Product Developments
Recent product innovations focus on integrating AI, machine learning, and IoT technologies into existing farming equipment and software. This leads to advancements like autonomous tractors, smart irrigation systems, and predictive analytics tools for crop management. These innovations offer farmers improved efficiency, reduced input costs, and enhanced yield predictability, giving companies a competitive edge in the market.
Challenges in the Digital Agriculture Market Market
Significant challenges include the high initial investment costs for digital agricultural technologies, which can be a barrier for smallholder farmers. Furthermore, data security concerns and the need for robust digital infrastructure in rural areas are also significant hurdles. The lack of skilled labor and the complexity of integrating various digital solutions within existing farming operations are additional challenges. These factors are estimated to restrain market growth by approximately xx% in the forecast period.
Forces Driving Digital Agriculture Market Growth
Several factors are driving market growth, including technological advancements in AI, IoT, and big data analytics. Government initiatives promoting sustainable agriculture and precision farming methods are also contributing significantly. Economic factors such as increasing food prices and a rising global population further fuel the demand for efficient and productive agricultural practices. These factors are projected to contribute approximately xx% to market growth annually.
Long-Term Growth Catalysts in Digital Agriculture Market
Long-term growth is fueled by continuous innovation in areas like robotics, automation, and vertical farming. Strategic partnerships between technology giants and agricultural companies are accelerating the development and adoption of cutting-edge solutions. Expanding into new markets, particularly in developing countries with growing agricultural sectors, is another key catalyst for future growth.
Emerging Opportunities in Digital Agriculture Market
Significant opportunities exist in developing affordable digital solutions targeted at smallholder farmers. The integration of blockchain technology to enhance transparency and traceability in the food supply chain offers promising prospects. The growing demand for sustainable and environmentally friendly agricultural practices creates opportunities for companies offering eco-friendly digital solutions.
Leading Players in the Digital Agriculture Market Sector
- AGCO Corporation
- Microsoft Corporation
- Small Robot Company
- Easytosee Agtech
- Hummingbird Technologies Limited
- DTN (CLEAR AG SOLUTIONS)
- Conservis Corporation
- Case IH Agriculture (CNH Industrial America LLC)
- Raven Industries
- Deere & Company
- IBM Corporation
- Topcon Positioning Systems
- Trimble Inc
- Gamaya SA
- AgEagle Aerial Systems Inc
- Bayer CropScience AG
Key Milestones in Digital Agriculture Market Industry
- 2020: Increased investment in agricultural technology startups.
- 2021: Launch of several AI-powered farm management platforms.
- 2022: Growing adoption of drone technology for crop monitoring.
- 2023: Strategic partnerships between tech giants and agricultural companies.
- 2024: Development of advanced precision farming solutions.
Strategic Outlook for Digital Agriculture Market Market
The future of the Digital Agriculture market is promising, with significant potential for growth driven by technological innovations and increasing global demand for food. Strategic opportunities exist for companies that focus on developing affordable, sustainable, and user-friendly digital solutions. Companies that successfully adapt to evolving market trends and collaborate with industry stakeholders will be well-positioned to capture substantial market share in the years to come.
Digital Agriculture Market Segmentation
- 1. Production Analysis
- 2. Consumption Analysis
- 3. Import Market Analysis (Value & Volume)
- 4. Export Market Analysis (Value & Volume)
- 5. Price Trend Analysis
Digital Agriculture Market Segmentation By Geography
-
1. North America
- 1.1. United States
- 1.2. Canada
- 1.3. Mexico
-
2. South America
- 2.1. Brazil
- 2.2. Argentina
- 2.3. Rest of South America
-
3. Europe
- 3.1. United Kingdom
- 3.2. Germany
- 3.3. France
- 3.4. Italy
- 3.5. Spain
- 3.6. Russia
- 3.7. Benelux
- 3.8. Nordics
- 3.9. Rest of Europe
-
4. Middle East & Africa
- 4.1. Turkey
- 4.2. Israel
- 4.3. GCC
- 4.4. North Africa
- 4.5. South Africa
- 4.6. Rest of Middle East & Africa
-
5. Asia Pacific
- 5.1. China
- 5.2. India
- 5.3. Japan
- 5.4. South Korea
- 5.5. ASEAN
- 5.6. Oceania
- 5.7. Rest of Asia Pacific
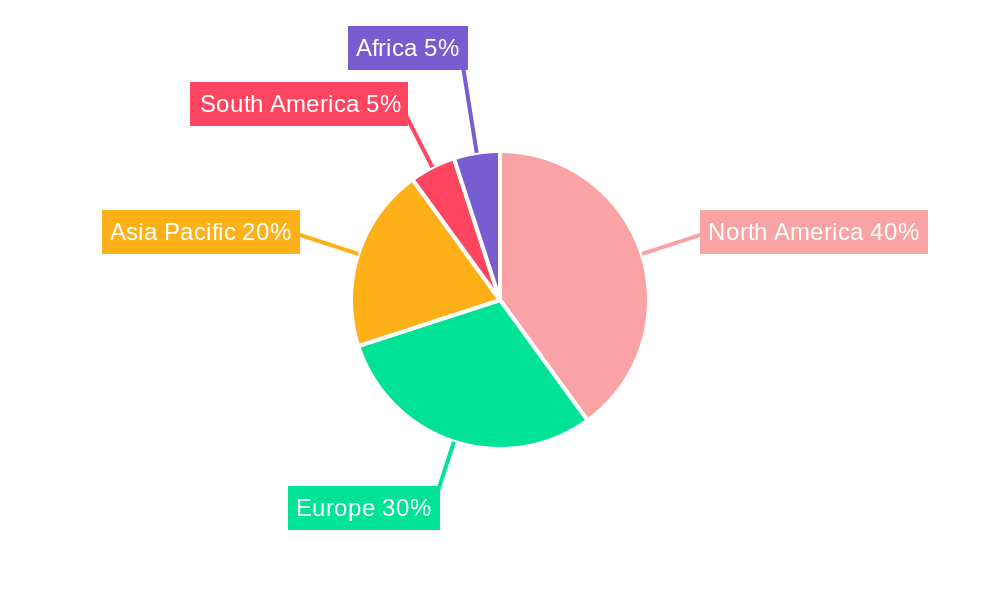
Digital Agriculture Market Regional Market Share
Geographic Coverage of Digital Agriculture Market
Digital Agriculture Market REPORT HIGHLIGHTS
| Aspects | Details |
|---|---|
| Study Period | 2020-2034 |
| Base Year | 2025 |
| Estimated Year | 2026 |
| Forecast Period | 2026-2034 |
| Historical Period | 2020-2025 |
| Growth Rate | CAGR of 10.50% from 2020-2034 |
| Segmentation |
|
Table of Contents
- 1. Introduction
- 1.1. Research Scope
- 1.2. Market Segmentation
- 1.3. Research Objective
- 1.4. Definitions and Assumptions
- 2. Executive Summary
- 2.1. Market Snapshot
- 3. Market Dynamics
- 3.1. Market Drivers
- 3.2. Market Restrains
- 3.3. Market Trends
- 3.4. Market Opportunities
- 4. Market Factor Analysis
- 4.1. Porters Five Forces
- 4.1.1. Bargaining Power of Suppliers
- 4.1.2. Bargaining Power of Buyers
- 4.1.3. Threat of New Entrants
- 4.1.4. Threat of Substitutes
- 4.1.5. Competitive Rivalry
- 4.2. PESTEL analysis
- 4.3. BCG Analysis
- 4.3.1. Stars (High Growth, High Market Share)
- 4.3.2. Cash Cows (Low Growth, High Market Share)
- 4.3.3. Question Mark (High Growth, Low Market Share)
- 4.3.4. Dogs (Low Growth, Low Market Share)
- 4.4. Ansoff Matrix Analysis
- 4.5. Supply Chain Analysis
- 4.6. Regulatory Landscape
- 4.7. Current Market Potential and Opportunity Assessment (TAM–SAM–SOM Framework)
- 4.8. MSR Analyst Note
- 4.1. Porters Five Forces
- 5. Market Analysis, Insights and Forecast 2021-2033
- 5.1. Market Analysis, Insights and Forecast - by Production Analysis
- 5.2. Market Analysis, Insights and Forecast - by Consumption Analysis
- 5.3. Market Analysis, Insights and Forecast - by Import Market Analysis (Value & Volume)
- 5.4. Market Analysis, Insights and Forecast - by Export Market Analysis (Value & Volume)
- 5.5. Market Analysis, Insights and Forecast - by Price Trend Analysis
- 5.6. Market Analysis, Insights and Forecast - by Region
- 5.6.1. North America
- 5.6.2. South America
- 5.6.3. Europe
- 5.6.4. Middle East & Africa
- 5.6.5. Asia Pacific
- 6. Global Digital Agriculture Market Analysis, Insights and Forecast, 2021-2033
- 6.1. Market Analysis, Insights and Forecast - by Production Analysis
- 6.2. Market Analysis, Insights and Forecast - by Consumption Analysis
- 6.3. Market Analysis, Insights and Forecast - by Import Market Analysis (Value & Volume)
- 6.4. Market Analysis, Insights and Forecast - by Export Market Analysis (Value & Volume)
- 6.5. Market Analysis, Insights and Forecast - by Price Trend Analysis
- 7. North America Digital Agriculture Market Analysis, Insights and Forecast, 2020-2032
- 7.1. Market Analysis, Insights and Forecast - by Production Analysis
- 7.2. Market Analysis, Insights and Forecast - by Consumption Analysis
- 7.3. Market Analysis, Insights and Forecast - by Import Market Analysis (Value & Volume)
- 7.4. Market Analysis, Insights and Forecast - by Export Market Analysis (Value & Volume)
- 7.5. Market Analysis, Insights and Forecast - by Price Trend Analysis
- 8. South America Digital Agriculture Market Analysis, Insights and Forecast, 2020-2032
- 8.1. Market Analysis, Insights and Forecast - by Production Analysis
- 8.2. Market Analysis, Insights and Forecast - by Consumption Analysis
- 8.3. Market Analysis, Insights and Forecast - by Import Market Analysis (Value & Volume)
- 8.4. Market Analysis, Insights and Forecast - by Export Market Analysis (Value & Volume)
- 8.5. Market Analysis, Insights and Forecast - by Price Trend Analysis
- 9. Europe Digital Agriculture Market Analysis, Insights and Forecast, 2020-2032
- 9.1. Market Analysis, Insights and Forecast - by Production Analysis
- 9.2. Market Analysis, Insights and Forecast - by Consumption Analysis
- 9.3. Market Analysis, Insights and Forecast - by Import Market Analysis (Value & Volume)
- 9.4. Market Analysis, Insights and Forecast - by Export Market Analysis (Value & Volume)
- 9.5. Market Analysis, Insights and Forecast - by Price Trend Analysis
- 10. Middle East & Africa Digital Agriculture Market Analysis, Insights and Forecast, 2020-2032
- 10.1. Market Analysis, Insights and Forecast - by Production Analysis
- 10.2. Market Analysis, Insights and Forecast - by Consumption Analysis
- 10.3. Market Analysis, Insights and Forecast - by Import Market Analysis (Value & Volume)
- 10.4. Market Analysis, Insights and Forecast - by Export Market Analysis (Value & Volume)
- 10.5. Market Analysis, Insights and Forecast - by Price Trend Analysis
- 11. Asia Pacific Digital Agriculture Market Analysis, Insights and Forecast, 2020-2032
- 11.1. Market Analysis, Insights and Forecast - by Production Analysis
- 11.2. Market Analysis, Insights and Forecast - by Consumption Analysis
- 11.3. Market Analysis, Insights and Forecast - by Import Market Analysis (Value & Volume)
- 11.4. Market Analysis, Insights and Forecast - by Export Market Analysis (Value & Volume)
- 11.5. Market Analysis, Insights and Forecast - by Price Trend Analysis
- 12. Competitive Analysis
- 12.1. Company Profiles
- 12.1.1 AGCO Corporation
- 12.1.1.1. Company Overview
- 12.1.1.2. Products
- 12.1.1.3. Company Financials
- 12.1.1.4. SWOT Analysis
- 12.1.2 Microsoft Corporation
- 12.1.2.1. Company Overview
- 12.1.2.2. Products
- 12.1.2.3. Company Financials
- 12.1.2.4. SWOT Analysis
- 12.1.3 Small Robot Company
- 12.1.3.1. Company Overview
- 12.1.3.2. Products
- 12.1.3.3. Company Financials
- 12.1.3.4. SWOT Analysis
- 12.1.4 Easytosee Agtech
- 12.1.4.1. Company Overview
- 12.1.4.2. Products
- 12.1.4.3. Company Financials
- 12.1.4.4. SWOT Analysis
- 12.1.5 Hummingbird Technologies Limited
- 12.1.5.1. Company Overview
- 12.1.5.2. Products
- 12.1.5.3. Company Financials
- 12.1.5.4. SWOT Analysis
- 12.1.6 DTN (CLEAR AG SOLUTIONS)
- 12.1.6.1. Company Overview
- 12.1.6.2. Products
- 12.1.6.3. Company Financials
- 12.1.6.4. SWOT Analysis
- 12.1.7 Conservis Corporation
- 12.1.7.1. Company Overview
- 12.1.7.2. Products
- 12.1.7.3. Company Financials
- 12.1.7.4. SWOT Analysis
- 12.1.8 Case IH Agriculture (CNH Industrial America LLC )
- 12.1.8.1. Company Overview
- 12.1.8.2. Products
- 12.1.8.3. Company Financials
- 12.1.8.4. SWOT Analysis
- 12.1.9 Raven Industries
- 12.1.9.1. Company Overview
- 12.1.9.2. Products
- 12.1.9.3. Company Financials
- 12.1.9.4. SWOT Analysis
- 12.1.10 Deere & Company
- 12.1.10.1. Company Overview
- 12.1.10.2. Products
- 12.1.10.3. Company Financials
- 12.1.10.4. SWOT Analysis
- 12.1.11 IBM Corporation
- 12.1.11.1. Company Overview
- 12.1.11.2. Products
- 12.1.11.3. Company Financials
- 12.1.11.4. SWOT Analysis
- 12.1.12 Topcon Positioning Systems
- 12.1.12.1. Company Overview
- 12.1.12.2. Products
- 12.1.12.3. Company Financials
- 12.1.12.4. SWOT Analysis
- 12.1.13 Trimble Inc
- 12.1.13.1. Company Overview
- 12.1.13.2. Products
- 12.1.13.3. Company Financials
- 12.1.13.4. SWOT Analysis
- 12.1.14 Gamaya SA
- 12.1.14.1. Company Overview
- 12.1.14.2. Products
- 12.1.14.3. Company Financials
- 12.1.14.4. SWOT Analysis
- 12.1.15 AgEagle Aerial Systems Inc
- 12.1.15.1. Company Overview
- 12.1.15.2. Products
- 12.1.15.3. Company Financials
- 12.1.15.4. SWOT Analysis
- 12.1.16 Bayer CropScience AG
- 12.1.16.1. Company Overview
- 12.1.16.2. Products
- 12.1.16.3. Company Financials
- 12.1.16.4. SWOT Analysis
- 12.1.1 AGCO Corporation
- 12.2. Market Entropy
- 12.2.1 Company's Key Areas Served
- 12.2.2 Recent Developments
- 12.3. Company Market Share Analysis 2025
- 12.3.1 Top 5 Companies Market Share Analysis
- 12.3.2 Top 3 Companies Market Share Analysis
- 12.4. List of Potential Customers
- 13. Research Methodology
List of Figures
- Figure 1: Global Digital Agriculture Market Revenue Breakdown (Million, %) by Region 2025 & 2033
- Figure 2: North America Digital Agriculture Market Revenue (Million), by Production Analysis 2025 & 2033
- Figure 3: North America Digital Agriculture Market Revenue Share (%), by Production Analysis 2025 & 2033
- Figure 4: North America Digital Agriculture Market Revenue (Million), by Consumption Analysis 2025 & 2033
- Figure 5: North America Digital Agriculture Market Revenue Share (%), by Consumption Analysis 2025 & 2033
- Figure 6: North America Digital Agriculture Market Revenue (Million), by Import Market Analysis (Value & Volume) 2025 & 2033
- Figure 7: North America Digital Agriculture Market Revenue Share (%), by Import Market Analysis (Value & Volume) 2025 & 2033
- Figure 8: North America Digital Agriculture Market Revenue (Million), by Export Market Analysis (Value & Volume) 2025 & 2033
- Figure 9: North America Digital Agriculture Market Revenue Share (%), by Export Market Analysis (Value & Volume) 2025 & 2033
- Figure 10: North America Digital Agriculture Market Revenue (Million), by Price Trend Analysis 2025 & 2033
- Figure 11: North America Digital Agriculture Market Revenue Share (%), by Price Trend Analysis 2025 & 2033
- Figure 12: North America Digital Agriculture Market Revenue (Million), by Country 2025 & 2033
- Figure 13: North America Digital Agriculture Market Revenue Share (%), by Country 2025 & 2033
- Figure 14: South America Digital Agriculture Market Revenue (Million), by Production Analysis 2025 & 2033
- Figure 15: South America Digital Agriculture Market Revenue Share (%), by Production Analysis 2025 & 2033
- Figure 16: South America Digital Agriculture Market Revenue (Million), by Consumption Analysis 2025 & 2033
- Figure 17: South America Digital Agriculture Market Revenue Share (%), by Consumption Analysis 2025 & 2033
- Figure 18: South America Digital Agriculture Market Revenue (Million), by Import Market Analysis (Value & Volume) 2025 & 2033
- Figure 19: South America Digital Agriculture Market Revenue Share (%), by Import Market Analysis (Value & Volume) 2025 & 2033
- Figure 20: South America Digital Agriculture Market Revenue (Million), by Export Market Analysis (Value & Volume) 2025 & 2033
- Figure 21: South America Digital Agriculture Market Revenue Share (%), by Export Market Analysis (Value & Volume) 2025 & 2033
- Figure 22: South America Digital Agriculture Market Revenue (Million), by Price Trend Analysis 2025 & 2033
- Figure 23: South America Digital Agriculture Market Revenue Share (%), by Price Trend Analysis 2025 & 2033
- Figure 24: South America Digital Agriculture Market Revenue (Million), by Country 2025 & 2033
- Figure 25: South America Digital Agriculture Market Revenue Share (%), by Country 2025 & 2033
- Figure 26: Europe Digital Agriculture Market Revenue (Million), by Production Analysis 2025 & 2033
- Figure 27: Europe Digital Agriculture Market Revenue Share (%), by Production Analysis 2025 & 2033
- Figure 28: Europe Digital Agriculture Market Revenue (Million), by Consumption Analysis 2025 & 2033
- Figure 29: Europe Digital Agriculture Market Revenue Share (%), by Consumption Analysis 2025 & 2033
- Figure 30: Europe Digital Agriculture Market Revenue (Million), by Import Market Analysis (Value & Volume) 2025 & 2033
- Figure 31: Europe Digital Agriculture Market Revenue Share (%), by Import Market Analysis (Value & Volume) 2025 & 2033
- Figure 32: Europe Digital Agriculture Market Revenue (Million), by Export Market Analysis (Value & Volume) 2025 & 2033
- Figure 33: Europe Digital Agriculture Market Revenue Share (%), by Export Market Analysis (Value & Volume) 2025 & 2033
- Figure 34: Europe Digital Agriculture Market Revenue (Million), by Price Trend Analysis 2025 & 2033
- Figure 35: Europe Digital Agriculture Market Revenue Share (%), by Price Trend Analysis 2025 & 2033
- Figure 36: Europe Digital Agriculture Market Revenue (Million), by Country 2025 & 2033
- Figure 37: Europe Digital Agriculture Market Revenue Share (%), by Country 2025 & 2033
- Figure 38: Middle East & Africa Digital Agriculture Market Revenue (Million), by Production Analysis 2025 & 2033
- Figure 39: Middle East & Africa Digital Agriculture Market Revenue Share (%), by Production Analysis 2025 & 2033
- Figure 40: Middle East & Africa Digital Agriculture Market Revenue (Million), by Consumption Analysis 2025 & 2033
- Figure 41: Middle East & Africa Digital Agriculture Market Revenue Share (%), by Consumption Analysis 2025 & 2033
- Figure 42: Middle East & Africa Digital Agriculture Market Revenue (Million), by Import Market Analysis (Value & Volume) 2025 & 2033
- Figure 43: Middle East & Africa Digital Agriculture Market Revenue Share (%), by Import Market Analysis (Value & Volume) 2025 & 2033
- Figure 44: Middle East & Africa Digital Agriculture Market Revenue (Million), by Export Market Analysis (Value & Volume) 2025 & 2033
- Figure 45: Middle East & Africa Digital Agriculture Market Revenue Share (%), by Export Market Analysis (Value & Volume) 2025 & 2033
- Figure 46: Middle East & Africa Digital Agriculture Market Revenue (Million), by Price Trend Analysis 2025 & 2033
- Figure 47: Middle East & Africa Digital Agriculture Market Revenue Share (%), by Price Trend Analysis 2025 & 2033
- Figure 48: Middle East & Africa Digital Agriculture Market Revenue (Million), by Country 2025 & 2033
- Figure 49: Middle East & Africa Digital Agriculture Market Revenue Share (%), by Country 2025 & 2033
- Figure 50: Asia Pacific Digital Agriculture Market Revenue (Million), by Production Analysis 2025 & 2033
- Figure 51: Asia Pacific Digital Agriculture Market Revenue Share (%), by Production Analysis 2025 & 2033
- Figure 52: Asia Pacific Digital Agriculture Market Revenue (Million), by Consumption Analysis 2025 & 2033
- Figure 53: Asia Pacific Digital Agriculture Market Revenue Share (%), by Consumption Analysis 2025 & 2033
- Figure 54: Asia Pacific Digital Agriculture Market Revenue (Million), by Import Market Analysis (Value & Volume) 2025 & 2033
- Figure 55: Asia Pacific Digital Agriculture Market Revenue Share (%), by Import Market Analysis (Value & Volume) 2025 & 2033
- Figure 56: Asia Pacific Digital Agriculture Market Revenue (Million), by Export Market Analysis (Value & Volume) 2025 & 2033
- Figure 57: Asia Pacific Digital Agriculture Market Revenue Share (%), by Export Market Analysis (Value & Volume) 2025 & 2033
- Figure 58: Asia Pacific Digital Agriculture Market Revenue (Million), by Price Trend Analysis 2025 & 2033
- Figure 59: Asia Pacific Digital Agriculture Market Revenue Share (%), by Price Trend Analysis 2025 & 2033
- Figure 60: Asia Pacific Digital Agriculture Market Revenue (Million), by Country 2025 & 2033
- Figure 61: Asia Pacific Digital Agriculture Market Revenue Share (%), by Country 2025 & 2033
List of Tables
- Table 1: Global Digital Agriculture Market Revenue Million Forecast, by Production Analysis 2020 & 2033
- Table 2: Global Digital Agriculture Market Revenue Million Forecast, by Consumption Analysis 2020 & 2033
- Table 3: Global Digital Agriculture Market Revenue Million Forecast, by Import Market Analysis (Value & Volume) 2020 & 2033
- Table 4: Global Digital Agriculture Market Revenue Million Forecast, by Export Market Analysis (Value & Volume) 2020 & 2033
- Table 5: Global Digital Agriculture Market Revenue Million Forecast, by Price Trend Analysis 2020 & 2033
- Table 6: Global Digital Agriculture Market Revenue Million Forecast, by Region 2020 & 2033
- Table 7: Global Digital Agriculture Market Revenue Million Forecast, by Production Analysis 2020 & 2033
- Table 8: Global Digital Agriculture Market Revenue Million Forecast, by Consumption Analysis 2020 & 2033
- Table 9: Global Digital Agriculture Market Revenue Million Forecast, by Import Market Analysis (Value & Volume) 2020 & 2033
- Table 10: Global Digital Agriculture Market Revenue Million Forecast, by Export Market Analysis (Value & Volume) 2020 & 2033
- Table 11: Global Digital Agriculture Market Revenue Million Forecast, by Price Trend Analysis 2020 & 2033
- Table 12: Global Digital Agriculture Market Revenue Million Forecast, by Country 2020 & 2033
- Table 13: United States Digital Agriculture Market Revenue (Million) Forecast, by Application 2020 & 2033
- Table 14: Canada Digital Agriculture Market Revenue (Million) Forecast, by Application 2020 & 2033
- Table 15: Mexico Digital Agriculture Market Revenue (Million) Forecast, by Application 2020 & 2033
- Table 16: Global Digital Agriculture Market Revenue Million Forecast, by Production Analysis 2020 & 2033
- Table 17: Global Digital Agriculture Market Revenue Million Forecast, by Consumption Analysis 2020 & 2033
- Table 18: Global Digital Agriculture Market Revenue Million Forecast, by Import Market Analysis (Value & Volume) 2020 & 2033
- Table 19: Global Digital Agriculture Market Revenue Million Forecast, by Export Market Analysis (Value & Volume) 2020 & 2033
- Table 20: Global Digital Agriculture Market Revenue Million Forecast, by Price Trend Analysis 2020 & 2033
- Table 21: Global Digital Agriculture Market Revenue Million Forecast, by Country 2020 & 2033
- Table 22: Brazil Digital Agriculture Market Revenue (Million) Forecast, by Application 2020 & 2033
- Table 23: Argentina Digital Agriculture Market Revenue (Million) Forecast, by Application 2020 & 2033
- Table 24: Rest of South America Digital Agriculture Market Revenue (Million) Forecast, by Application 2020 & 2033
- Table 25: Global Digital Agriculture Market Revenue Million Forecast, by Production Analysis 2020 & 2033
- Table 26: Global Digital Agriculture Market Revenue Million Forecast, by Consumption Analysis 2020 & 2033
- Table 27: Global Digital Agriculture Market Revenue Million Forecast, by Import Market Analysis (Value & Volume) 2020 & 2033
- Table 28: Global Digital Agriculture Market Revenue Million Forecast, by Export Market Analysis (Value & Volume) 2020 & 2033
- Table 29: Global Digital Agriculture Market Revenue Million Forecast, by Price Trend Analysis 2020 & 2033
- Table 30: Global Digital Agriculture Market Revenue Million Forecast, by Country 2020 & 2033
- Table 31: United Kingdom Digital Agriculture Market Revenue (Million) Forecast, by Application 2020 & 2033
- Table 32: Germany Digital Agriculture Market Revenue (Million) Forecast, by Application 2020 & 2033
- Table 33: France Digital Agriculture Market Revenue (Million) Forecast, by Application 2020 & 2033
- Table 34: Italy Digital Agriculture Market Revenue (Million) Forecast, by Application 2020 & 2033
- Table 35: Spain Digital Agriculture Market Revenue (Million) Forecast, by Application 2020 & 2033
- Table 36: Russia Digital Agriculture Market Revenue (Million) Forecast, by Application 2020 & 2033
- Table 37: Benelux Digital Agriculture Market Revenue (Million) Forecast, by Application 2020 & 2033
- Table 38: Nordics Digital Agriculture Market Revenue (Million) Forecast, by Application 2020 & 2033
- Table 39: Rest of Europe Digital Agriculture Market Revenue (Million) Forecast, by Application 2020 & 2033
- Table 40: Global Digital Agriculture Market Revenue Million Forecast, by Production Analysis 2020 & 2033
- Table 41: Global Digital Agriculture Market Revenue Million Forecast, by Consumption Analysis 2020 & 2033
- Table 42: Global Digital Agriculture Market Revenue Million Forecast, by Import Market Analysis (Value & Volume) 2020 & 2033
- Table 43: Global Digital Agriculture Market Revenue Million Forecast, by Export Market Analysis (Value & Volume) 2020 & 2033
- Table 44: Global Digital Agriculture Market Revenue Million Forecast, by Price Trend Analysis 2020 & 2033
- Table 45: Global Digital Agriculture Market Revenue Million Forecast, by Country 2020 & 2033
- Table 46: Turkey Digital Agriculture Market Revenue (Million) Forecast, by Application 2020 & 2033
- Table 47: Israel Digital Agriculture Market Revenue (Million) Forecast, by Application 2020 & 2033
- Table 48: GCC Digital Agriculture Market Revenue (Million) Forecast, by Application 2020 & 2033
- Table 49: North Africa Digital Agriculture Market Revenue (Million) Forecast, by Application 2020 & 2033
- Table 50: South Africa Digital Agriculture Market Revenue (Million) Forecast, by Application 2020 & 2033
- Table 51: Rest of Middle East & Africa Digital Agriculture Market Revenue (Million) Forecast, by Application 2020 & 2033
- Table 52: Global Digital Agriculture Market Revenue Million Forecast, by Production Analysis 2020 & 2033
- Table 53: Global Digital Agriculture Market Revenue Million Forecast, by Consumption Analysis 2020 & 2033
- Table 54: Global Digital Agriculture Market Revenue Million Forecast, by Import Market Analysis (Value & Volume) 2020 & 2033
- Table 55: Global Digital Agriculture Market Revenue Million Forecast, by Export Market Analysis (Value & Volume) 2020 & 2033
- Table 56: Global Digital Agriculture Market Revenue Million Forecast, by Price Trend Analysis 2020 & 2033
- Table 57: Global Digital Agriculture Market Revenue Million Forecast, by Country 2020 & 2033
- Table 58: China Digital Agriculture Market Revenue (Million) Forecast, by Application 2020 & 2033
- Table 59: India Digital Agriculture Market Revenue (Million) Forecast, by Application 2020 & 2033
- Table 60: Japan Digital Agriculture Market Revenue (Million) Forecast, by Application 2020 & 2033
- Table 61: South Korea Digital Agriculture Market Revenue (Million) Forecast, by Application 2020 & 2033
- Table 62: ASEAN Digital Agriculture Market Revenue (Million) Forecast, by Application 2020 & 2033
- Table 63: Oceania Digital Agriculture Market Revenue (Million) Forecast, by Application 2020 & 2033
- Table 64: Rest of Asia Pacific Digital Agriculture Market Revenue (Million) Forecast, by Application 2020 & 2033
Frequently Asked Questions
1. What is the projected Compound Annual Growth Rate (CAGR) of the Digital Agriculture Market?
The projected CAGR is approximately 10.50%.
2. Which companies are prominent players in the Digital Agriculture Market?
Key companies in the market include AGCO Corporation, Microsoft Corporation, Small Robot Company, Easytosee Agtech, Hummingbird Technologies Limited, DTN (CLEAR AG SOLUTIONS), Conservis Corporation, Case IH Agriculture (CNH Industrial America LLC ), Raven Industries, Deere & Company, IBM Corporation, Topcon Positioning Systems, Trimble Inc, Gamaya SA, AgEagle Aerial Systems Inc, Bayer CropScience AG.
3. What are the main segments of the Digital Agriculture Market?
The market segments include Production Analysis, Consumption Analysis, Import Market Analysis (Value & Volume), Export Market Analysis (Value & Volume), Price Trend Analysis.
4. Can you provide details about the market size?
The market size is estimated to be USD 20.01 Million as of 2022.
5. What are some drivers contributing to market growth?
; Awareness About Health Benefits Associated With Pecan Consumption; Wide Application of Pecan.
6. What are the notable trends driving market growth?
Increasing Pressure for Higher Productivity and Improved Crop Health.
7. Are there any restraints impacting market growth?
; Volatility in the Prices; Adverse Weather Conditions Affecting Yield.
8. Can you provide examples of recent developments in the market?
N/A
9. What pricing options are available for accessing the report?
Pricing options include single-user, multi-user, and enterprise licenses priced at USD 4750, USD 5250, and USD 8750 respectively.
10. Is the market size provided in terms of value or volume?
The market size is provided in terms of value, measured in Million.
11. Are there any specific market keywords associated with the report?
Yes, the market keyword associated with the report is "Digital Agriculture Market," which aids in identifying and referencing the specific market segment covered.
12. How do I determine which pricing option suits my needs best?
The pricing options vary based on user requirements and access needs. Individual users may opt for single-user licenses, while businesses requiring broader access may choose multi-user or enterprise licenses for cost-effective access to the report.
13. Are there any additional resources or data provided in the Digital Agriculture Market report?
While the report offers comprehensive insights, it's advisable to review the specific contents or supplementary materials provided to ascertain if additional resources or data are available.
14. How can I stay updated on further developments or reports in the Digital Agriculture Market?
To stay informed about further developments, trends, and reports in the Digital Agriculture Market, consider subscribing to industry newsletters, following relevant companies and organizations, or regularly checking reputable industry news sources and publications.
Methodology
Step 1 - Identification of Relevant Samples Size from Population Database


Step 2 - Approaches for Defining Global Market Size (Value, Volume* & Price*)

Note*: In applicable scenarios
Step 3 - Data Sources
Primary Research
- Web Analytics
- Survey Reports
- Research Institute
- Latest Research Reports
- Opinion Leaders
Secondary Research
- Annual Reports
- White Paper
- Latest Press Release
- Industry Association
- Paid Database
- Investor Presentations

Step 4 - Data Triangulation
Involves using different sources of information in order to increase the validity of a study
These sources are likely to be stakeholders in a program - participants, other researchers, program staff, other community members, and so on.
Then we put all data in single framework & apply various statistical tools to find out the dynamic on the market.
During the analysis stage, feedback from the stakeholder groups would be compared to determine areas of agreement as well as areas of divergence