


Key Insights
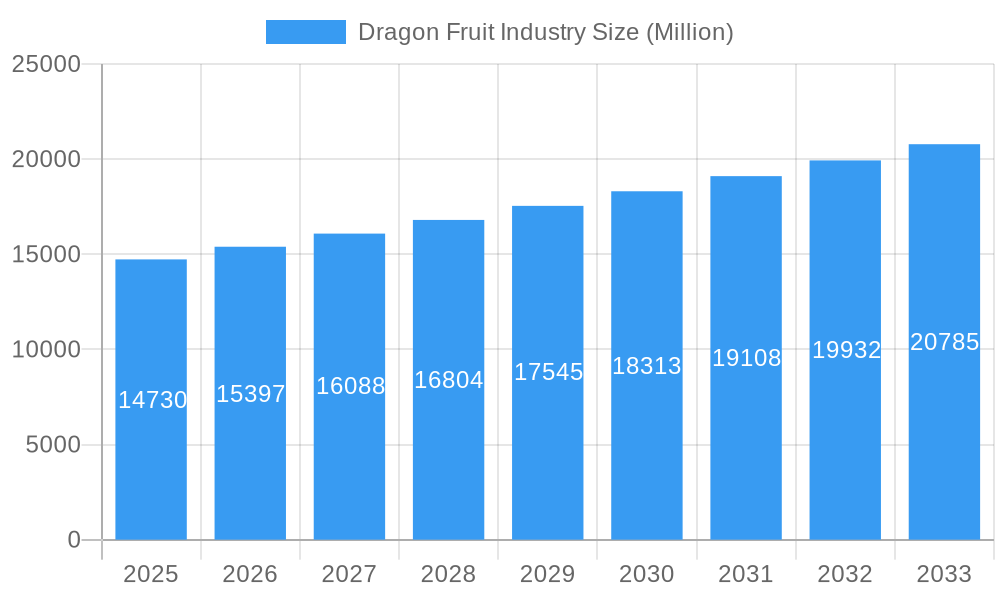
The global dragon fruit market, valued at $14.73 billion in 2025, is projected to experience robust growth, driven by increasing consumer demand for exotic fruits, rising health consciousness (due to dragon fruit's rich nutrient profile), and expanding applications in the food processing and beverage industries. The market's Compound Annual Growth Rate (CAGR) of 4.40% from 2025 to 2033 indicates a steady upward trajectory. Key growth drivers include the rising popularity of dragon fruit in smoothies, juices, and desserts, as well as its increasing use as a natural food coloring agent. Furthermore, the expansion of online retail channels and a growing global middle class with higher disposable incomes are fueling market expansion. While challenges exist, such as seasonal production and the need for efficient post-harvest management to minimize spoilage, the overall market outlook remains positive. The North American and Asia-Pacific regions are expected to lead the market due to high consumption rates and substantial import and export activities. The processed food segment is likely to witness faster growth than fresh consumption due to innovative product development and extended shelf life.
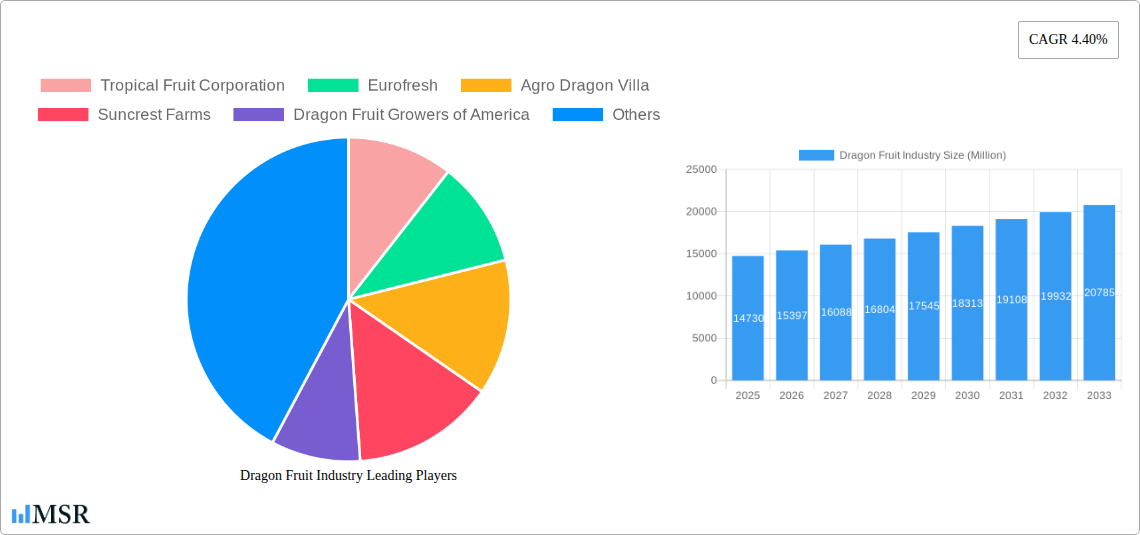
Dragon Fruit Industry Market Size (In Billion)

Significant opportunities lie in developing value-added products, improving supply chain infrastructure to reduce waste, and targeting niche markets such as health-conscious consumers and those seeking unique culinary experiences. Strategic partnerships between growers, processors, and retailers will be vital for optimizing production, distribution, and marketing. Furthermore, exploring new markets and expanding distribution channels, including e-commerce platforms, will be crucial for continued market expansion. The successful players in this market will likely be those that effectively leverage technological advancements in cultivation and processing, manage supply chain efficiency, and build strong brand recognition.
Dragon Fruit Industry Company Market Share
Dragon Fruit Industry Market Report: A Comprehensive Analysis (2019-2033)
This comprehensive report provides a detailed analysis of the global dragon fruit industry, offering invaluable insights for stakeholders seeking to navigate this dynamic market. From market size and segmentation to leading players and future trends, this report is essential for strategic decision-making. The study period covers 2019-2033, with a base year of 2025 and a forecast period of 2025-2033. The report leverages extensive data analysis to provide actionable intelligence across various segments, including fresh consumption, processed foods, beverages, and natural colorants, encompassing retail, foodservice, and industrial end-users via both online and offline distribution channels. The global market value is estimated at $XX Million in 2025, projected to reach $XX Million by 2033, exhibiting a CAGR of XX%.
Dragon Fruit Industry Market Concentration & Dynamics
The global dragon fruit market exhibits a moderately fragmented landscape, with several key players competing for market share. Key players include Tropical Fruit Corporation, Eurofresh, Agro Dragon Villa, Suncrest Farms, Dragon Fruit Growers of America, Miami Fruit, and Fruit Lovers. Market share data for 2025 indicates that Tropical Fruit Corporation holds approximately XX% market share, followed by Eurofresh at XX%, and Agro Dragon Villa at XX%. The remaining share is distributed amongst other players. Innovation within the industry focuses primarily on extending shelf life, enhancing product quality, and developing value-added products. The regulatory framework varies across regions, impacting production and trade. Substitute products include other exotic fruits, influencing consumer choice. End-user preferences are shifting towards convenient, processed products and healthier options, driving market innovation. The historical period (2019-2024) saw XX M&A deals, with an anticipated increase to XX deals during the forecast period (2025-2033).
Dragon Fruit Industry Industry Insights & Trends
The dragon fruit industry is witnessing significant growth driven by increasing consumer awareness of its health benefits, including high vitamin C content and antioxidant properties. The rising popularity of exotic fruits and the expanding global middle class are also major contributors to market expansion. Technological advancements, particularly in post-harvest handling and processing techniques, are improving product quality and shelf life. Evolving consumer behavior, which favors convenient and value-added products, is driving growth in the processed food and beverage segments. The global market size reached $XX Million in 2024, and this upward trajectory is expected to continue, fueled by factors such as increasing demand from health-conscious consumers and the growing popularity of dragon fruit-based functional foods and beverages. This growth is further supported by strategic partnerships and investments in the sector.
Key Markets & Segments Leading Dragon Fruit Industry
Southeast Asia remains the dominant region, with countries like Vietnam, Thailand, and Indonesia leading in production and export. This dominance is attributable to favorable climatic conditions and established cultivation practices.
Key Drivers for Growth in Southeast Asia:
- Favorable climatic conditions for dragon fruit cultivation
- Established infrastructure supporting cultivation and trade
- Strong government support for agricultural development
- Growing domestic demand and expanding export markets
Dominant Segments:
- Product: Fresh consumption maintains the largest share, driven by its natural sweetness and health benefits. The processed food segment is experiencing rapid growth, with increasing demand for dragon fruit-based jams, juices, and other processed products.
- End-User: The retail segment holds the largest market share due to wider consumer accessibility and a broad range of product offerings. Foodservice is also experiencing significant growth, primarily driven by its incorporation into diverse culinary applications.
- Distribution Channel: Offline channels (traditional retail outlets and supermarkets) currently dominate, but online sales are growing rapidly, especially in developed markets.
Dragon Fruit Industry Product Developments
Recent innovations include extended shelf-life technologies for fresh dragon fruit, enhancing its appeal to global markets. Processing techniques are yielding new products like dragon fruit-infused beverages, powders, and extracts. These innovations focus on enhancing product appeal, extending shelf life, and value addition, creating new applications across diverse markets such as cosmetics and pharmaceuticals due to the fruit's natural colorant properties. This diversification is enhancing the competitive edge of leading players.
Challenges in the Dragon Fruit Industry Market
The dragon fruit industry faces challenges including price volatility due to seasonal production and perishability. Supply chain inefficiencies and inadequate storage facilities can lead to significant post-harvest losses. Stringent regulatory requirements for export and import, along with intense competition from other fruit producers, pose additional hurdles to market expansion. These challenges result in an estimated XX% loss annually in the supply chain in the form of spoilage.
Forces Driving Dragon Fruit Industry Growth
Key growth drivers include the rising health consciousness among consumers globally, leading to increased demand for nutrient-rich fruits. Technological advancements in farming practices and processing techniques are boosting production efficiency and extending shelf-life, facilitating wider market access. Government initiatives promoting sustainable agriculture in many producing regions are also stimulating industry expansion.
Long-Term Growth Catalysts in the Dragon Fruit Industry
Long-term growth is expected to be fueled by continuous innovation in product development, including the creation of functional foods and beverages leveraging the fruit's health benefits. Strategic collaborations and partnerships between producers, processors, and retailers will enhance efficiency across the value chain. Expanding into new and untapped markets, particularly in regions with growing consumer disposable incomes, will drive long-term growth.
Emerging Opportunities in Dragon Fruit Industry
Emerging opportunities lie in the development of value-added products, catering to the growing demand for convenient and functional foods. Exploring new markets in regions with limited dragon fruit availability presents significant growth potential. Leveraging technology, such as precision agriculture and blockchain, can increase traceability and reduce supply chain inefficiencies. The increasing interest in natural food colorants also represents a substantial opportunity for expansion.
Leading Players in the Dragon Fruit Industry Sector
- Tropical Fruit Corporation
- Eurofresh
- Agro Dragon Villa
- Suncrest Farms
- Dragon Fruit Growers of America
- Miami Fruit
- Fruit Lovers
Key Milestones in Dragon Fruit Industry Industry
- 2020: Introduction of a new post-harvest preservation technique by Tropical Fruit Corporation, extending shelf life by 20%.
- 2022: Eurofresh launches a new line of dragon fruit-based beverages.
- 2023: Agro Dragon Villa and Suncrest Farms announce a strategic partnership for joint production and distribution.
- 2024: Dragon Fruit Growers of America secures significant investment for expansion into new markets.
Strategic Outlook for Dragon Fruit Industry Market
The dragon fruit industry holds immense potential for sustained growth, driven by rising consumer demand, technological advancements, and expanding global markets. Strategic investments in research and development, efficient supply chain management, and innovative marketing strategies are crucial for capturing a larger market share and ensuring long-term success. The focus on value-added products and strategic partnerships will be vital for driving profitability and sustainable growth across the value chain.
Dragon Fruit Industry Segmentation
- 1. Production Analysis
- 2. Consumption Analysis
- 3. Import Market Analysis (Value & Volume)
- 4. Export Market Analysis (Value & Volume)
- 5. Price Trend Analysis
Dragon Fruit Industry Segmentation By Geography
-
1. North America
- 1.1. United States
- 1.2. Canada
- 1.3. Mexico
-
2. Europe
- 2.1. Germany
- 2.2. UK
- 2.3. France
- 2.4. Netherlands
-
3. Asia Pacific
- 3.1. China
- 3.2. Vietnam
- 3.3. Cambodia
- 3.4. India
- 3.5. Thailand
- 3.6. Indonesia
-
4. South America
- 4.1. Brazil
- 4.2. Columbia
- 4.3. Argentina
-
5. Middle East and Africa
- 5.1. South Africa
- 5.2. Israel
- 5.3. Egypt
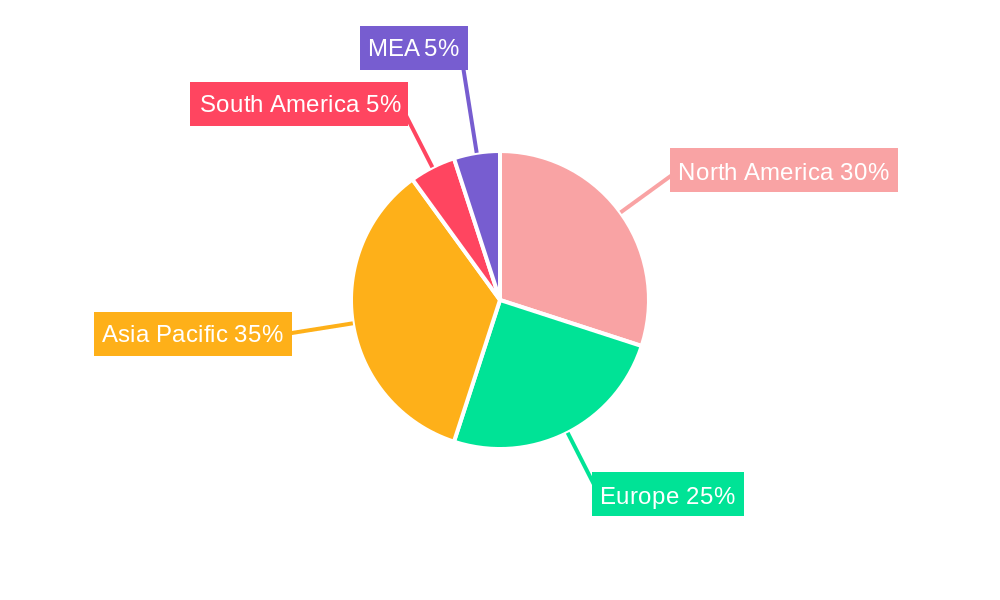
Dragon Fruit Industry Regional Market Share
Geographic Coverage of Dragon Fruit Industry
Dragon Fruit Industry REPORT HIGHLIGHTS
| Aspects | Details |
|---|---|
| Study Period | 2020-2034 |
| Base Year | 2025 |
| Estimated Year | 2026 |
| Forecast Period | 2026-2034 |
| Historical Period | 2020-2025 |
| Growth Rate | CAGR of 4.40% from 2020-2034 |
| Segmentation |
|
Table of Contents
- 1. Introduction
- 1.1. Research Scope
- 1.2. Market Segmentation
- 1.3. Research Objective
- 1.4. Definitions and Assumptions
- 2. Executive Summary
- 2.1. Market Snapshot
- 3. Market Dynamics
- 3.1. Market Drivers
- 3.2. Market Restrains
- 3.3. Market Trends
- 3.4. Market Opportunities
- 4. Market Factor Analysis
- 4.1. Porters Five Forces
- 4.1.1. Bargaining Power of Suppliers
- 4.1.2. Bargaining Power of Buyers
- 4.1.3. Threat of New Entrants
- 4.1.4. Threat of Substitutes
- 4.1.5. Competitive Rivalry
- 4.2. PESTEL analysis
- 4.3. BCG Analysis
- 4.3.1. Stars (High Growth, High Market Share)
- 4.3.2. Cash Cows (Low Growth, High Market Share)
- 4.3.3. Question Mark (High Growth, Low Market Share)
- 4.3.4. Dogs (Low Growth, Low Market Share)
- 4.4. Ansoff Matrix Analysis
- 4.5. Supply Chain Analysis
- 4.6. Regulatory Landscape
- 4.7. Current Market Potential and Opportunity Assessment (TAM–SAM–SOM Framework)
- 4.8. MSR Analyst Note
- 4.1. Porters Five Forces
- 5. Market Analysis, Insights and Forecast 2021-2033
- 5.1. Market Analysis, Insights and Forecast - by Production Analysis
- 5.2. Market Analysis, Insights and Forecast - by Consumption Analysis
- 5.3. Market Analysis, Insights and Forecast - by Import Market Analysis (Value & Volume)
- 5.4. Market Analysis, Insights and Forecast - by Export Market Analysis (Value & Volume)
- 5.5. Market Analysis, Insights and Forecast - by Price Trend Analysis
- 5.6. Market Analysis, Insights and Forecast - by Region
- 5.6.1. North America
- 5.6.2. Europe
- 5.6.3. Asia Pacific
- 5.6.4. South America
- 5.6.5. Middle East and Africa
- 6. Global Dragon Fruit Industry Analysis, Insights and Forecast, 2021-2033
- 6.1. Market Analysis, Insights and Forecast - by Production Analysis
- 6.2. Market Analysis, Insights and Forecast - by Consumption Analysis
- 6.3. Market Analysis, Insights and Forecast - by Import Market Analysis (Value & Volume)
- 6.4. Market Analysis, Insights and Forecast - by Export Market Analysis (Value & Volume)
- 6.5. Market Analysis, Insights and Forecast - by Price Trend Analysis
- 7. North America Dragon Fruit Industry Analysis, Insights and Forecast, 2020-2032
- 7.1. Market Analysis, Insights and Forecast - by Production Analysis
- 7.2. Market Analysis, Insights and Forecast - by Consumption Analysis
- 7.3. Market Analysis, Insights and Forecast - by Import Market Analysis (Value & Volume)
- 7.4. Market Analysis, Insights and Forecast - by Export Market Analysis (Value & Volume)
- 7.5. Market Analysis, Insights and Forecast - by Price Trend Analysis
- 8. Europe Dragon Fruit Industry Analysis, Insights and Forecast, 2020-2032
- 8.1. Market Analysis, Insights and Forecast - by Production Analysis
- 8.2. Market Analysis, Insights and Forecast - by Consumption Analysis
- 8.3. Market Analysis, Insights and Forecast - by Import Market Analysis (Value & Volume)
- 8.4. Market Analysis, Insights and Forecast - by Export Market Analysis (Value & Volume)
- 8.5. Market Analysis, Insights and Forecast - by Price Trend Analysis
- 9. Asia Pacific Dragon Fruit Industry Analysis, Insights and Forecast, 2020-2032
- 9.1. Market Analysis, Insights and Forecast - by Production Analysis
- 9.2. Market Analysis, Insights and Forecast - by Consumption Analysis
- 9.3. Market Analysis, Insights and Forecast - by Import Market Analysis (Value & Volume)
- 9.4. Market Analysis, Insights and Forecast - by Export Market Analysis (Value & Volume)
- 9.5. Market Analysis, Insights and Forecast - by Price Trend Analysis
- 10. South America Dragon Fruit Industry Analysis, Insights and Forecast, 2020-2032
- 10.1. Market Analysis, Insights and Forecast - by Production Analysis
- 10.2. Market Analysis, Insights and Forecast - by Consumption Analysis
- 10.3. Market Analysis, Insights and Forecast - by Import Market Analysis (Value & Volume)
- 10.4. Market Analysis, Insights and Forecast - by Export Market Analysis (Value & Volume)
- 10.5. Market Analysis, Insights and Forecast - by Price Trend Analysis
- 11. Middle East and Africa Dragon Fruit Industry Analysis, Insights and Forecast, 2020-2032
- 11.1. Market Analysis, Insights and Forecast - by Production Analysis
- 11.2. Market Analysis, Insights and Forecast - by Consumption Analysis
- 11.3. Market Analysis, Insights and Forecast - by Import Market Analysis (Value & Volume)
- 11.4. Market Analysis, Insights and Forecast - by Export Market Analysis (Value & Volume)
- 11.5. Market Analysis, Insights and Forecast - by Price Trend Analysis
- 12. Competitive Analysis
- 12.1. Company Profiles
- 12.1.1 Tropical Fruit Corporation
- 12.1.1.1. Company Overview
- 12.1.1.2. Products
- 12.1.1.3. Company Financials
- 12.1.1.4. SWOT Analysis
- 12.1.2 Eurofresh
- 12.1.2.1. Company Overview
- 12.1.2.2. Products
- 12.1.2.3. Company Financials
- 12.1.2.4. SWOT Analysis
- 12.1.3 Agro Dragon Villa
- 12.1.3.1. Company Overview
- 12.1.3.2. Products
- 12.1.3.3. Company Financials
- 12.1.3.4. SWOT Analysis
- 12.1.4 Suncrest Farms
- 12.1.4.1. Company Overview
- 12.1.4.2. Products
- 12.1.4.3. Company Financials
- 12.1.4.4. SWOT Analysis
- 12.1.5 Dragon Fruit Growers of America
- 12.1.5.1. Company Overview
- 12.1.5.2. Products
- 12.1.5.3. Company Financials
- 12.1.5.4. SWOT Analysis
- 12.1.6 Miami Fruit
- 12.1.6.1. Company Overview
- 12.1.6.2. Products
- 12.1.6.3. Company Financials
- 12.1.6.4. SWOT Analysis
- 12.1.7 Fruit Lovers
- 12.1.7.1. Company Overview
- 12.1.7.2. Products
- 12.1.7.3. Company Financials
- 12.1.7.4. SWOT Analysis
- 12.1.1 Tropical Fruit Corporation
- 12.2. Market Entropy
- 12.2.1 Company's Key Areas Served
- 12.2.2 Recent Developments
- 12.3. Company Market Share Analysis 2025
- 12.3.1 Top 5 Companies Market Share Analysis
- 12.3.2 Top 3 Companies Market Share Analysis
- 12.4. List of Potential Customers
- 13. Research Methodology
List of Figures
- Figure 1: Global Dragon Fruit Industry Revenue Breakdown (Million, %) by Region 2025 & 2033
- Figure 2: North America Dragon Fruit Industry Revenue (Million), by Production Analysis 2025 & 2033
- Figure 3: North America Dragon Fruit Industry Revenue Share (%), by Production Analysis 2025 & 2033
- Figure 4: North America Dragon Fruit Industry Revenue (Million), by Consumption Analysis 2025 & 2033
- Figure 5: North America Dragon Fruit Industry Revenue Share (%), by Consumption Analysis 2025 & 2033
- Figure 6: North America Dragon Fruit Industry Revenue (Million), by Import Market Analysis (Value & Volume) 2025 & 2033
- Figure 7: North America Dragon Fruit Industry Revenue Share (%), by Import Market Analysis (Value & Volume) 2025 & 2033
- Figure 8: North America Dragon Fruit Industry Revenue (Million), by Export Market Analysis (Value & Volume) 2025 & 2033
- Figure 9: North America Dragon Fruit Industry Revenue Share (%), by Export Market Analysis (Value & Volume) 2025 & 2033
- Figure 10: North America Dragon Fruit Industry Revenue (Million), by Price Trend Analysis 2025 & 2033
- Figure 11: North America Dragon Fruit Industry Revenue Share (%), by Price Trend Analysis 2025 & 2033
- Figure 12: North America Dragon Fruit Industry Revenue (Million), by Country 2025 & 2033
- Figure 13: North America Dragon Fruit Industry Revenue Share (%), by Country 2025 & 2033
- Figure 14: Europe Dragon Fruit Industry Revenue (Million), by Production Analysis 2025 & 2033
- Figure 15: Europe Dragon Fruit Industry Revenue Share (%), by Production Analysis 2025 & 2033
- Figure 16: Europe Dragon Fruit Industry Revenue (Million), by Consumption Analysis 2025 & 2033
- Figure 17: Europe Dragon Fruit Industry Revenue Share (%), by Consumption Analysis 2025 & 2033
- Figure 18: Europe Dragon Fruit Industry Revenue (Million), by Import Market Analysis (Value & Volume) 2025 & 2033
- Figure 19: Europe Dragon Fruit Industry Revenue Share (%), by Import Market Analysis (Value & Volume) 2025 & 2033
- Figure 20: Europe Dragon Fruit Industry Revenue (Million), by Export Market Analysis (Value & Volume) 2025 & 2033
- Figure 21: Europe Dragon Fruit Industry Revenue Share (%), by Export Market Analysis (Value & Volume) 2025 & 2033
- Figure 22: Europe Dragon Fruit Industry Revenue (Million), by Price Trend Analysis 2025 & 2033
- Figure 23: Europe Dragon Fruit Industry Revenue Share (%), by Price Trend Analysis 2025 & 2033
- Figure 24: Europe Dragon Fruit Industry Revenue (Million), by Country 2025 & 2033
- Figure 25: Europe Dragon Fruit Industry Revenue Share (%), by Country 2025 & 2033
- Figure 26: Asia Pacific Dragon Fruit Industry Revenue (Million), by Production Analysis 2025 & 2033
- Figure 27: Asia Pacific Dragon Fruit Industry Revenue Share (%), by Production Analysis 2025 & 2033
- Figure 28: Asia Pacific Dragon Fruit Industry Revenue (Million), by Consumption Analysis 2025 & 2033
- Figure 29: Asia Pacific Dragon Fruit Industry Revenue Share (%), by Consumption Analysis 2025 & 2033
- Figure 30: Asia Pacific Dragon Fruit Industry Revenue (Million), by Import Market Analysis (Value & Volume) 2025 & 2033
- Figure 31: Asia Pacific Dragon Fruit Industry Revenue Share (%), by Import Market Analysis (Value & Volume) 2025 & 2033
- Figure 32: Asia Pacific Dragon Fruit Industry Revenue (Million), by Export Market Analysis (Value & Volume) 2025 & 2033
- Figure 33: Asia Pacific Dragon Fruit Industry Revenue Share (%), by Export Market Analysis (Value & Volume) 2025 & 2033
- Figure 34: Asia Pacific Dragon Fruit Industry Revenue (Million), by Price Trend Analysis 2025 & 2033
- Figure 35: Asia Pacific Dragon Fruit Industry Revenue Share (%), by Price Trend Analysis 2025 & 2033
- Figure 36: Asia Pacific Dragon Fruit Industry Revenue (Million), by Country 2025 & 2033
- Figure 37: Asia Pacific Dragon Fruit Industry Revenue Share (%), by Country 2025 & 2033
- Figure 38: South America Dragon Fruit Industry Revenue (Million), by Production Analysis 2025 & 2033
- Figure 39: South America Dragon Fruit Industry Revenue Share (%), by Production Analysis 2025 & 2033
- Figure 40: South America Dragon Fruit Industry Revenue (Million), by Consumption Analysis 2025 & 2033
- Figure 41: South America Dragon Fruit Industry Revenue Share (%), by Consumption Analysis 2025 & 2033
- Figure 42: South America Dragon Fruit Industry Revenue (Million), by Import Market Analysis (Value & Volume) 2025 & 2033
- Figure 43: South America Dragon Fruit Industry Revenue Share (%), by Import Market Analysis (Value & Volume) 2025 & 2033
- Figure 44: South America Dragon Fruit Industry Revenue (Million), by Export Market Analysis (Value & Volume) 2025 & 2033
- Figure 45: South America Dragon Fruit Industry Revenue Share (%), by Export Market Analysis (Value & Volume) 2025 & 2033
- Figure 46: South America Dragon Fruit Industry Revenue (Million), by Price Trend Analysis 2025 & 2033
- Figure 47: South America Dragon Fruit Industry Revenue Share (%), by Price Trend Analysis 2025 & 2033
- Figure 48: South America Dragon Fruit Industry Revenue (Million), by Country 2025 & 2033
- Figure 49: South America Dragon Fruit Industry Revenue Share (%), by Country 2025 & 2033
- Figure 50: Middle East and Africa Dragon Fruit Industry Revenue (Million), by Production Analysis 2025 & 2033
- Figure 51: Middle East and Africa Dragon Fruit Industry Revenue Share (%), by Production Analysis 2025 & 2033
- Figure 52: Middle East and Africa Dragon Fruit Industry Revenue (Million), by Consumption Analysis 2025 & 2033
- Figure 53: Middle East and Africa Dragon Fruit Industry Revenue Share (%), by Consumption Analysis 2025 & 2033
- Figure 54: Middle East and Africa Dragon Fruit Industry Revenue (Million), by Import Market Analysis (Value & Volume) 2025 & 2033
- Figure 55: Middle East and Africa Dragon Fruit Industry Revenue Share (%), by Import Market Analysis (Value & Volume) 2025 & 2033
- Figure 56: Middle East and Africa Dragon Fruit Industry Revenue (Million), by Export Market Analysis (Value & Volume) 2025 & 2033
- Figure 57: Middle East and Africa Dragon Fruit Industry Revenue Share (%), by Export Market Analysis (Value & Volume) 2025 & 2033
- Figure 58: Middle East and Africa Dragon Fruit Industry Revenue (Million), by Price Trend Analysis 2025 & 2033
- Figure 59: Middle East and Africa Dragon Fruit Industry Revenue Share (%), by Price Trend Analysis 2025 & 2033
- Figure 60: Middle East and Africa Dragon Fruit Industry Revenue (Million), by Country 2025 & 2033
- Figure 61: Middle East and Africa Dragon Fruit Industry Revenue Share (%), by Country 2025 & 2033
List of Tables
- Table 1: Global Dragon Fruit Industry Revenue Million Forecast, by Production Analysis 2020 & 2033
- Table 2: Global Dragon Fruit Industry Revenue Million Forecast, by Consumption Analysis 2020 & 2033
- Table 3: Global Dragon Fruit Industry Revenue Million Forecast, by Import Market Analysis (Value & Volume) 2020 & 2033
- Table 4: Global Dragon Fruit Industry Revenue Million Forecast, by Export Market Analysis (Value & Volume) 2020 & 2033
- Table 5: Global Dragon Fruit Industry Revenue Million Forecast, by Price Trend Analysis 2020 & 2033
- Table 6: Global Dragon Fruit Industry Revenue Million Forecast, by Region 2020 & 2033
- Table 7: Global Dragon Fruit Industry Revenue Million Forecast, by Production Analysis 2020 & 2033
- Table 8: Global Dragon Fruit Industry Revenue Million Forecast, by Consumption Analysis 2020 & 2033
- Table 9: Global Dragon Fruit Industry Revenue Million Forecast, by Import Market Analysis (Value & Volume) 2020 & 2033
- Table 10: Global Dragon Fruit Industry Revenue Million Forecast, by Export Market Analysis (Value & Volume) 2020 & 2033
- Table 11: Global Dragon Fruit Industry Revenue Million Forecast, by Price Trend Analysis 2020 & 2033
- Table 12: Global Dragon Fruit Industry Revenue Million Forecast, by Country 2020 & 2033
- Table 13: United States Dragon Fruit Industry Revenue (Million) Forecast, by Application 2020 & 2033
- Table 14: Canada Dragon Fruit Industry Revenue (Million) Forecast, by Application 2020 & 2033
- Table 15: Mexico Dragon Fruit Industry Revenue (Million) Forecast, by Application 2020 & 2033
- Table 16: Global Dragon Fruit Industry Revenue Million Forecast, by Production Analysis 2020 & 2033
- Table 17: Global Dragon Fruit Industry Revenue Million Forecast, by Consumption Analysis 2020 & 2033
- Table 18: Global Dragon Fruit Industry Revenue Million Forecast, by Import Market Analysis (Value & Volume) 2020 & 2033
- Table 19: Global Dragon Fruit Industry Revenue Million Forecast, by Export Market Analysis (Value & Volume) 2020 & 2033
- Table 20: Global Dragon Fruit Industry Revenue Million Forecast, by Price Trend Analysis 2020 & 2033
- Table 21: Global Dragon Fruit Industry Revenue Million Forecast, by Country 2020 & 2033
- Table 22: Germany Dragon Fruit Industry Revenue (Million) Forecast, by Application 2020 & 2033
- Table 23: UK Dragon Fruit Industry Revenue (Million) Forecast, by Application 2020 & 2033
- Table 24: France Dragon Fruit Industry Revenue (Million) Forecast, by Application 2020 & 2033
- Table 25: Netherlands Dragon Fruit Industry Revenue (Million) Forecast, by Application 2020 & 2033
- Table 26: Global Dragon Fruit Industry Revenue Million Forecast, by Production Analysis 2020 & 2033
- Table 27: Global Dragon Fruit Industry Revenue Million Forecast, by Consumption Analysis 2020 & 2033
- Table 28: Global Dragon Fruit Industry Revenue Million Forecast, by Import Market Analysis (Value & Volume) 2020 & 2033
- Table 29: Global Dragon Fruit Industry Revenue Million Forecast, by Export Market Analysis (Value & Volume) 2020 & 2033
- Table 30: Global Dragon Fruit Industry Revenue Million Forecast, by Price Trend Analysis 2020 & 2033
- Table 31: Global Dragon Fruit Industry Revenue Million Forecast, by Country 2020 & 2033
- Table 32: China Dragon Fruit Industry Revenue (Million) Forecast, by Application 2020 & 2033
- Table 33: Vietnam Dragon Fruit Industry Revenue (Million) Forecast, by Application 2020 & 2033
- Table 34: Cambodia Dragon Fruit Industry Revenue (Million) Forecast, by Application 2020 & 2033
- Table 35: India Dragon Fruit Industry Revenue (Million) Forecast, by Application 2020 & 2033
- Table 36: Thailand Dragon Fruit Industry Revenue (Million) Forecast, by Application 2020 & 2033
- Table 37: Indonesia Dragon Fruit Industry Revenue (Million) Forecast, by Application 2020 & 2033
- Table 38: Global Dragon Fruit Industry Revenue Million Forecast, by Production Analysis 2020 & 2033
- Table 39: Global Dragon Fruit Industry Revenue Million Forecast, by Consumption Analysis 2020 & 2033
- Table 40: Global Dragon Fruit Industry Revenue Million Forecast, by Import Market Analysis (Value & Volume) 2020 & 2033
- Table 41: Global Dragon Fruit Industry Revenue Million Forecast, by Export Market Analysis (Value & Volume) 2020 & 2033
- Table 42: Global Dragon Fruit Industry Revenue Million Forecast, by Price Trend Analysis 2020 & 2033
- Table 43: Global Dragon Fruit Industry Revenue Million Forecast, by Country 2020 & 2033
- Table 44: Brazil Dragon Fruit Industry Revenue (Million) Forecast, by Application 2020 & 2033
- Table 45: Columbia Dragon Fruit Industry Revenue (Million) Forecast, by Application 2020 & 2033
- Table 46: Argentina Dragon Fruit Industry Revenue (Million) Forecast, by Application 2020 & 2033
- Table 47: Global Dragon Fruit Industry Revenue Million Forecast, by Production Analysis 2020 & 2033
- Table 48: Global Dragon Fruit Industry Revenue Million Forecast, by Consumption Analysis 2020 & 2033
- Table 49: Global Dragon Fruit Industry Revenue Million Forecast, by Import Market Analysis (Value & Volume) 2020 & 2033
- Table 50: Global Dragon Fruit Industry Revenue Million Forecast, by Export Market Analysis (Value & Volume) 2020 & 2033
- Table 51: Global Dragon Fruit Industry Revenue Million Forecast, by Price Trend Analysis 2020 & 2033
- Table 52: Global Dragon Fruit Industry Revenue Million Forecast, by Country 2020 & 2033
- Table 53: South Africa Dragon Fruit Industry Revenue (Million) Forecast, by Application 2020 & 2033
- Table 54: Israel Dragon Fruit Industry Revenue (Million) Forecast, by Application 2020 & 2033
- Table 55: Egypt Dragon Fruit Industry Revenue (Million) Forecast, by Application 2020 & 2033
Frequently Asked Questions
1. What is the projected Compound Annual Growth Rate (CAGR) of the Dragon Fruit Industry?
The projected CAGR is approximately 4.40%.
2. Which companies are prominent players in the Dragon Fruit Industry?
Key companies in the market include Tropical Fruit Corporation , Eurofresh , Agro Dragon Villa , Suncrest Farms , Dragon Fruit Growers of America , Miami Fruit , Fruit Lovers.
3. What are the main segments of the Dragon Fruit Industry?
The market segments include Production Analysis, Consumption Analysis, Import Market Analysis (Value & Volume), Export Market Analysis (Value & Volume), Price Trend Analysis.
4. Can you provide details about the market size?
The market size is estimated to be USD 14.73 Million as of 2022.
5. What are some drivers contributing to market growth?
Increasing Demand for Garlic Due to Various Uses in Industries; Rising Demad of Organic Garlic; Increasing Government Initiatives.
6. What are the notable trends driving market growth?
Growing Demand for Dragon Fruit in China.
7. Are there any restraints impacting market growth?
Lack of Technical Knowledge of Farmers; Price Fluctuations.
8. Can you provide examples of recent developments in the market?
N/A
9. What pricing options are available for accessing the report?
Pricing options include single-user, multi-user, and enterprise licenses priced at USD 4750, USD 5250, and USD 8750 respectively.
10. Is the market size provided in terms of value or volume?
The market size is provided in terms of value, measured in Million.
11. Are there any specific market keywords associated with the report?
Yes, the market keyword associated with the report is "Dragon Fruit Industry," which aids in identifying and referencing the specific market segment covered.
12. How do I determine which pricing option suits my needs best?
The pricing options vary based on user requirements and access needs. Individual users may opt for single-user licenses, while businesses requiring broader access may choose multi-user or enterprise licenses for cost-effective access to the report.
13. Are there any additional resources or data provided in the Dragon Fruit Industry report?
While the report offers comprehensive insights, it's advisable to review the specific contents or supplementary materials provided to ascertain if additional resources or data are available.
14. How can I stay updated on further developments or reports in the Dragon Fruit Industry?
To stay informed about further developments, trends, and reports in the Dragon Fruit Industry, consider subscribing to industry newsletters, following relevant companies and organizations, or regularly checking reputable industry news sources and publications.
Methodology
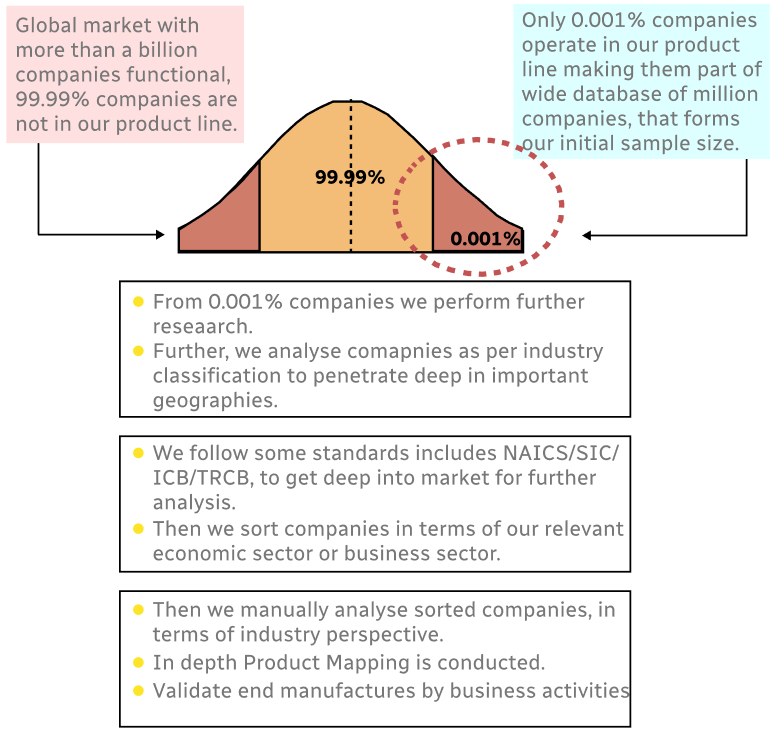
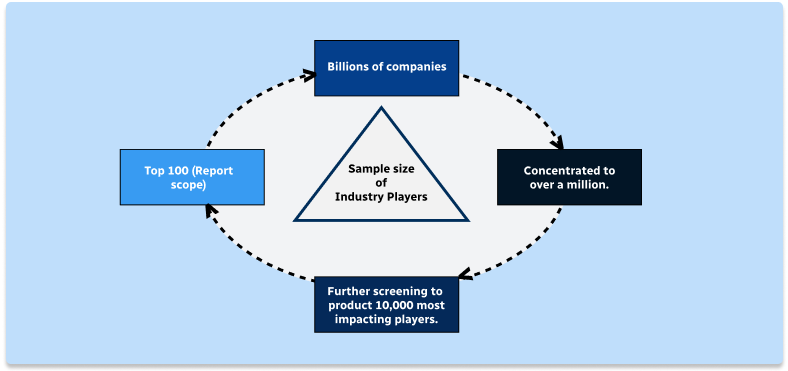
Step 1 - Identification of Relevant Samples Size from Population Database
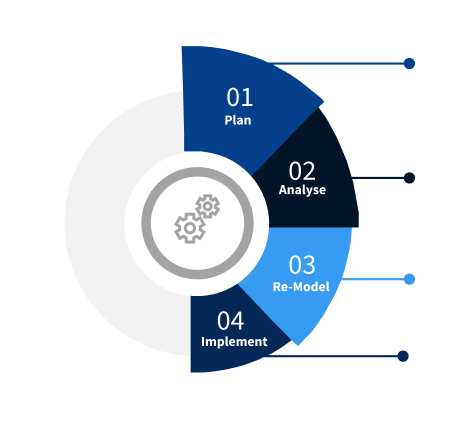
Step 2 - Approaches for Defining Global Market Size (Value, Volume* & Price*)
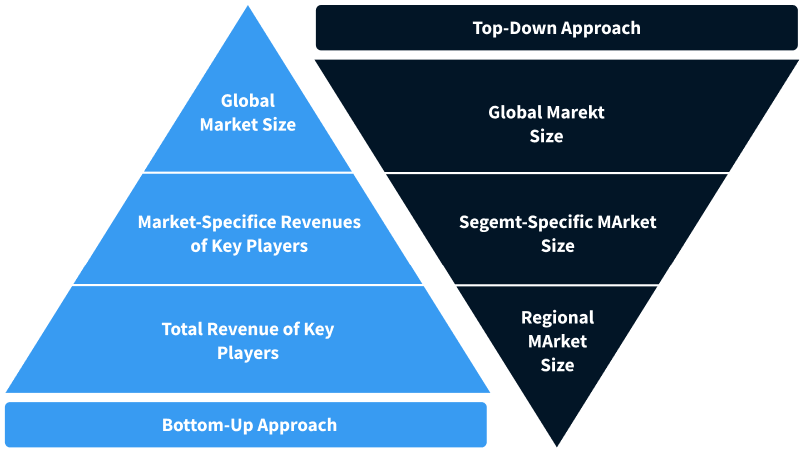
Note*: In applicable scenarios
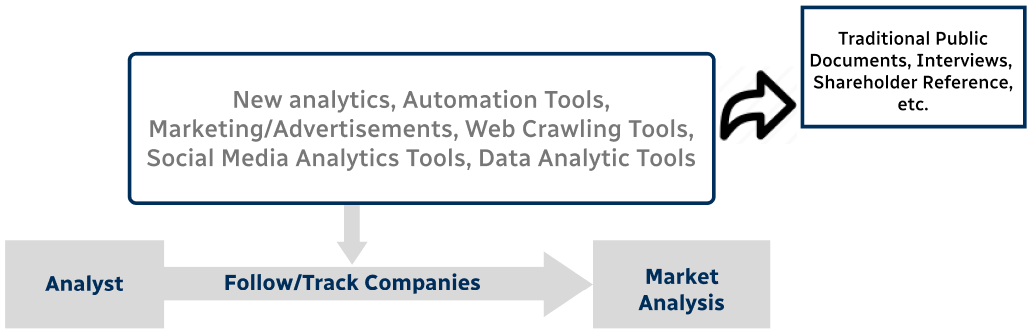
Step 3 - Data Sources
Primary Research
- Web Analytics
- Survey Reports
- Research Institute
- Latest Research Reports
- Opinion Leaders
Secondary Research
- Annual Reports
- White Paper
- Latest Press Release
- Industry Association
- Paid Database
- Investor Presentations
Step 4 - Data Triangulation
Involves using different sources of information in order to increase the validity of a study
These sources are likely to be stakeholders in a program - participants, other researchers, program staff, other community members, and so on.
Then we put all data in single framework & apply various statistical tools to find out the dynamic on the market.
During the analysis stage, feedback from the stakeholder groups would be compared to determine areas of agreement as well as areas of divergence