

Key Insights
The global electrolyte battery market is experiencing robust growth, projected to reach a substantial size driven by the increasing demand for energy storage solutions and electric vehicles (EVs). The market's Compound Annual Growth Rate (CAGR) of 11.60% from 2019 to 2024 indicates a significant upward trajectory. This growth is fueled by several key factors, including the rising adoption of renewable energy sources (necessitating efficient energy storage), the global push towards electrification of transportation, and the expanding consumer electronics market. Lithium-ion batteries currently dominate the market due to their high energy density and relatively long lifespan, but advancements in flow batteries and other technologies are expected to challenge this dominance in the coming years. The market is segmented by battery type (lead-acid, lithium-ion, flow battery, zinc-bromide, and others) and end-user applications (electric vehicles, energy storage systems, consumer electronics, and others). Geographic distribution reveals strong growth potential across Asia-Pacific, driven largely by China's expanding EV market and investments in renewable energy infrastructure. North America and Europe also represent significant market segments, albeit with potentially slower growth rates compared to Asia-Pacific. The market faces challenges such as the fluctuating price of raw materials and the need for improved battery recycling infrastructure to address environmental concerns. However, ongoing technological advancements, government incentives promoting clean energy adoption, and the overall increase in global energy demand are expected to propel the electrolyte battery market to considerable heights throughout the forecast period (2025-2033).
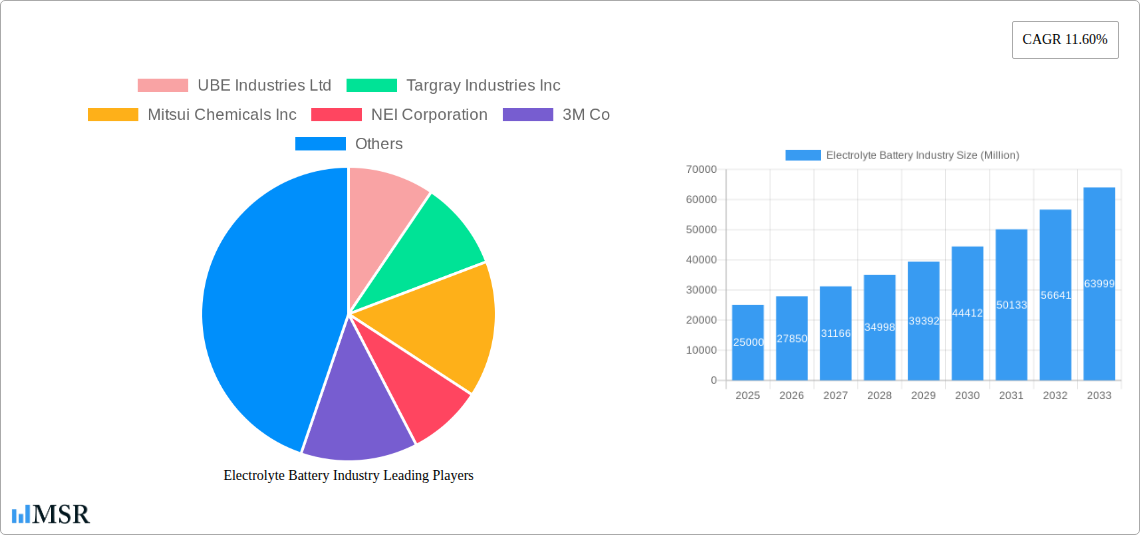
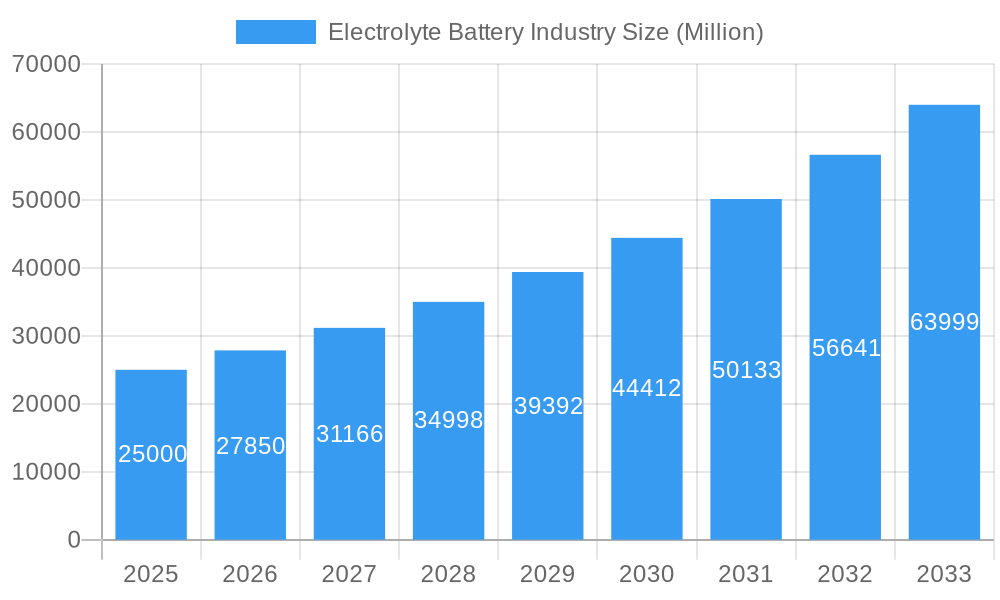
Electrolyte Battery Industry Market Size (In Billion)
Despite existing challenges, the long-term outlook for the electrolyte battery market remains positive. The ongoing development of more efficient and cost-effective battery technologies, coupled with stringent environmental regulations globally, will continue to push market growth. Companies are actively investing in research and development to enhance battery performance, lifespan, safety, and sustainability. Furthermore, collaborations between battery manufacturers, automotive companies, and energy providers are creating a synergistic ecosystem that will further accelerate market expansion. The growing need for reliable and sustainable energy storage solutions in various sectors, including grid-scale energy storage, smart grids, and portable power devices, will create substantial opportunities for growth within the different segments of the electrolyte battery market. The competition among major players will drive innovation and further fuel market expansion, creating a dynamic and evolving landscape within the electrolyte battery industry. Strategic partnerships, mergers and acquisitions, and advancements in battery chemistries will play a key role in shaping the future market landscape.
Electrolyte Battery Industry Company Market Share
Electrolyte Battery Industry Market Report: 2019-2033
This comprehensive report provides an in-depth analysis of the global electrolyte battery industry, covering market size, growth drivers, key players, and future trends. With a study period spanning 2019-2033, a base year of 2025, and a forecast period of 2025-2033, this report offers invaluable insights for industry stakeholders, investors, and researchers. The report analyzes key segments including Lead Acid, Lithium-ion, Flow Battery, and Zinc Bromide batteries, across diverse end-user applications like Electric Vehicles, Energy Storage, Consumer Electronics, and more. Expect detailed breakdowns of market concentration, technological advancements, and emerging opportunities, with a focus on key players like UBE Industries Ltd, Targray Industries Inc, and Mitsui Chemicals Inc. Download now to gain a competitive edge!
Electrolyte Battery Industry Market Concentration & Dynamics
The global electrolyte battery market exhibits a moderately concentrated landscape, with a handful of major players holding significant market share. The market share distribution is influenced by factors like technological advancements, manufacturing capabilities, and strategic partnerships. The past five years have witnessed significant M&A activity, with approximately xx deals recorded, indicating a trend towards consolidation and expansion within the industry. Innovation ecosystems are flourishing, with several startups focusing on next-generation battery technologies and materials. Regulatory frameworks concerning battery safety and environmental regulations vary across different regions, impacting market dynamics. Substitute products, such as fuel cells and other energy storage solutions, pose a competitive threat, while end-user trends heavily influence demand, particularly the rapid growth of the electric vehicle market.
- Market Concentration: Top 5 players hold approximately xx% market share (2024).
- M&A Activity: xx deals closed in the period 2019-2024.
- Regulatory Landscape: Varied regulations across regions impacting market entry and operations.
- Substitute Products: Competition from fuel cells and alternative energy storage technologies.
- End-User Trends: Strong growth driven by the electric vehicle and renewable energy sectors.
Electrolyte Battery Industry Insights & Trends
The global electrolyte battery market is experiencing robust growth, with a projected Compound Annual Growth Rate (CAGR) of xx% during the forecast period (2025-2033). The market size was valued at approximately $xx Million in 2024 and is expected to reach $xx Million by 2033. Several factors are driving this growth, including the increasing demand for electric vehicles, the expansion of renewable energy infrastructure, and the growing adoption of consumer electronics powered by batteries. Technological advancements in battery chemistry and manufacturing processes are continuously improving energy density, lifespan, and safety. Evolving consumer preferences towards environmentally friendly and sustainable products further propel the market. Technological disruptions, such as the development of solid-state batteries, are anticipated to significantly impact the industry in the coming years.
Key Markets & Segments Leading Electrolyte Battery Industry
The lithium-ion battery segment dominates the electrolyte battery market, accounting for approximately xx% of the total market revenue in 2024, driven by its high energy density and widespread application in portable electronics and electric vehicles. The electric vehicle (EV) sector is a major end-user, representing approximately xx% of total demand in 2024. Asia-Pacific remains the leading region due to high demand from China and other rapidly developing economies.
Key Market Drivers:
- Electric Vehicle (EV) Adoption: Rapid growth in the global EV market.
- Renewable Energy Integration: Expanding need for energy storage solutions.
- Consumer Electronics Demand: Continuous growth in the portable electronics market.
- Government Incentives & Policies: Support for renewable energy and electric mobility.
Regional Dominance:
Asia-Pacific holds the largest market share, followed by North America and Europe. This is primarily due to the high concentration of electric vehicle manufacturing and renewable energy projects in the region.
Electrolyte Battery Industry Product Developments
Recent advancements focus on improving energy density, cycle life, safety, and cost-effectiveness. Innovations in materials science, such as the use of advanced silicon anodes and solid-state electrolytes, are enhancing battery performance. The development of fast-charging technologies is also crucial, addressing range anxiety in electric vehicles. These innovations contribute to a competitive landscape, driving improvements in battery technology across various segments.
Challenges in the Electrolyte Battery Industry Market
The electrolyte battery industry faces challenges including supply chain disruptions impacting raw material availability, particularly for critical minerals like lithium and cobalt. Stringent safety regulations and environmental concerns add complexity to manufacturing and disposal processes. The intense competition among battery manufacturers and the fluctuating prices of raw materials also pose significant hurdles. These factors can lead to production delays and increased costs, potentially impacting market growth.
Forces Driving Electrolyte Battery Industry Growth
Technological advancements in battery chemistries and manufacturing processes are key drivers, particularly the ongoing research into solid-state batteries and other high-energy-density options. Government policies promoting electric vehicles and renewable energy storage significantly boost demand. The growing awareness of environmental concerns and the shift toward sustainable energy solutions are creating favorable conditions for electrolyte battery adoption.
Long-Term Growth Catalysts in the Electrolyte Battery Industry Market
Long-term growth hinges on sustained investment in research and development, leading to breakthroughs in battery technologies with higher energy density, improved safety, and reduced cost. Strategic partnerships between battery manufacturers, automotive companies, and energy providers will create synergies that accelerate market penetration. Expanding into new markets, particularly in developing economies, represents significant growth potential.
Emerging Opportunities in Electrolyte Battery Industry
The development of next-generation battery technologies, like solid-state batteries, presents significant opportunities. Expanding applications beyond electric vehicles and consumer electronics, such as grid-scale energy storage and industrial applications, will broaden market reach. Growth in renewable energy generation and the need for reliable energy storage create a massive opportunity for electrolyte batteries.
Leading Players in the Electrolyte Battery Industry Sector
- UBE Industries Ltd
- Targray Industries Inc
- Mitsui Chemicals Inc
- NEI Corporation
- 3M Co
- Guangzhou Tinci Materials Technology Co Ltd
- Mitsubishi Chemical Holdings Corporation
- Shenzhen Capchem Technology Co Ltd
Key Milestones in Electrolyte Battery Industry Industry
- February 2022: US Vanadium announced an expanded purchase agreement with Enerox for up to 3 Million additional liters/year of electrolyte.
- January 2022: Nexeon Limited licensed its NSP-1 technology to SKC Co. Ltd for next-generation lithium-ion batteries.
Strategic Outlook for Electrolyte Battery Industry Market
The future of the electrolyte battery industry is bright, driven by the increasing demand for electric vehicles, renewable energy storage, and other applications. Strategic partnerships, technological innovation, and government support will be crucial for realizing the industry's full potential. The focus on sustainability, improved performance, and cost reduction will shape the market landscape in the coming years.
Electrolyte Battery Industry Segmentation
-
1. Battery Type and Electrolyte Type
-
1.1. Lead Acid
- 1.1.1. Liquid Electrolyte
- 1.1.2. Gel Electrolyte
-
1.2. Lithium-ion
- 1.2.1. Solid Electrolyte
-
1.3. Flow Battery
- 1.3.1. Vanadium
- 1.3.2. Zinc Bromide
- 1.4. Other Battery Types and Electrolyte Types
- 1.5. Liquid Electrolyte
-
1.1. Lead Acid
-
2. End User
- 2.1. Electric Vehicle
- 2.2. Energy Storage
- 2.3. Consumer Electronics
- 2.4. Other End Users
Electrolyte Battery Industry Segmentation By Geography
- 1. North America
- 2. Europe
- 3. Asia Pacific
- 4. South America
- 5. Middle East and Africa
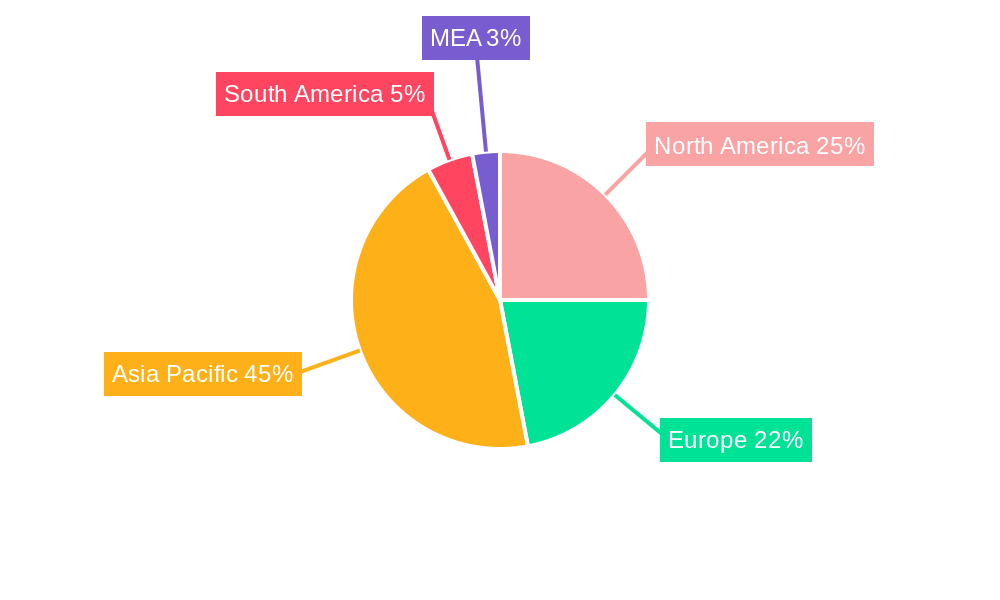
Electrolyte Battery Industry Regional Market Share
Geographic Coverage of Electrolyte Battery Industry
Electrolyte Battery Industry REPORT HIGHLIGHTS
| Aspects | Details |
|---|---|
| Study Period | 2020-2034 |
| Base Year | 2025 |
| Estimated Year | 2026 |
| Forecast Period | 2026-2034 |
| Historical Period | 2020-2025 |
| Growth Rate | CAGR of 11.60% from 2020-2034 |
| Segmentation |
|
Table of Contents
- 1. Introduction
- 1.1. Research Scope
- 1.2. Market Segmentation
- 1.3. Research Objective
- 1.4. Definitions and Assumptions
- 2. Executive Summary
- 2.1. Market Snapshot
- 3. Market Dynamics
- 3.1. Market Drivers
- 3.2. Market Restrains
- 3.3. Market Trends
- 3.4. Market Opportunities
- 4. Market Factor Analysis
- 4.1. Porters Five Forces
- 4.1.1. Bargaining Power of Suppliers
- 4.1.2. Bargaining Power of Buyers
- 4.1.3. Threat of New Entrants
- 4.1.4. Threat of Substitutes
- 4.1.5. Competitive Rivalry
- 4.2. PESTEL analysis
- 4.3. BCG Analysis
- 4.3.1. Stars (High Growth, High Market Share)
- 4.3.2. Cash Cows (Low Growth, High Market Share)
- 4.3.3. Question Mark (High Growth, Low Market Share)
- 4.3.4. Dogs (Low Growth, Low Market Share)
- 4.4. Ansoff Matrix Analysis
- 4.5. Supply Chain Analysis
- 4.6. Regulatory Landscape
- 4.7. Current Market Potential and Opportunity Assessment (TAM–SAM–SOM Framework)
- 4.8. MSR Analyst Note
- 4.1. Porters Five Forces
- 5. Market Analysis, Insights and Forecast 2021-2033
- 5.1. Market Analysis, Insights and Forecast - by Battery Type and Electrolyte Type
- 5.1.1. Lead Acid
- 5.1.1.1. Liquid Electrolyte
- 5.1.1.2. Gel Electrolyte
- 5.1.2. Lithium-ion
- 5.1.2.1. Solid Electrolyte
- 5.1.3. Flow Battery
- 5.1.3.1. Vanadium
- 5.1.3.2. Zinc Bromide
- 5.1.4. Other Battery Types and Electrolyte Types
- 5.1.5. Liquid Electrolyte
- 5.1.1. Lead Acid
- 5.2. Market Analysis, Insights and Forecast - by End User
- 5.2.1. Electric Vehicle
- 5.2.2. Energy Storage
- 5.2.3. Consumer Electronics
- 5.2.4. Other End Users
- 5.3. Market Analysis, Insights and Forecast - by Region
- 5.3.1. North America
- 5.3.2. Europe
- 5.3.3. Asia Pacific
- 5.3.4. South America
- 5.3.5. Middle East and Africa
- 5.1. Market Analysis, Insights and Forecast - by Battery Type and Electrolyte Type
- 6. Global Electrolyte Battery Industry Analysis, Insights and Forecast, 2021-2033
- 6.1. Market Analysis, Insights and Forecast - by Battery Type and Electrolyte Type
- 6.1.1. Lead Acid
- 6.1.1.1. Liquid Electrolyte
- 6.1.1.2. Gel Electrolyte
- 6.1.2. Lithium-ion
- 6.1.2.1. Solid Electrolyte
- 6.1.3. Flow Battery
- 6.1.3.1. Vanadium
- 6.1.3.2. Zinc Bromide
- 6.1.4. Other Battery Types and Electrolyte Types
- 6.1.5. Liquid Electrolyte
- 6.1.1. Lead Acid
- 6.2. Market Analysis, Insights and Forecast - by End User
- 6.2.1. Electric Vehicle
- 6.2.2. Energy Storage
- 6.2.3. Consumer Electronics
- 6.2.4. Other End Users
- 6.1. Market Analysis, Insights and Forecast - by Battery Type and Electrolyte Type
- 7. North America Electrolyte Battery Industry Analysis, Insights and Forecast, 2020-2032
- 7.1. Market Analysis, Insights and Forecast - by Battery Type and Electrolyte Type
- 7.1.1. Lead Acid
- 7.1.1.1. Liquid Electrolyte
- 7.1.1.2. Gel Electrolyte
- 7.1.2. Lithium-ion
- 7.1.2.1. Solid Electrolyte
- 7.1.3. Flow Battery
- 7.1.3.1. Vanadium
- 7.1.3.2. Zinc Bromide
- 7.1.4. Other Battery Types and Electrolyte Types
- 7.1.5. Liquid Electrolyte
- 7.1.1. Lead Acid
- 7.2. Market Analysis, Insights and Forecast - by End User
- 7.2.1. Electric Vehicle
- 7.2.2. Energy Storage
- 7.2.3. Consumer Electronics
- 7.2.4. Other End Users
- 7.1. Market Analysis, Insights and Forecast - by Battery Type and Electrolyte Type
- 8. Europe Electrolyte Battery Industry Analysis, Insights and Forecast, 2020-2032
- 8.1. Market Analysis, Insights and Forecast - by Battery Type and Electrolyte Type
- 8.1.1. Lead Acid
- 8.1.1.1. Liquid Electrolyte
- 8.1.1.2. Gel Electrolyte
- 8.1.2. Lithium-ion
- 8.1.2.1. Solid Electrolyte
- 8.1.3. Flow Battery
- 8.1.3.1. Vanadium
- 8.1.3.2. Zinc Bromide
- 8.1.4. Other Battery Types and Electrolyte Types
- 8.1.5. Liquid Electrolyte
- 8.1.1. Lead Acid
- 8.2. Market Analysis, Insights and Forecast - by End User
- 8.2.1. Electric Vehicle
- 8.2.2. Energy Storage
- 8.2.3. Consumer Electronics
- 8.2.4. Other End Users
- 8.1. Market Analysis, Insights and Forecast - by Battery Type and Electrolyte Type
- 9. Asia Pacific Electrolyte Battery Industry Analysis, Insights and Forecast, 2020-2032
- 9.1. Market Analysis, Insights and Forecast - by Battery Type and Electrolyte Type
- 9.1.1. Lead Acid
- 9.1.1.1. Liquid Electrolyte
- 9.1.1.2. Gel Electrolyte
- 9.1.2. Lithium-ion
- 9.1.2.1. Solid Electrolyte
- 9.1.3. Flow Battery
- 9.1.3.1. Vanadium
- 9.1.3.2. Zinc Bromide
- 9.1.4. Other Battery Types and Electrolyte Types
- 9.1.5. Liquid Electrolyte
- 9.1.1. Lead Acid
- 9.2. Market Analysis, Insights and Forecast - by End User
- 9.2.1. Electric Vehicle
- 9.2.2. Energy Storage
- 9.2.3. Consumer Electronics
- 9.2.4. Other End Users
- 9.1. Market Analysis, Insights and Forecast - by Battery Type and Electrolyte Type
- 10. South America Electrolyte Battery Industry Analysis, Insights and Forecast, 2020-2032
- 10.1. Market Analysis, Insights and Forecast - by Battery Type and Electrolyte Type
- 10.1.1. Lead Acid
- 10.1.1.1. Liquid Electrolyte
- 10.1.1.2. Gel Electrolyte
- 10.1.2. Lithium-ion
- 10.1.2.1. Solid Electrolyte
- 10.1.3. Flow Battery
- 10.1.3.1. Vanadium
- 10.1.3.2. Zinc Bromide
- 10.1.4. Other Battery Types and Electrolyte Types
- 10.1.5. Liquid Electrolyte
- 10.1.1. Lead Acid
- 10.2. Market Analysis, Insights and Forecast - by End User
- 10.2.1. Electric Vehicle
- 10.2.2. Energy Storage
- 10.2.3. Consumer Electronics
- 10.2.4. Other End Users
- 10.1. Market Analysis, Insights and Forecast - by Battery Type and Electrolyte Type
- 11. Middle East and Africa Electrolyte Battery Industry Analysis, Insights and Forecast, 2020-2032
- 11.1. Market Analysis, Insights and Forecast - by Battery Type and Electrolyte Type
- 11.1.1. Lead Acid
- 11.1.1.1. Liquid Electrolyte
- 11.1.1.2. Gel Electrolyte
- 11.1.2. Lithium-ion
- 11.1.2.1. Solid Electrolyte
- 11.1.3. Flow Battery
- 11.1.3.1. Vanadium
- 11.1.3.2. Zinc Bromide
- 11.1.4. Other Battery Types and Electrolyte Types
- 11.1.5. Liquid Electrolyte
- 11.1.1. Lead Acid
- 11.2. Market Analysis, Insights and Forecast - by End User
- 11.2.1. Electric Vehicle
- 11.2.2. Energy Storage
- 11.2.3. Consumer Electronics
- 11.2.4. Other End Users
- 11.1. Market Analysis, Insights and Forecast - by Battery Type and Electrolyte Type
- 12. Competitive Analysis
- 12.1. Company Profiles
- 12.1.1 UBE Industries Ltd
- 12.1.1.1. Company Overview
- 12.1.1.2. Products
- 12.1.1.3. Company Financials
- 12.1.1.4. SWOT Analysis
- 12.1.2 Targray Industries Inc
- 12.1.2.1. Company Overview
- 12.1.2.2. Products
- 12.1.2.3. Company Financials
- 12.1.2.4. SWOT Analysis
- 12.1.3 Mitsui Chemicals Inc
- 12.1.3.1. Company Overview
- 12.1.3.2. Products
- 12.1.3.3. Company Financials
- 12.1.3.4. SWOT Analysis
- 12.1.4 NEI Corporation
- 12.1.4.1. Company Overview
- 12.1.4.2. Products
- 12.1.4.3. Company Financials
- 12.1.4.4. SWOT Analysis
- 12.1.5 3M Co
- 12.1.5.1. Company Overview
- 12.1.5.2. Products
- 12.1.5.3. Company Financials
- 12.1.5.4. SWOT Analysis
- 12.1.6 Guangzhou Tinci Materials Technology Co Ltd
- 12.1.6.1. Company Overview
- 12.1.6.2. Products
- 12.1.6.3. Company Financials
- 12.1.6.4. SWOT Analysis
- 12.1.7 Mitsubishi Chemical Holdings Corporation
- 12.1.7.1. Company Overview
- 12.1.7.2. Products
- 12.1.7.3. Company Financials
- 12.1.7.4. SWOT Analysis
- 12.1.8 Shenzhen Capchem Technology Co Ltd
- 12.1.8.1. Company Overview
- 12.1.8.2. Products
- 12.1.8.3. Company Financials
- 12.1.8.4. SWOT Analysis
- 12.1.1 UBE Industries Ltd
- 12.2. Market Entropy
- 12.2.1 Company's Key Areas Served
- 12.2.2 Recent Developments
- 12.3. Company Market Share Analysis 2025
- 12.3.1 Top 5 Companies Market Share Analysis
- 12.3.2 Top 3 Companies Market Share Analysis
- 12.4. List of Potential Customers
- 13. Research Methodology
List of Figures
- Figure 1: Global Electrolyte Battery Industry Revenue Breakdown (Million, %) by Region 2025 & 2033
- Figure 2: North America Electrolyte Battery Industry Revenue (Million), by Battery Type and Electrolyte Type 2025 & 2033
- Figure 3: North America Electrolyte Battery Industry Revenue Share (%), by Battery Type and Electrolyte Type 2025 & 2033
- Figure 4: North America Electrolyte Battery Industry Revenue (Million), by End User 2025 & 2033
- Figure 5: North America Electrolyte Battery Industry Revenue Share (%), by End User 2025 & 2033
- Figure 6: North America Electrolyte Battery Industry Revenue (Million), by Country 2025 & 2033
- Figure 7: North America Electrolyte Battery Industry Revenue Share (%), by Country 2025 & 2033
- Figure 8: Europe Electrolyte Battery Industry Revenue (Million), by Battery Type and Electrolyte Type 2025 & 2033
- Figure 9: Europe Electrolyte Battery Industry Revenue Share (%), by Battery Type and Electrolyte Type 2025 & 2033
- Figure 10: Europe Electrolyte Battery Industry Revenue (Million), by End User 2025 & 2033
- Figure 11: Europe Electrolyte Battery Industry Revenue Share (%), by End User 2025 & 2033
- Figure 12: Europe Electrolyte Battery Industry Revenue (Million), by Country 2025 & 2033
- Figure 13: Europe Electrolyte Battery Industry Revenue Share (%), by Country 2025 & 2033
- Figure 14: Asia Pacific Electrolyte Battery Industry Revenue (Million), by Battery Type and Electrolyte Type 2025 & 2033
- Figure 15: Asia Pacific Electrolyte Battery Industry Revenue Share (%), by Battery Type and Electrolyte Type 2025 & 2033
- Figure 16: Asia Pacific Electrolyte Battery Industry Revenue (Million), by End User 2025 & 2033
- Figure 17: Asia Pacific Electrolyte Battery Industry Revenue Share (%), by End User 2025 & 2033
- Figure 18: Asia Pacific Electrolyte Battery Industry Revenue (Million), by Country 2025 & 2033
- Figure 19: Asia Pacific Electrolyte Battery Industry Revenue Share (%), by Country 2025 & 2033
- Figure 20: South America Electrolyte Battery Industry Revenue (Million), by Battery Type and Electrolyte Type 2025 & 2033
- Figure 21: South America Electrolyte Battery Industry Revenue Share (%), by Battery Type and Electrolyte Type 2025 & 2033
- Figure 22: South America Electrolyte Battery Industry Revenue (Million), by End User 2025 & 2033
- Figure 23: South America Electrolyte Battery Industry Revenue Share (%), by End User 2025 & 2033
- Figure 24: South America Electrolyte Battery Industry Revenue (Million), by Country 2025 & 2033
- Figure 25: South America Electrolyte Battery Industry Revenue Share (%), by Country 2025 & 2033
- Figure 26: Middle East and Africa Electrolyte Battery Industry Revenue (Million), by Battery Type and Electrolyte Type 2025 & 2033
- Figure 27: Middle East and Africa Electrolyte Battery Industry Revenue Share (%), by Battery Type and Electrolyte Type 2025 & 2033
- Figure 28: Middle East and Africa Electrolyte Battery Industry Revenue (Million), by End User 2025 & 2033
- Figure 29: Middle East and Africa Electrolyte Battery Industry Revenue Share (%), by End User 2025 & 2033
- Figure 30: Middle East and Africa Electrolyte Battery Industry Revenue (Million), by Country 2025 & 2033
- Figure 31: Middle East and Africa Electrolyte Battery Industry Revenue Share (%), by Country 2025 & 2033
List of Tables
- Table 1: Global Electrolyte Battery Industry Revenue Million Forecast, by Battery Type and Electrolyte Type 2020 & 2033
- Table 2: Global Electrolyte Battery Industry Revenue Million Forecast, by End User 2020 & 2033
- Table 3: Global Electrolyte Battery Industry Revenue Million Forecast, by Region 2020 & 2033
- Table 4: Global Electrolyte Battery Industry Revenue Million Forecast, by Battery Type and Electrolyte Type 2020 & 2033
- Table 5: Global Electrolyte Battery Industry Revenue Million Forecast, by End User 2020 & 2033
- Table 6: Global Electrolyte Battery Industry Revenue Million Forecast, by Country 2020 & 2033
- Table 7: Global Electrolyte Battery Industry Revenue Million Forecast, by Battery Type and Electrolyte Type 2020 & 2033
- Table 8: Global Electrolyte Battery Industry Revenue Million Forecast, by End User 2020 & 2033
- Table 9: Global Electrolyte Battery Industry Revenue Million Forecast, by Country 2020 & 2033
- Table 10: Global Electrolyte Battery Industry Revenue Million Forecast, by Battery Type and Electrolyte Type 2020 & 2033
- Table 11: Global Electrolyte Battery Industry Revenue Million Forecast, by End User 2020 & 2033
- Table 12: Global Electrolyte Battery Industry Revenue Million Forecast, by Country 2020 & 2033
- Table 13: Global Electrolyte Battery Industry Revenue Million Forecast, by Battery Type and Electrolyte Type 2020 & 2033
- Table 14: Global Electrolyte Battery Industry Revenue Million Forecast, by End User 2020 & 2033
- Table 15: Global Electrolyte Battery Industry Revenue Million Forecast, by Country 2020 & 2033
- Table 16: Global Electrolyte Battery Industry Revenue Million Forecast, by Battery Type and Electrolyte Type 2020 & 2033
- Table 17: Global Electrolyte Battery Industry Revenue Million Forecast, by End User 2020 & 2033
- Table 18: Global Electrolyte Battery Industry Revenue Million Forecast, by Country 2020 & 2033
Frequently Asked Questions
1. What is the projected Compound Annual Growth Rate (CAGR) of the Electrolyte Battery Industry?
The projected CAGR is approximately 11.60%.
2. Which companies are prominent players in the Electrolyte Battery Industry?
Key companies in the market include UBE Industries Ltd, Targray Industries Inc, Mitsui Chemicals Inc, NEI Corporation, 3M Co, Guangzhou Tinci Materials Technology Co Ltd, Mitsubishi Chemical Holdings Corporation, Shenzhen Capchem Technology Co Ltd.
3. What are the main segments of the Electrolyte Battery Industry?
The market segments include Battery Type and Electrolyte Type, End User.
4. Can you provide details about the market size?
The market size is estimated to be USD XX Million as of 2022.
5. What are some drivers contributing to market growth?
Increasing Energy Demand.; Increasing Export Opportunities.
6. What are the notable trends driving market growth?
Lithium-ion Battery Expected to Dominate the Market.
7. Are there any restraints impacting market growth?
Volatility in Energy Prices.
8. Can you provide examples of recent developments in the market?
In February 2022, US Vanadium announced an expanded purchase agreement under which Austrian-based Enerox, which sells vanadium redox flow battery (VRFB) systems under its brand name CellCube, can purchase up to 3 million additional liters/year of US Vanadium's ultra-high-purity electrolyte with a price cap over the next five years. The agreement boosts the initial purchase agreement for 580,000 liters/year of US Vanadium electrolyte, announced in September 2021.
9. What pricing options are available for accessing the report?
Pricing options include single-user, multi-user, and enterprise licenses priced at USD 4750, USD 5250, and USD 8750 respectively.
10. Is the market size provided in terms of value or volume?
The market size is provided in terms of value, measured in Million.
11. Are there any specific market keywords associated with the report?
Yes, the market keyword associated with the report is "Electrolyte Battery Industry," which aids in identifying and referencing the specific market segment covered.
12. How do I determine which pricing option suits my needs best?
The pricing options vary based on user requirements and access needs. Individual users may opt for single-user licenses, while businesses requiring broader access may choose multi-user or enterprise licenses for cost-effective access to the report.
13. Are there any additional resources or data provided in the Electrolyte Battery Industry report?
While the report offers comprehensive insights, it's advisable to review the specific contents or supplementary materials provided to ascertain if additional resources or data are available.
14. How can I stay updated on further developments or reports in the Electrolyte Battery Industry?
To stay informed about further developments, trends, and reports in the Electrolyte Battery Industry, consider subscribing to industry newsletters, following relevant companies and organizations, or regularly checking reputable industry news sources and publications.
Methodology
Step 1 - Identification of Relevant Samples Size from Population Database


Step 2 - Approaches for Defining Global Market Size (Value, Volume* & Price*)

Note*: In applicable scenarios
Step 3 - Data Sources
Primary Research
- Web Analytics
- Survey Reports
- Research Institute
- Latest Research Reports
- Opinion Leaders
Secondary Research
- Annual Reports
- White Paper
- Latest Press Release
- Industry Association
- Paid Database
- Investor Presentations

Step 4 - Data Triangulation
Involves using different sources of information in order to increase the validity of a study
These sources are likely to be stakeholders in a program - participants, other researchers, program staff, other community members, and so on.
Then we put all data in single framework & apply various statistical tools to find out the dynamic on the market.
During the analysis stage, feedback from the stakeholder groups would be compared to determine areas of agreement as well as areas of divergence